

Abstract
The EAAT2 glutamate transporter, accounts for >90% of hippocampal glutamate uptake. Although EAAT2 is predominantly expressed in astrocytes, ∼10% of EAAT2 molecules are found in axon terminals. Despite the lower level of EAAT2 expression in glutamatergic terminals, when hippocampal slices are incubated with low concentration of d-aspartate (an EAAT2 substrate), axon terminals accumulate d-aspartate as quickly as astroglia. This implies an unexplained mismatch between the distribution of EAAT2 protein and of EAAT2-mediated transport activity. One hypothesis is that (1) heteroexchange of internal substrate with external substrate is considerably faster than net uptake and (2) terminals favor heteroexchange because of high levels of internal glutamate. However, it is currently unknown whether heteroexchange and uptake have similar or different rates. To address this issue, we used a reconstituted system to compare the relative rates of the two processes in rat and mice. Net uptake was sensitive to changes in the membrane potential and was stimulated by external permeable anions in agreement with the existence of an uncoupled anion conductance. By using the latter, we also demonstrate that the rate of heteroexchange also depends on the membrane potential. Additionally, our data further suggest the presence of a sodium leak in EAAT2. By incorporating the new findings in our previous model of glutamate uptake by EAAT2, we predict that the voltage sensitivity of exchange is caused by the voltage-dependent third Na+ binding. Further, both our experiments and simulations suggest that the relative rates of net uptake and heteroexchange are comparable in EAAT2.
Keywords: glutamate uptake, liposomes, membrane protein purification, neuronal glutamate uptake, neurotransmitter transport, transport kinetics
Introduction
The importance of glutamate uptake for controlling the excitatory action of glutamate is well established (Danbolt, 2001; Beart and O'Shea, 2007; Tzingounis and Wadiche, 2007; Vandenberg and Ryan, 2013). The prevailing view is that most brain glutamate uptake is mediated by astroglia because EAAT2 (GLT-1; slc1a2) is the major glutamate transporter in the brain (Haugeto et al., 1996; Tanaka et al., 1997; Otis and Kavanaugh, 2000; Bergles et al., 2002; Holmseth et al., 2012) and EAAT2 is predominantly expressed in astrocytes (Danbolt et al., 1992; Lehre et al., 1995). However, it has been shown electron microscopically that glutamatergic terminals in CA1 hippocampal slices accumulate d-aspartate and radiolabeled glutamate (Beart, 1976; Gundersen et al., 1993; Danbolt, 2001) in an EAAT2-dependent manner. The uptake in glutamatergic terminals is as fast as in astrocytes, even though the glutamatergic terminals only express 10% of the total EAAT2 protein (Furness et al., 2008) (see Fig. 1A). The mechanism that leads to the high rate of d-aspartate accumulation in glutamatergic terminals is currently unknown. Glutamate transporters are able to perform (see Fig. 1B) both net uptake of glutamate from the extracellular fluid and heteroexchange, that is, exchange of external and internal substrates in 1:1 ratio (Danbolt and Storm-Mathisen, 1986; Pines and Kanner, 1990; Volterra et al., 1996; Zerangue and Kavanaugh, 1996; Kavanaugh et al., 1997). The latter process does not contribute to glutamate clearance as there is no net transport. However, it might explain the disproportionally strong labeling of glutamatergic terminals provided heteroexchange is substantially faster than net uptake. This has been previously suggested based on synaptosomes and on modeling electrophysiological measurements (Erecińska and Nelson, 1987; for review, see Grewer and Rauen, 2005). But there is no consensus on whether exchange or net uptake is faster. Measurements of the transporter cycling rate using the glutamate transport-associated anion current argue that the anion current recovery rate is much slower when EAAT2 operates in the exchange mode than the transport mode (Otis and Kavanaugh, 2000). This suggests that heteroexchange proceeds with slower kinetics than net uptake. Thus, it is currently unknown whether the rates of net uptake and heteroexchange are similar or different. It is important to determine these rates, not only for the interpretation of available data on uptake in glutamatergic terminals, but also because kinetics is a key to understanding the molecular mechanism of EAAT2 and the roles of EAAT2 in disease states in which transporters may catalyze glutamate release (Rossi et al., 2000; Larsson et al., 2004; Grewer and Rauen, 2005; Tzingounis and Wadiche, 2007; Gouaux, 2009; Vandenberg and Ryan, 2013).
Figure 1.

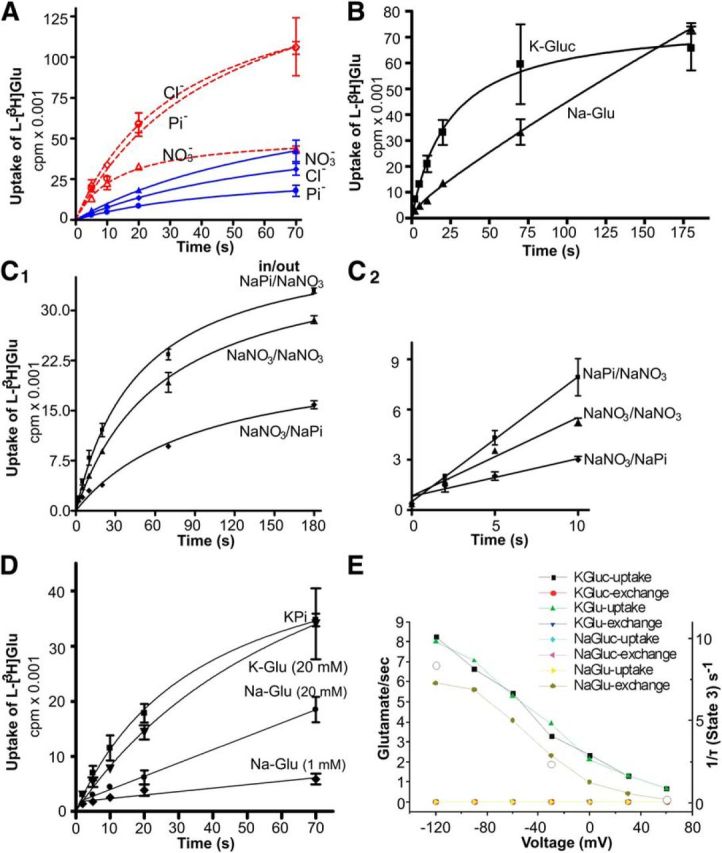
A, A schematic illustration of the mismatch observed in hippocampal slices between glutamate transporter distributions (red dots) and the rates of substrate accumulation (red arrows). Most of the hippocampal uptake activity (95%) is due to EAAT2 (Haugeto et al., 1996; Tanaka et al., 1997; Holmseth et al., 2012), but (at least in the hippocampus CA1) most of EAAT2 (80%–90%) is in astroglia, whereas 5%–15% is in axon terminals (Furness et al., 2008). Despite that, approximately half of the uptake of externally added substrates goes into terminals (Furness et al., 2008). This mismatch is at present unexplained. Although EAAT3 is neuronal, it is limited to the somatodendritic compartment (including dendritic spines) but is expressed at much lower levels than EAAT2 and does therefore not contribute much (Holmseth et al., 2012). B, Two modes of glutamate translocation (Danbolt, 2001). Large open circles represent cells; smaller filled gray circles represent transporters. Stoichiometric transport is indicated with red arrows and uncoupled anion (A−) fluxes by blue arrows. Net uptake is a process in which external substrate is taken up in a manner dependent on internal K+. This leads to net removal of substrate from the extracellular fluid. In contrast, (hetero)exchange is a process in which internal unlabeled substrate is exchanged with external labeled substrate in a 1:1 relationship. The latter process does not alter the number of substrate molecules on each side of the membrane but allows molecules to switch location. This process requires Na+, but not K+, and occurs in the absence of transmembrane gradients. Consequently, dissipation of transmembrane ion gradients with the ionophore nigericin (Nig.) abolishes net uptake but does not have much effect on exchange (H). In the absence of K+, the transporter is locked in exchange mode. C, Net glutamate uptake versus heteroexchange in a reconstituted system. Liposomes with rat brain glutamate transporters were loaded with different internal media: K-Gluc (20 mm K-gluconate, 15 mm potassium phosphate (KPi), 145 mm KCl, and 1% glycerol), K-Glu (20 mm K-glutamate, 15 mm KPi, 145 mm KCl, and 1% glycerol), Na-Gluc (20 mm Na-gluconate, 15 mm NaPi, 145 mm NaCl, and 1% glycerol), or Na-Glu (20 mm Na-glutamate, 15 mm NaPi, 145 mm NaCl, and 1% glycerol) as indicated. The uptake reactions were started by adding the proteoliposomes to reaction buffer (2 μm unlabeled glutamate, 50 nm l-[3H]glutamate, 20 mm Na-gluconate, 15 mm NaPi, 145 mm NaCl, and 1% glycerol) and terminated at different time points (2, 5, 10, 20, 70, or 180 s) as indicated. Data represent average ± SEM of one representative experiment with three replicates (n = 5). Uptake of radioactivity requires either internal K+ or internal substrate. Under these conditions (no valinomycin, high levels of chloride), glutamate-loaded liposomes were found to perform better than those loaded only with K+. D, Magnification of the first 20 s of C. E–H, The glutamate uptake activity measured with the present reconstituted system is mostly due to EAAT2 when forebrain tissue is used as the source of transporter proteins. E, Potassium-loaded proteoliposomes prepared from WT and EAAT2 (KO) mice (Tanaka et al., 1997) were diluted into a large volume of a sodium-containing medium with radiolabeled glutamate to measure net uptake. Internal medium: 135 mm KPi with 1% glycerol. External medium: 135 mm NaPi, 1% glycerol, 3 μm valinomycin, 2 μm Na-glutamate, 1.4 μCi l-[3H]glutamate). Liposomes prepared from EAAT2-deficient animals had little uptake activity compared with those prepared from WT animals. F, Sodium- and glutamate-loaded proteoliposomes, prepared from WT and EAAT2 (KO) mice (Tanaka et al., 1997), were diluted into a large volume of a sodium containing medium with radiolabeled glutamate to measure heteroexchange. Internal medium: 120 mm NaPi, 20 mm Na-glutamate, and 1% glycerol. External medium: 135 mm NaPi, 1% glycerol, 2 μm Na-glutamate, 1.4 μCi l-[3H]glutamate. Data represent average ± SEM of one representative experiment with triplicates. Most of the heteroexchange activity was EAAT2-dependent. G, Addition of nigericin (Nig.) to potassium-loaded proteoliposomes abolished the uptake activities (n = 3). H, Glutamate uptake activities by proteoliposomes loaded with sodium and glutamate were insensitive to nigericin (n = 3).
Here we determined the relative rates of the two transport modes using radiolabeled substrates in combination with a reconstituted system based on solubilized glutamate transporters reconstituted in liposomes. The primary novel findings of our study are as follows: (1) exchange is voltage sensitive, (2) the rates of net uptake and exchange are similar, and (3) a sodium leak is present in EAAT2 due to transporter cycling from the outward to the inward conformation in the absence of glutamate.
Materials and Methods
Materials.
d-[3H]Aspartic acid (38 Ci/mmol), l- [3H]glutamic acid (49 or 55 Ci/mmol), [3H]GABA (89 Ci/mmol), and Sephadex G-25 Fine and G-50 Fine were from GE Healthcare. Cholic acid was prepared as described previously (Danbolt et al., 1990). Nitrocellulose filters (HAWP; 0.45 μm pores) were from Millipore. Synthetic phospholipids (1-stearoyl-2-arachidonyl-sn-glycero-3-phosphocholine) were from Avanti Polar Lipids. Dihydrokainic acid was from Tocris Bioscience. PMB-threo-β-benzyloxyaspartate (TBOA) was a generous gift from Dr. Keiko Shimamoto (Shimamoto and Shigeri, 2006; Shimamoto, 2008). All other reagents were obtained from either Sigma or from Fluka.
Animals.
All animal experimentation was performed in accordance with the National Institute of Health Guide for the Care and Use of Laboratory Animals (National Institutes of Health Publications 80/23) revised 1996 and the European Communities Council Directive of 24 November 1986 (86/609/EEC). Formal approval to conduct the experiments described was obtained from the animal subjects review board of our institutions. Care was taken to avoid suffering and minimize the number of animals used. Male Wistar rats (200–250 g; 71- to 79-d-old) from Møllegaard Hansen and C57Black/6 (3 weeks old) were kept in the animal facility at the Institute of Basic Medical Sciences. Mice were housed and bred as described previously (Lehre et al., 2011). Mice lacking EAAT2 (GLT-1; slc1a2) were originally generated by Tanaka et al. (1997). The knock-out and wild-type (WT) mice were produced by breeding heterozygous mice in C57 Bl/6 background. Because the EAAT2 knock-out mice tended to die prematurely (Tanaka et al., 1997), the mice used in this study were ∼3 weeks old and of both genders. At this age, EAAT2 and EAAT1 (GLAST; slc1a3) expression levels are approximately half of the adult level (Furuta et al., 1997; Ullensvang et al., 1997; Diamond, 2005). The forebrains were quickly taken out, chilled on dry ice and stored at −70°C until used to avoid proteolysis (Li et al., 2012). All efforts were made to minimize the number of animals used and their suffering.
Preparation of the reconstitution mixture.
Crude bovine brain lipids (100 mg/ml) were prepared as described previously (Folch et al., 1957). Asolectin stock solutions were prepared by dissolving 35.6 g soybean asolectin (mostly l-α-phosphatidylcholine) in chloroform-methanol (80 + 20) to a total volume of 100 ml. Stock solutions of lipids were kept under nitrogen atmosphere in brown bottles at −20°C. If not stated otherwise, the reconstitution mixture (Danbolt et al., 1990) was made by mixing 480 μl of the asolectin stock solution with 240 μl of the brain lipid stock solution (∼18 mg lipid). The organic solvents were removed by first flushing with a stream of nitrogen and then by keeping the lipid mixture under high vacuum for at least 1 h. The dried lipids were subsequently suspended in 4 ml internal medium (as stated) with 89 μl 20% (w/v) cholate. To suspend the lipids without oxidizing them, the tube was flushed with nitrogen and sealed, whirl mixed until all the lipid had been removed from the tube walls and a homogenous milky white mixture had been obtained free of visible particles. Then, 1 ml 3 m NaCl was added. When stated, synthetic 1-stearoyl-2-arachidonyl-sn-glycero-3-phosphocholine was used instead of soybean asolectin, and cholesterol was used instead of brain lipids.
Reconstitution of glutamate transporters into liposomes.
This was done as previously described (Danbolt et al., 1990). Rat or mice forebrains were homogenized in 25 times their total volume of ice-cold solubilization buffer: 1.25% cholate, 0.5 m NaCl, 0.1 m sodium phosphate (NaPi) buffer, pH 7.4, and 1 mm phenylmethylsulfonyl fluoride as protease inhibitor. The mixture was incubated on ice for 10 min before centrifugation (Beckmann JA-20 fixed angle rotor, 39,000 × g, 18,000 rpm, 20 min, 4°C). The supernatant (cholate extract) was mixed with 1.5 times its volume of the above described reconstitution mixture. This means that the reconstitution mixture contained ∼15 times more lipids than the endogenous lipids present in the rat of mouse brain extracts. The mixtures were incubated on ice (15 min) and gel filtrated on spin columns (see below) to remove detergent and replace the reconstitution buffer with the desired internal medium.
The liposomes form spontaneously during the gel filtration, and the buffer with which these columns are equilibrated becomes trapped inside the liposomes when they form. Thus, the liposomes are both loaded with and suspended in the internal medium. The internal media were supplemented with 0–20 mm glutamate or gluconate as stated. In cases when the internal medium contained compounds that should not be in the external medium (e.g., when loaded with a high concentration of glutamate), the already formed liposomes were washed on the outside by passing them (twice) through another set of gel filtration columns equilibrated with external medium. Each filtration reduces the concentration of externally added radiolabeled glutamate by a factor of ∼5000 (Trotti et al., 1995).
Rapid gel filtration on spin columns.
This was done as described previously (Trotti et al., 1995). Spin columns have been used in this study both for reconstitution of glutamate transporters and for replacing the external medium for the proteoliposomes with another medium. Sephadex G-50 or G-25 fine was swollen in buffer overnight and packed in plastic syringes (1 ml) from which the pistons have been removed and the outlets closed by cotton fiber. The columns are then centrifuged (1200 rpm, 240 × g; 2 min, 4°C) to remove the void volume. After applying the sample (0.2 ml) and allowing it to sink into the gel, the columns are centrifuged again (1740 rpm, 500 × g, 2 min, 4°C).The conditions were adjusted using phenol red and Blue-Dextran 2000 as low and high molecular mass marker, respectively.
Uptake reaction for radioactive amino acid.
Uptake of radioactive amino acid was measured as described previously (Danbolt et al., 1990). External medium was sterile-filtered (MILLEXHA, Filter Unite 0.45 μm pore size) to eliminate background caused by bacteria accumulating radioactive glutamate. Immediately before start of the uptake reaction, 20 μl proteoliposomes were diluted into 0.5–3.5 ml (as stated) sterilized external medium. A potassium selective ionophore (3 μm valinomycin) was added as stated. Valinomycin allows K+ to pass through the membrane down its concentration gradient creating a negative membrane potential (Pressman and Fahim, 1982). The reactions were started either by addition of 20 μl radioactive substrate or by addition of liposomes. When not stated, the external substrate (d-[3H]aspartate or l- [3H]glutamate) concentration was 2 μm (including 1.4 μCi [3H]labeled substrate). The incubation time varied from 2 to 1200 s as indicated. The reactions were terminated by the dilution of 2 ml ice-cold external medium (without amino acids) and rapid filtration through Millipore HAWP filters (0.45 μm pores). The filters were rinsed with ice-cold washing solution three times and then dissolved in 3.5 ml Filter-Count (Packard) for liquid scintillation counting. Addition of the ionophore nigericin (Pressman and Fahim, 1982), dihydrokainic acid (a selective EAAT2 competitive blocker) (Arriza et al., 1994; Bridges et al., 1999), or the nonselective EAAT blocker PMB-TBOA (Shimamoto et al., 1998) to the external medium served as negative controls. A number of different buffer and salt combinations were tested as stated. Glycerol (1%) was added as a mild antioxidant (stabilizer) in all solutions used here.
Insignificant leakage of glutamate from the liposomes.
The first data (see Fig. 1) indicated that exchange was faster than net uptake in agreement with the literature. However, the difference was only by a factor of 2 and not by a factor of 10. This raised the question whether unlabeled glutamate was leaking from the liposomes. If so, the rate of exchange would be underestimated relative to net uptake for two reasons. First, the liposomes would run out of internal substrate. Second, the external radiolabeled substrate would be mixed with unlabeled glutamate and resulting in lower specific activity. The internal volume of the liposomes used here represents ∼0.5 μl per 20 μl liposome suspension (Trotti et al., 1995; N.C.D., unpublished observation). If all glutamate from liposomes preloaded with 20 mm glutamate should leak out to 0.35 ml of external medium, then the external concentration would be 29 μm. Insufficient washing of preloaded liposomes (to remove internal medium still present on the outside after reconstitution) would have the same effect. This was tested (data not shown) by varying the volume of the external medium by a factor of 10 and by washing (gel filtering) the preloaded liposomes twice with a variable time delay between the two washes. If unlabeled glutamate caused inhibition of uptake of radioactivity, then the inhibition should be less if liposomes were incubated in a larger volume. Similarly, if glutamate was leaking out, then liposomes incubated for a longer time before the second wash should have less internal glutamate and should thereby accumulate less radioactive substrate by heteroexchange. Increasing the incubation volume had a large effect on liposomes washed only once, indicating that two washes was better than one. On the other hand, delaying the second washing step had no significant effect, implying that the leak from the liposomes was insignificant (data not shown).
Computer modeling.
A 16-state model (see Figs. 3A and 4A) was simulated using an in-house program written in Pascal to solve the differential equations for the 16-state model. Single transporters were simulated under different conditions (uptake and exchange) and different voltages. The number of completed uptake cycles and exchanges per second, as well as the relative time spent in each state, was determined for simulations of 100,000 transitions for each condition.
Figure 3.

A, EAAT2 model with the different states numbered. B, C, A time course of a transporter in (B) uptake and (C) exchange conditions. D, E, Percentage time each state is occupied by the transporter in uptake (D) and exchange (E) conditions. F, Dose–response for EAAT2 model in uptake and exchange conditions. B–F, All modeled with 2 μm external glutamate. Solutions. Intracellular: K-Glu = 180 mm K+ and 20 mm glutamate; Na-Glu = 180 mm Na+ and 20 mm glutamate. Extracellular: 180 mm Na+ plus glutamate as indicated.
Figure 4.
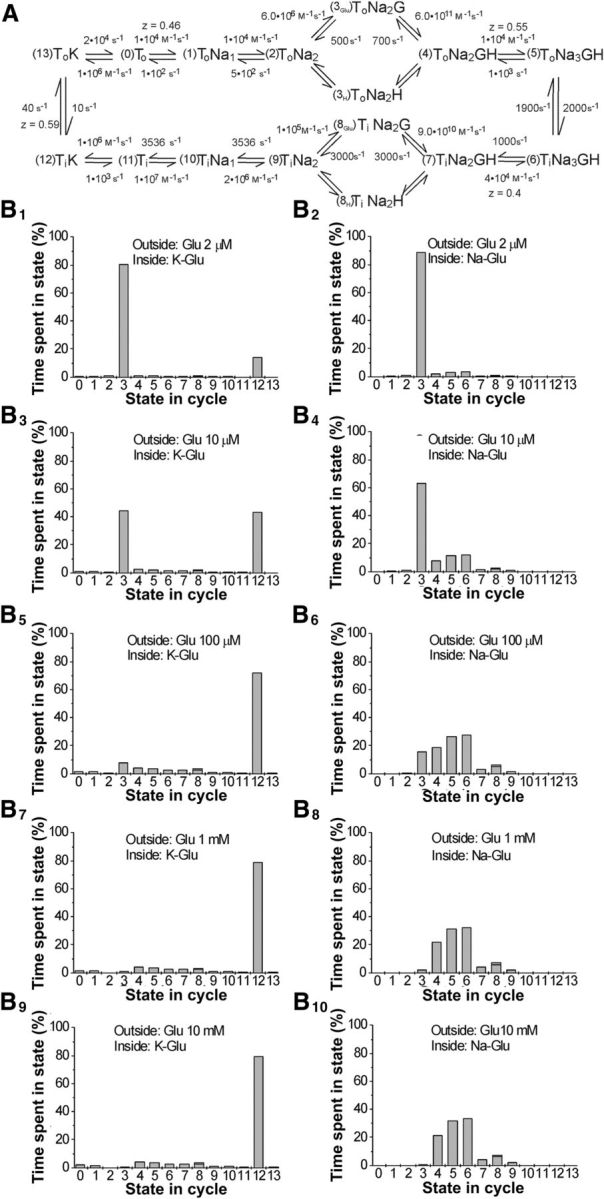
A, EAAT2 model with states and rates. The model rates were based on previous work (Bergles et al., 2002) that studied the relationship between the EAAT2 anion and coupled currents using fast application of glutamate in outside-out patches under a variety or experimental protocols (i.e., glutamate concentration and voltage steps) and under different cytosolic solutions. Therefore, the model rates were constrained based on these series of experiments and adjusted accordingly to best fit the averaged transporter (anion and coupled) currents recorded under the multitude of experimental conditions. The model also took into consideration previous work on EAAT2 in oocytes (Wadiche et al., 1995b) in which the voltage dependence of extracellular Na binding and the EAAT2 glutamate turnover rate were estimated in intact oocytes. B, The percentage of time each state is occupied by the transporter in uptake (left) and exchange (right) conditions for different external glutamate conditions. Solutions. Intracellular: K-Glu = 180 mm K+ and 20 mm glutamate; Na-Glu = 180 mm Na+ and 20 mm glutamate. Extracellular: 180 mm Na+ plus glutamate as indicated.
Results
The overall aim of the present study was to measure the rate of exchange relative to net uptake. This meant that it was necessary to accurately measure the two processes and to distinguish between them. Thus, to examine whether we could measure exchange, we compared radiolabeled glutamate uptake in liposomes prepared from WT forebrains loaded with either 20 mm unlabeled glutamate (Glu) or gluconate (Gluc) and in a buffer that contained sodium or potassium. Because net uptake implies a full glutamate transporter cycle in which glutamate is transported inside the cell followed by transporter reorientation to the outside by K+, it follows that we can prevent net uptake by omitting K+ ions and replacing with Na+ (Fig. 1B). However, in the presence of intracellular Na+ and glutamate, transporters can reorient outside through the exchange mode.
As expected, accumulation of radiolabeled external substrate was observed in liposomes preloaded with either (1) both Na+ and glutamate, or (2) K+ (with or without additional glutamate). No accumulation was seen in liposomes that did not contain glutamate or K+ (Fig. 1C,D). The uptake was inhibited by addition of the competitive glutamate uptake blockers (TBOA or dihydrokainic acid), confirming that the accumulation of radioactivity was mediated by glutamate transporters.
Importantly, there were hardly any glutamate uptake activities in proteoliposomes prepared from forebrains of EAAT2 knock-out mice compared with those prepared from forebrains of WT mice (Fig. 1E,F). These data show that both net uptake and exchange were mainly the result of EAAT2 when young adult forebrain was used as the source of transporter protein. The proteoliposomes from knock-out mice were unable to take up l- [3H]glutamate, but were able to accumulate as much [3H]GABA as those prepared from the WT tissue (data not shown; but see Holmseth et al., 2012). This suggested that the lack of glutamate uptake is due to lack of EAAT2 and not due to artifacts (e.g., leaky liposomes). In these conditions (in the absence of valinomycin, but in Cl−-containing buffer), the relative rate of heteroexchange was faster than that of net uptake by a factor of 2 (Fig. 1D: compare Na-Glu with K-Gluc).
The uptake seen in the presence of internal K+ was abolished in the presence of nigericin (Fig. 1G), an ionophore that performs electroneutral exchange of alkali metal cations with H+ (Pressman and Fahim, 1982) and thereby runs down the sodium and potassium gradients. In contrast, the exchange-mediated accumulation seen in the presence of internal sodium and glutamate was insensitive to nigericin (Fig. 1H).
Addition of valinomycin increases the rate of uptake by potassium-loaded liposomes
The time course of glutamate uptake (Fig. 1C) suggested a nonlinear relationship with time. This is to be expected because the proteoliposomes used here were, in contrast to living cells, unable to generate ATP and thus are unable to maintain the transmembrane sodium and potassium gradients. As such, data were collected at the shortest incubation times that gave reliable measurements to minimize this problem.
When mixing the external labeled glutamate with increasing concentrations (0.2, 2, or 5 μm) of unlabeled glutamate (Fig. 2A), the uptake of radioactivity into proteoliposomes loaded with K-gluconate (K-Gluc) decreased more than those loaded with Na-glutamate (Na-Glu) and more than expected considering that the steady-state EAAT2 glutamate apparent affinity (Km) is ∼15 μm. The relative rate of net uptake was about the same as that of exchange when measured at 0.2 μm, but lower by a factor of twofold to threefold when measured at 5 μm. One explanation could be a buildup of positive charge (two positive charges moving in together with each glutamate), which inhibits uptake. Alternatively, higher substrate concentrations could lead to more rapid depletion of internal potassium at the higher transport rates.
Figure 2.

The importance of the membrane potential (dependent on potassium gradient) for the rate of net uptake. A, The effect of the concentration of external substrate for net uptake and exchange in the absence of valinomycin. Proteoliposomes were loaded with different internal media: K-Gluc (20 mm K-gluconate, 15 mm potassium phosphate (KPi), 145 mm KCl, and 1% glycerol), K-Glu (20 mm K-glutamate, 15 mm KPi, 145 mm KCl, and 1% glycerol), Na-Gluc (20 mm Na-gluconate, 15 mm NaPi, 145 mm NaCl, and 1% glycerol), Na-Glu (20 mm Na-glutamate, 15 mm NaPi, 145 mm NaCl, and 1% glycerol). The proteoliposomes were then added to reaction buffer with varying concentrations of external glutamate (0.2, 2, or 5 μm unlabeled Na-glutamate, 50 nm l-[3H]glutamate, 20 mm Na-gluconate, 15 mm NaPi, 145 mm NaCl, and 1% glycerol). The uptake reactions were terminated after 5 s. Addition of 1 mm dihydrokainate was used as negative control (*). The data represent average ± SEM of one independent experiment with three replicates (n = 2). B, Stimulation of net uptake by the addition of valinomycin. The proteoliposomes loaded with K-Gluc were added to reaction buffer containing 2 μm external glutamate. The addition of 3 μm valinomycin was indicated as a solid bar. The reaction was terminated after 5 s. The 3 μm nigericin was added as negative control (*). The figure represents average ± SEM of one representative experiment (n = 3 replicates). C, The effect of the concentration of external substrate for net uptake and exchange in the presence of valinomycin. The data represent average ± SEM of one independent experiment, each with three replicates (n = 2). D, Time course of glutamate uptake for net uptake and exchange at 2 μm external glutamate in the presence of valinomycin. The data represent average ± SEM of one independent experiment (n = 2). E, Dose–response for the data according to estimate (from data in C). F, Dose–response for the data in uptake and exchange conditions according to estimate (data from E multiplied by ([cold glu] + [hot glu])/[hot glu]).
To produce and maintain a negative membrane potential, the ionophore valinomycin, which functions as a potassium-specific transporter (Pressman and Fahim, 1982), was added. The addition of valinomycin led to increased transport in the net uptake mode with internal potassium (Fig. 2B; in agreement with previous observations, e.g., Kanner, 1983). As expected, valinomycin did not have any effect in exchange mode without internal potassium (data not shown; but compare Fig. 2A–C). When the experiment shown in Figure 1C was repeated with valinomycin (Fig. 2D), net uptake appeared faster (by factor ∼2) than exchange at 0.2 μm and equally fast at 2 μm, but not at 5 μm. The time course revealed that net uptake was rapidly weakened at prolonged incubation times and that this happened faster in the presence of valinomycin (compare Fig. 2D with Fig. 1C).
The data in Figure 2A–D can be used to estimate the Km for glutamate and the absolute rate of glutamate influx under the different conditions. The competition of cold and hot glutamate can be fitted with the equation uptake of hot glutamate = I max/(1 + [cold glutamate]/Km) (Fig. 2E). In the presence of valinomycin, uptake has a lower Km (1.2 ± 0.1 μm) compared with exchange (6.5 ± 1.3 μm). The absolute uptake can be estimated by multiplying the uptake of hot glutamate by ([hot Glu] + [cold Glu])/[hot Glu] (Fig. 2F). In the presence of valinomycin, the maximum rate of glutamate influx was 158 ± 18 per second for uptake and 325 ± 14 for exchange (arbitrary units). This suggested that uptake is moderately faster at lower glutamate concentration and that exchange is twofold faster at higher glutamate concentrations.
Considering that the transporters have been solubilized and then reconstituted, it is likely that half of the transporter complexes have the correct “outside out” orientation whereas the other half are inverted as was shown in a recent study of a recombinant bacterial transporter (Ryan et al., 2009). Currently, we cannot test this, but it seems like a reasonable assumption. If so, this brings up the question of how symmetrical the transporters are from a functional point of view. Could it be, for instance, that both outside side out and inside side out orientations are functional in exchange mode whereas only the former are active in net uptake mode? If so, the rate of net uptake would be underestimated by a factor of 2 relative to the rate of exchange. However, the prevailing view is that the transporters display a high degree of functional symmetry, but minor differences cannot be ruled out as experimental data are scarce. Thus, although the possibility exists that there may be minor differences in transport rates between correctly inserted and inverted transporters, this is unlikely to affect the main conclusions of the present study.
Model of EAAT2 also suggests that uptake and exchange have similar glutamate uptake rates
We tested a kinetic model proposed for EAAT2 (Fig. 3A) based on a number of electrophysiological experiments. To determine the amount of exchange predicted by the model, we simulated the EAAT2 model on the single-molecule level to track actual exchange events and uptake events (Fig. 3B,C). The model also allows us to determine in which state the transporter spends most time. As expected at low glutamate concentration, the transporter spends most time in the state just before glutamate binding, both in the exchange mode (Fig. 3E) and uptake mode (Fig. 3D). Surprisingly, the model suggests that rates of uptake and exchange are similar at low glutamate concentration and only a factor of two different at high glutamate concentration (Figs. 3F and 4). The model suggests that exchange is only a factor of 2 faster than uptake at higher glutamate concentration, as suggested by our radioactive uptake assays in liposomes (Fig. 2F).
The presence of anion channel in mammalian glutamate transporter
The data (Fig. 2) confirmed that glutamate uptake is electrogenic and suggested that outward flux of potassium ions through valinomycin might compensate for the transporter mediated inward flux of positive charge, thereby keeping the membrane voltage clamped at negative voltages. However, because an anion channel is present in all glutamate transporters (even though EAAT2 has the least anion conductance) (Wadiche et al., 1995a; Wadiche and Kavanaugh, 1998; Otis and Kavanaugh, 2000; Ryan and Mindell, 2007), this anion channel may also affect the membrane potential by driving the membrane potential toward the reversal potential for chloride. To investigate this, we first need to test whether we can detect the anion channel in our assay. Because phosphate is assumed to be a relatively impermeable anion and nitrate is more permeable than chloride (Wadiche and Kavanaugh, 1998), we substituted chloride in our medium with phosphate (Pi−) or nitrate (NO3−). The result (Fig. 5A) showed that the initial rate of glutamate uptake in nitrate medium was higher than that in both Pi− and Cl−, and this supports the existence of anion conductance in EAAT2 that can compensate for the charge accumulated by the glutamate uptake. However, the rate of transport is not as large as in the presence of valinomycin, suggesting that the membrane potential established by anions is not as negative as in the presence of valinomycin or that the rate of anion flux is low, thereby impeding the anions' ability to dissipate the potential as well as potassium through valinomycin (Fig. 5A). When permeant anions were omitted in the presence of valinomycin, potassium-dependent uptake was linear for longer times and the rate of net uptake appeared faster than that of exchange (Fig. 5B; compare with Fig. 2D). The rather fast decline of the rate of uptake in the presence of valinomycin and highly permeant anions (such as NO3) could be because this combination allows unrestricted neutral efflux of K+ and anions that would quickly run down the internal K+ concentration and stop glutamate uptake.
Figure 5.
A, The effect of membrane potential built by anion on the rate of net uptake. Proteoliposomes were loaded with various internal media: NO3− (100 mm KNO3, 20 mm KPi, and 1% glycerol), Cl− (100 mm KCl, 20 mm KPi, and 1% glycerol), Pi− (100 mm KPi and 1% glycerol). Then they were added into related external media containing 2 μm glutamate and sodium without valinomycin (blue solid line) or with 3 μm valinomycin (dashed red line). The data represent average ± SEM of one representative experiment with triplicates (n = 2). B, Liposomes were loaded with different internal media: K-Gluc (20 mm K-gluconate, 120 mm KPi, and 1% glycerol), Na-Glu (20 mm Na-glutamate, 120 mm NaPi, and 1% glycerol). Then the liposomes were added to reaction buffer in the presence of valinomycin and in the absence of chloride (2 μm unlabeled l-glutamate, 50 nm l-[3H]glutamate, 20 mm Na-gluconate, 120 mm NaPi, and 1% glycerol) (n = 3). C, The effect of membrane potential that was established by anion on the rate of exchange. Proteoliposomes were loaded with various internal media (indicated as “in”): NaPi (120 mm NaPi, 20 mm Na-glutamate, and 1% glycerol), NaNO3 (100 mm NaNO3, 40 mm NaPi, 20 mm Na-glutamate, and 1% glycerol), and then were added into related external media containing 2 μm glutamate (indicated as “out”): NaNO3 (100 mm NaNO3, 40 mm NaPi, 20 mm Na-gluconate, and 1% glycerol), NaPi (120 mm NaPi, 20 mm Na-gluconate, and 1% glycerol). The data represent average ± SEM of one representative experiment with triplicates (n = 2). D, The effect of intraliposomal glutamate on the rate of exchange. Proteoliposomes were loaded with various internal media: K+ (135 mm KPi and 1% glycerol), K-Glu (20 mm K-glutamate, 120 mm KPi, and 1% glycerol), Na-Glu (20 mm) (20 mm Na-glutamate, 120 mm NaPi, and 1% glycerol), Na-Glu (1 mm) (1 mm Na-glutamate, 135 mm NaPi, and 1% glycerol). They were then added into the external medium containing 135 mm NaPi, 2 μm Na-glutamate, 50 nm l- [3H]glutamate, and 3 μm valinomycin. The data represent average ± SEM of one representative experiment with triplicates (n = 5). E, Voltage dependence of uptake and exchange for the different conditions for the EAAT2 model (2 μm external glutamate). Solutions. Intracellular: K-Glu = 180 mm K+ and 20 mm glutamate; Na-Glu = 180 mm Na+ and 20 mm glutamate; K-Gluc = 180 mm K+ and 20 mm gluconate; Na-Gluc = 180 mm Na+ and 20 mm gluconate. Extracellular: 180 mm Na+ + indicated glutamate. Open circles (right axis) represent the 1/(average time) spent in State 3H (Fig. 4A) per each glutamate exchange for three different voltages during exchange conditions (Na-Glu).
Electroneutral glutamate exchange is voltage dependent
Exchange is supposed to be electroneutral, as it brings glutamate and coupled ions in and then out due to the high internal concentrations of sodium ions and glutamate to reverse and carry glutamate and ions out (Kanner and Schuldiner, 1987; Kavanaugh et al., 1997). To test whether the membrane potential can affect the rate of exchange, we exploited the anion channel in the glutamate transporters to establish the membrane potential. By manipulating the gradients of anions (e.g., NO3−) across the membrane, we can establish various membrane potentials through the anion gradient. The result showed that the accumulation of labeled glutamate by exchange was affected by membrane potentials (Fig. 5C). In retrospect, this is not too surprising because charge movement under exchange conditions has been shown in the past, thus indicating that exchange could be voltage dependent. In addition, voltage-dependent exchange has directly been shown for the homologous system ASC and ASCT2 (Bussolati et al., 1992; Zander et al., 2013). However, this is the first time that exchange in an EAAT has directly been shown to be voltage dependent. This also indicates that an anion-conducting state corresponds to a sodium- and glutamate-occupied state because in these conditions (high Na and glutamate) the transporter is in a sodium- and glutamate-bound state.
The effect of intraliposomal glutamate on the rate of exchange
Nerve terminals contain a significant amount of glutamate, which might drive the transporter to the exchange mode, as addition of nigericin (which runs down the sodium and potassium gradients) to synapsomes cannot abolish but only reduce the transport of radioactive glutamate (data not shown). As the estimated intracellular glutamate in neuron ranges from 5 to 15 mm, here we tested this effect by using the proteoliposomes loaded with different concentrations of glutamate. Figure 5D showed that the rate of exchange increases as the intraliposomal glutamate increases, whereas the rate of uptake by potassium containing proteoliposomes was not affected by it.
The effect of membrane potential on the rate of exchange is likely caused by the voltage-dependent third sodium binding
It is well known that the uptake of glutamate is voltage dependent. Our data (Fig. 5C) show that electroneutral exchange is also voltage dependent. We therefore tested the voltage dependence of exchange in our model. At low glutamate concentrations (2 μm) as in our experiments, both exchange and uptake showed similar voltage dependences in our EAAT2 model (Fig. 5E). At low glutamate concentration, the voltage dependence of the exchange is most likely due to the voltage dependence of the binding of the third sodium (See Discussion and Figs. 4A and 6). The 1/average time our model spends in the state before glutamate binding (State 3; Fig. 4A) and the experimentally determined rate of glutamate exchange have very similar voltage dependences (Fig. 5E). This State 3 is also the predominantly occupied at all voltages tested at low glutamate concentrations (Fig. 6D–F). Because glutamate binding is not voltage dependent in our model, this suggests strongly that a transition just after glutamate binding (i.e., the binding of the third sodium) confers voltage dependence to exchange in our model. Other transitions in the exchange part of the transport cycle, such as the translocation step from ToNa3GH to TiNa3GH (Watzke et al., 2001; Mwaura et al., 2012), have been suggested to be voltage dependent; and, in principle, any voltage dependent step in the exchange part of the transport cycle could contribute to the voltage dependence of exchange.
Figure 6.

A–F, The time each state in the transporter cycle is occupied by the transporter in uptake (A–C) and exchange (D–F) conditions per uptake and exchange, respectively, for different voltages under the same external glutamate (2 μm). Solutions. Intracellular: K-Glu = 180 mm K+ and 20 mm glutamate; Na-Glu = 180 mm Na+ and 20 mm glutamate. Extracellular: 180 mm Na+ and 2 μm glutamate.
The effect of intraliposomal potassium on the rate of net uptake at unsaturated substrate concentration is possibly due to the sodium leak
To address whether the higher concentration of substrate could cause the rapid depletion of internal potassium, we increased the intraliposomal potassium. Surprisingly, as shown in Figure 7A, the initial rate of net uptake depends upon the concentration of intraliposomal potassium. However, at such a concentration of external glutamate (2 μm < Km), the rate-limiting factor should not be the K+ step but the glutamate binding step, as suggested by our model (Fig. 4); however, other studies have suggested lower glutamate binding rate. To get a K+ dependence at this low external glutamate concentration, we propose that the transporter can make a transition from the outside facing to inside facing conformation when sodium is bound (by connecting states 3 and 8 in Fig. 7B by a transition), even without glutamate bound. This would create a Na+ leak path (cycling through states 0–3, 8–9, Fig. 7B) that competes with the glutamate uptake pathway (cycling through 0–13 states). This will lead to a decreased number of transporters ready to bind extracellular glutamate. By increasing internal K+, the return of the transporters to the outside will speed up and thereby more uptake will be possible. In our model, the K+ return step is not rate limiting for glutamate uptake at 2 μm (glutamate binding is rate limiting, which is has to be to get the right dose–response curve), but the K+ return step is rate limiting for the Na+ leak cycle and thus controls the EAAT2 distribution between the outward and inward conformations. The model can reproduce the effect of an increase in the uptake rate with increasing K+ concentration (with a Km = 132 ± 2 mm for internal K+) and at the same time get a Km for glutamate higher than the applied extracellular glutamate concentration (Fig. 7C). Without this Na+ leak, it is difficult to fulfill these two effects at the same time. There is additional evidence in the literature for this Na+ leak: (1) Hediger (Kanai et al., 1995) has shown that there is radioactive Na+ uptake by EAAT3 even without glutamate. (2) Bergles et al. (2002), studying EAAT2, and Wadiche and Kavanaugh (1998), studying EAAT1, showed that the size of the glutamate-activated currents depends on the intracellular cation. Both of these effects cannot be explained without this Na+ leak. In addition, in our experiments, EAAT2-containing liposomes first take up glutamate and then reverse transport glutamate, resulting in a bell-shaped time course of glutamate uptake (Fig. 7E). Both processes are EAAT2 dependent because they can be stopped by EAAT2 inhibitors (Fig. 7E). Simulations using our model with a sodium leak generated very similar bell-shaped uptake curves (Fig. 7F), whereas a transporter model without this sodium leak can only generate monotonic uptake curves.
Figure 7.

A, The effect of intraliposomal potassium on the rate of net uptake at 2 μm external glutamate (< Km) is possibly due to the Na leak. Proteoliposomes were loaded with various internal media 400 mm K+ (400 mm potassium ions, 250 mm HEPES, 100 mm citric acid, and 1% glycerol), 200 mm K+, 200 mm Li+ (200 mm potassium ions, 200 mm lithium ions, 250 mm HEPES, 100 mm citric acid, and 1% glycerol), 200 mm K+, 200 mm Na+ (200 mm potassium ions, 200 mm sodium ions, 250 mm HEPES, 100 mm citric acid, and 1% glycerol), 200 mm K+, 200 mm ethanolamine (200 mmpotassium ions, 200 mm ethanolamine, 250 mm HEPES, 100 mm citric acid, and 1% glycerol). They were then added into external medium containing 400 mm sodium ions, 250 mm HEPES, 100 mm citric acid, 1% glycerol, 2 μm Na-glutamate, 50 nm l-[3H]glutamate, and 3 μm valinomycin. The data represent average ± SEM of one experiment with triplicates. B, EAAT2 model with sodium leak step necessary to explain the internal K dependence. C, Dose–response curve of the model with increasing external glutamate. D, Dose–response of the model with increasing internal potassium. E, Bell-shaped time course due to uptake followed by reversed uptake. Liposomes are loaded with K+, and the uptake reaction is started by diluting the liposomes in external medium with Na+ and labeled l-glutamate. Glutamate accumulates inside the liposomes (solid squares) until the ion gradients are dissipated. Then glutamate leaks out presumably to reversal of the transporters giving rise to the bell-shaped time course. Addition of nigericin abolishes uptake when added at start (asterisks) and induces reversal when added later (solid triangles). Dihydrokainate inhibits uptake (open squares) but is also able to block reversal because it is a nontransportable substrate as illustrated by the addition of both nigericin and dihydrokainate (open triangles). Data from the same material as in Danbolt et al. (2004). F, Simulation of glutamate uptake using the EAAT2 model with a Na leak step (as in B). Starting conditions: Gluo = 2 μm, Nao = 100 mm, Ko = 0 mm, pHo = 7.4, Glui = 0, Nai = 0, Ki = 100 mm, pHi = 7, V = −80 mV. Outside solution is assumed to be infinite, so that the concentrations outside do not change. V is assumed to be constant due to valinomycin.
Discussion
Here we show, in contrast to what is commonly assumed (Erecińska and Nelson, 1987; Grewer and Rauen, 2005), that exchange of glutamate is not substantially faster than glutamate uptake by the glutamate transporter EAAT2. In addition, we show that electroneutral glutamate exchange is voltage dependent. Our experiments and simulations also suggest that there must be a sodium leak in the glutamate uptake cycle to explain the potassium dependence of glutamate uptake at low glutamate concentrations.
Here we used radiotracing to estimate the rate of uptake and exchange of glutamate by EAAT2. This measures the substrate accumulation directly rather than estimating exchange and uptake from the electrical consequences of substrate binding and translocation (Grewer and Rauen, 2005). Further, whereas traditional radiotracing studies are based on cell cultures or tissue homogenates (e.g., synaptosome preparations and membrane vesicles), here we used a reconstituted system (Danbolt et al., 1990). In this system, the membrane proteins are solubilized, diluted in excess phospholipids, and then reconstituted. This leads to a major simplification. Water-soluble molecules are removed, and addition of extra lipids to the detergent extracts dilutes the membrane proteins so that there are few protein molecules in each artificial membrane vesicle (liposome). Interference from other proteins (e.g., ion channels) is thereby largely avoided. Further, the reconstitution allows liposomes to be made with the desired internal or external media. The two main limitations of this assay are as follows: (1) poor temporal resolution as the uptake reaction is terminated by dilution and filtration; and (2) uptake is not fully linear with time because the liposomes do not have Na+K+ATPase activity to maintain the sodium and potassium gradients.
The present reconstitution assay is virtually selective for EAAT2 (Fig. 1), which is the only one of the five glutamate transporters that is essential for survival (Zhou and Danbolt, 2013, 2014). A major contribution from EAAT2 is expected because of the very high levels of EAAT2 in forebrain tissue (Lehre and Danbolt, 1998) and the much lower levels of EAAT3 (Holmseth et al., 2012) and EAAT4 (Dehnes et al., 1998). Thus, a dominant role of EAAT2 is expected.
Anion channel in mammalian glutamate transporters
An uncoupled anion flux accompanies the glutamate flux through glutamate transporters (Fairman et al., 1995; Picaud et al., 1995; Wadiche et al., 1995a, b; Larsson et al., 1996; Wadiche and Kavanaugh, 1998; Ryan et al., 2004), showing that glutamate transporters can function as both transporters and ion channels. However, the physiological role of these anion currents is not always clear. Among the mammalian glutamate transporters, EAAT2, which is the predominant glutamate transporter in the forebrain (Dehnes et al., 1998; Lehre and Danbolt, 1998; Holmseth et al., 2012), has the least steady-state anion conductance (Wadiche and Kavanaugh, 1998). Here we showed that the anion channel in EAAT2 could at least partly dissipate the building up of positive charge caused by glutamate uptake.
Our results further suggested that the activation of the anion-conducting state is associated with the binding of sodium ions and glutamate rather than the binding of potassium. This is similar to earlier suggestions from electrophysiological studies on EAAT2 mutant E404D, which has impaired capacity in potassium binding and/or translocation but still displays an anion conductance (Kavanaugh et al., 1997).
Exchange is electroneutral but is voltage dependent
Glutamate uptake by EAAT2 is strongly voltage dependent (Wadiche et al., 1995a, b). In the EAAT2 uptake cycle, several steps have been inferred to be voltage dependent: the first and third Na+ binding step to the external side, the unbinding step of the first Na+ after translocation, and the K+-dependent translocation (Wadiche et al., 1995b; Bergles et al., 2002). At saturating glutamate concentration, the voltage dependence of uptake is mainly due to the voltage dependence of the K+ return step, which is the rate-limiting step in the uptake cycle (Bergles et al., 2002; Larsson et al., 2004). Net uptake is electrogenic because three sodium ions and one proton cotransport with one glutamate followed by countertransport of one potassium ion. In contrast, exchange is an electroneutral process as it exchanges external and internal substrates at a 1:1 relationship (Kanner and Sharon, 1978; Danbolt and Storm-Mathisen, 1986; Zerangue and Kavanaugh, 1996; Kavanaugh et al., 1997). Here, using the anion channel in the transporter to control the voltage in the liposomes, a voltage dependence of the exchange mode was identified. The voltage dependence of the exchange is most likely caused by the voltage dependence of the binding of the third sodium. Electrophysiological experiments and computer simulations have suggested that the third sodium has a strong voltage dependence, z = 0.55 (Watzke et al., 2001; Bergles et al., 2002; Larsson et al., 2004). The third sodium has also been suggested to bind after glutamate has bound to the transporter (Kanai et al., 1995; Bergles et al., 2002; Larsson et al., 2004) and to stabilize the closed conformation of the external gate of glutamate transporters, thereby reducing the off rate of glutamate to the external solution. Therefore, the voltage dependence of the binding of the third sodium indirectly renders the glutamate binding step voltage dependent.
Rapid rate of heteroexchange does not explain the disproportionately strong uptake in terminals
We reported (Furness et al., 2008), based on electron microscopic detection of EAAT2 substrates, that EAAT2 in axon terminals accounts for >50% of the substrate accumulation in hippocampal slices despite representing <10% of total tissue EAAT2. The contribution of neuronal EAAT2 is even larger in synaptosome preparations (Furness et al., 2008). In the latter, differences between astrocytes and nerve terminals with respect to mechanical properties and ability to reseal after homogenization may be sufficient to explain a predominant contribution of neuronal EAAT2. But in slices this mechanical explanation is less plausible. Metabolism of the substrate can be ruled out because d-aspartate was used as a probe, which is slowly metabolized in brain tissue (Davies and Johnston, 1976; Takagaki, 1978).
One possibility that we have tested here is whether the disproportionate labeling of terminals can be due to a difference in the rates of heteroexchange and net uptake: Because glial cells in slices maintain a large negative resting potential (Bergles and Jahr, 1997) and low internal levels of glutamate, it is likely that they perform net uptake with high rate. In contrast, terminals have higher internal levels of glutamate (Ottersen et al., 1990; e.g., Bramham et al., 1990), and less is known about their metabolic state in slice preparations. If terminals were unable to maintain their transmembrane ion gradients, they are likely to switch to exchange mode. If, in addition, exchange were 10 times faster than net uptake as suggested (Erecińska and Nelson, 1987), then this would explain equal labeling of glia and terminals despite 10 times difference in EAAT2 levels. But here we show that this is not the case.
Another possibility is that the substrate leaks out from astrocytes via anion channels, such as unpaired connexons acting as functional hemichannels, pannexins, P2X receptors, or volume-regulated anion channels (for review, see Malarkey and Parpura, 2008). A third possibility is that EAAT2 in terminals and in astrocytes is regulated differently and that the former is more active. To resolve this conundrum and to distinguish between EAAT2 in astrocytes and neurons, it is necessary to generate conditional EAAT2 knock-out mice where EAAT2 can be deleted in neurons and astrocytes selectively. Such mice are now becoming available (Zhou et al., 2014).
Our experiments and computer simulations suggest that glutamate uptake and glutamate exchange have similar rates. At low glutamate concentrations (< Km), it is not surprising that exchange and uptake have similar rates because the glutamate-binding step is rate limiting for both mechanisms. At high glutamate concentration (> Km), the slow K+ return step is rate limiting for glutamate uptake. However, there is no such slow step in the exchange half cycle. So why is exchange then as slow as uptake at high glutamate concentrations? Our simulations show that, for high glutamate concentrations, the transporter in exchange mode populates with similar probability a number of states (Fig. 3B). The rates between these states are all very similar (∼1 ms−1) (Fig. 4A). So during exchange, the transporter undergoes a random walk similar to the “Drunkard's walk” (= equal probability to step forward as backward). In Figure 8, we show that a simplified model of glutamate exchange in which the transporter performs a “Drunkard's walk” significantly prolongs the time it takes to complete an exchange of a glutamate molecule because, for each transition, the transporter hops back and forth so much that it adds up to a substantial time on average. Therefore, our model suggests that glutamate exchange is slow because of the large number of relatively fast steps (random forward and backward steps), whereas uptake is similarly slow because of one slow rate-limiting K+-relocation step.
Figure 8.

A, Simplified linear scheme for exchange at high glutamate concentrations (assuming infinite on-rate of glutamate both inside and outside). We start with radioactive glutamate (G*) bound to the outward-facing conformation (To). G* could unbind and bind again (circular arrow) or the third sodium could bind. Next, the third sodium could unbind or the transporter could change from outward-facing to inward-facing (Ti) conformation, etc. Once G* has unbound from the Ti conformation, we assume that only cold glutamate (G) can rebind to the Ti conformation (only right arrow). To calculate the average number of transitions in this scheme for one glutamate exchange, we define the G unbinding in the To conformation to go to an absorbing state. For simplicity, we assume that all rates are equal (both forward and backward rates), which is similar to our case of exchange at high glutamate concentration. To give an intuitive feel for how exchange would take place in such a model, we made a simplified calculation of how this model behaves at different time points if we assume that the transporter undergoes a transition for every time point. B, Matrix Q, which is the probability matrix of moving from one state to another state between each time point for model in A. Qij is the probability of moving from State si to State sj. The initial condition (for t = 0) that the transporter starts in the most leftward state can be described by the vector S(0) = (1,0,0,0,0,0,0,0,0). One can then calculate the probability of being in any State si at time point t by the state vector S(t) as S(1) = S(0) Q, and S(2) = S(1) Q = S(0) Q2, etc. The probability of being in any state for all times can then be calculated from the matrix N = 1 + Q + Q2 + etc., where nij is the expected times State sj is occupied when starting in State si. It can be shown that N = (I − Q)−1 (Grinstead and Snell, 1997). C, Matrix N for the model in A. The matrix N basically shows that, if the transporter starts in State s1, then s1 will be visited 8 times, State s2 will be visited 6 times, State s3 will be visited 4 times, etc., before the transporter has reached the final absorbed state. The expected number of steps before entering the absorbing state when starting in State si is then given by the sum of all the numbers in row i of matrix N. For our case, the number of expected steps before ending up in the absorbing state when starting in the leftmost state (ToNa2G × H) is = 36. This number is 4.5 times larger than the minimum number of steps (8) to go from left to right in the Markov chain to execute an exchange of one glutamate molecule. Therefore, the time to execute an exchange is much longer than one would have expected by just looking at the individual rates in the exchange model, which are all close to 1 ms−1. In this simplified model, we have assumed that all rates are equal. To get an approximate time for one exchange, we assume that each rate is 1 ms−1 (which is similar to the rates in our exchange model). The mean time for every step is then 0.5 ms: 1/(forward rate + backward rate). Therefore, this simplified model predicts that one exchange should take on average 36 × 0.5 ms = 18 ms and that there would be 55 exchanges per second, which is similar to our estimate from our exchange model (42/s; Fig. 3F).
Footnotes
This work was supported by the Norwegian Research Council (Centre of Excellence CMBN, and Grants 164297-V40 and 183727-S10), the Norwegian Advanced Research Program (Toppforskningsprogrammet), American Heart Association predoctoral fellowship 11PRE7990050 to X.W., National Institutes of Health Grant R01-HL095920 to H.P.L., and National Institutes of Health/National Institute of Neurological Disorders and Stroke Grant NS073981 to A.V.T. We thank Kohichi Tanaka for making the GLT1 knock-out mice available.
The authors declare no competing financial interests.
References
- Arriza JL, Fairman WA, Wadiche JI, Murdoch GH, Kavanaugh MP, Amara SG. Functional comparisons of three glutamate transporter subtypes cloned from human motor cortex. J Neurosci. 1994;14:5559–5569. doi: 10.1523/JNEUROSCI.14-09-05559.1994. [DOI] [PMC free article] [PubMed] [Google Scholar]
- Beart PM. The autoradiographic localization of l- [3H] glutamate in synaptosomal preparations. Brain Res. 1976;103:350–355. doi: 10.1016/0006-8993(76)90804-0. [DOI] [PubMed] [Google Scholar]
- Beart PM, O'Shea RD. Transporters for l-glutamate: an update on their molecular pharmacology and pathological involvement. Br J Pharmacol. 2007;150:5–17. doi: 10.1038/sj.bjp.0706949. [DOI] [PMC free article] [PubMed] [Google Scholar]
- Bergles DE, Jahr CE. Synaptic activation of glutamate transporters in hippocampal astrocytes. Neuron. 1997;19:1297–1308. doi: 10.1016/S0896-6273(00)80420-1. [DOI] [PubMed] [Google Scholar]
- Bergles DE, Tzingounis AV, Jahr CE. Comparison of coupled and uncoupled currents during glutamate uptake by GLT-1 transporters. J Neurosci. 2002;22:10153–10162. doi: 10.1523/JNEUROSCI.22-23-10153.2002. [DOI] [PMC free article] [PubMed] [Google Scholar]
- Bramham CR, Torp R, Zhang N, Storm-Mathisen J, Ottersen OP. Distribution of glutamate-like immunoreactivity in excitatory hippocampal pathways: a semiquantitative electron microscopic study in rats. Neuroscience. 1990;39:405–417. doi: 10.1016/0306-4522(90)90277-B. [DOI] [PubMed] [Google Scholar]
- Bridges RJ, Kavanaugh MP, Chamberlin AR. A pharmacological review of competitive inhibitors and substrates of high-affinity, sodium-dependent glutamate transport in the central nervous system. Curr Pharm Des. 1999;5:363–379. [PubMed] [Google Scholar]
- Bussolati O, Laris PC, Rotoli BM, Dall'Asta V, Gazzola GC. Transport system ASC for neutral amino acids: an electroneutral sodium/amino acid cotransport sensitive to the membrane potential. J Biol Chem. 1992;267:8330–8335. [PubMed] [Google Scholar]
- Danbolt NC. Glutamate uptake. Prog Neurobiol. 2001;65:1–105. doi: 10.1016/S0301-0082(00)00067-8. [DOI] [PubMed] [Google Scholar]
- Danbolt NC, Storm-Mathisen J. Na+-dependent “binding” of d-aspartate in brain membranes is largely due to uptake into membrane-bounded saccules. J Neurochem. 1986;47:819–824. doi: 10.1111/j.1471-4159.1986.tb00684.x. [DOI] [PubMed] [Google Scholar]
- Danbolt NC, Pines G, Kanner BI. Purification and reconstitution of the sodium- and potassium-coupled glutamate transport glycoprotein from rat brain. Biochemistry. 1990;29:6734–6740. doi: 10.1021/bi00480a025. [DOI] [PubMed] [Google Scholar]
- Danbolt NC, Storm-Mathisen J, Kanner BI. An [Na++ K+]coupled l-glutamate transporter purified from rat brain is located in glial cell processes. Neuroscience. 1992;51:295–310. doi: 10.1016/0306-4522(92)90316-T. [DOI] [PubMed] [Google Scholar]
- Danbolt NC, Holmseth S, Skår A, Lehre KP, Furness DN. Glutamate uptake and transporters. In: Ferrarese C, Beal MF, editors. Excitotoxicity in neurological disease: new therapeutic challenge. Boston: Kluwer Academics; 2004. pp. 27–49. [Google Scholar]
- Davies LP, Johnston GA. Uptake and release of d- and l-aspartate by rat brain slices. J Neurochem. 1976;26:1007–1014. doi: 10.1111/j.1471-4159.1976.tb06485.x. [DOI] [PubMed] [Google Scholar]
- Dehnes Y, Chaudhry FA, Ullensvang K, Lehre KP, Storm-Mathisen J, Danbolt NC. The glutamate transporter EAAT4 in rat cerebellar Purkinje cells: a glutamate-gated chloride channel concentrated near the synapse in parts of the dendritic membrane facing astroglia. J Neurosci. 1998;18:3606–3619. doi: 10.1523/JNEUROSCI.18-10-03606.1998. [DOI] [PMC free article] [PubMed] [Google Scholar]
- Diamond JS. Deriving the glutamate clearance time course from transporter currents in CA1 hippocampal astrocytes: transmitter uptake gets faster during development. J Neurosci. 2005;25:2906–2916. doi: 10.1523/JNEUROSCI.5125-04.2005. [DOI] [PMC free article] [PubMed] [Google Scholar]
- Erecińska M, Nelson D. Amino acid neurotransmitters in the CNS: relationships between net uptake and exchange in rat brain synaptosomes. FEBS Lett. 1987;213:61–66. doi: 10.1016/0014-5793(87)81465-5. [DOI] [PubMed] [Google Scholar]
- Fairman WA, Vandenberg RJ, Arriza JL, Kavanaugh MP, Amara SG. An excitatory amino-acid transporter with properties of a ligand-gated chloride channel. Nature. 1995;375:599–603. doi: 10.1038/375599a0. [DOI] [PubMed] [Google Scholar]
- Folch J, Lees M, Sloane Stanley GH. A simple method for the isolation and purification of total lipids from animal tissues. J Biol Chem. 1957;226:497–509. [PubMed] [Google Scholar]
- Furness DN, Dehnes Y, Akhtar AQ, Rossi DJ, Hamann M, Grutle NJ, Gundersen V, Holmseth S, Lehre KP, Ullensvang K, Wojewodzic M, Zhou Y, Attwell D, Danbolt NC. A quantitative assessment of glutamate uptake into hippocampal synaptic terminals and astrocytes: new insights into a neuronal role for excitatory amino acid transporter 2 (EAAT2) Neuroscience. 2008;157:80–94. doi: 10.1016/j.neuroscience.2008.08.043. [DOI] [PMC free article] [PubMed] [Google Scholar]
- Furuta A, Rothstein JD, Martin LJ. Glutamate transporter protein subtypes are expressed differentially during rat CNS development. J Neurosci. 1997;17:8363–8375. doi: 10.1523/JNEUROSCI.17-21-08363.1997. [DOI] [PMC free article] [PubMed] [Google Scholar]
- Gouaux E. The molecular logic of sodium-coupled neurotransmitter transporters. Philos Trans R Soc Lond B Biol Sci. 2009;364:149–154. doi: 10.1098/rstb.2008.0181. [DOI] [PMC free article] [PubMed] [Google Scholar]
- Grewer C, Rauen T. Electrogenic glutamate transporters in the CNS: molecular mechanism, pre-steady-state kinetics, and their impact on synaptic signaling. J Membr Biol. 2005;203:1–20. doi: 10.1007/s00232-004-0731-6. [DOI] [PMC free article] [PubMed] [Google Scholar]
- Grinstead CM, Snell JL. Markov chains. In: Grinstead CM, Snell JL, editors. Introduction to probability. Providence, RI: American Mathematical Society; 1997. pp. 405–470. [Google Scholar]
- Gundersen V, Danbolt NC, Ottersen OP, Storm-Mathisen J. Demonstration of glutamate/aspartate uptake activity in nerve endings by use of antibodies recognizing exogenous d-aspartate. Neuroscience. 1993;57:97–111. doi: 10.1016/0306-4522(93)90114-U. [DOI] [PubMed] [Google Scholar]
- Haugeto O, Ullensvang K, Levy LM, Chaudhry FA, Honoré T, Nielsen M, Lehre KP, Danbolt NC. Brain glutamate transporter proteins form homomultimers. J Biol Chem. 1996;271:27715–27722. doi: 10.1074/jbc.271.44.27715. [DOI] [PubMed] [Google Scholar]
- Holmseth S, Dehnes Y, Huang YH, Follin-Arbelet VV, Grutle NJ, Mylonakou MN, Plachez C, Zhou Y, Furness DN, Bergles DE, Lehre KP, Danbolt NC. The density of EAAC1 (EAAT3) glutamate transporters expressed by neurons in the mammalian CNS. J Neurosci. 2012;32:6000–6013. doi: 10.1523/JNEUROSCI.5347-11.2012. [DOI] [PMC free article] [PubMed] [Google Scholar]
- Kanai Y, Nussberger S, Romero MF, Boron WF, Hebert SC, Hediger MA. Electrogenic properties of the epithelial and neuronal high affinity glutamate transporter. J Biol Chem. 1995;270:16561–16568. doi: 10.1074/jbc.270.28.16561. [DOI] [PubMed] [Google Scholar]
- Kanner BI. Bioenergetics of neurotransmitter transport. Biochim Biophys Acta. 1983;726:293–316. doi: 10.1016/0304-4173(83)90013-7. [DOI] [PubMed] [Google Scholar]
- Kanner BI, Schuldiner S. Mechanism of transport and storage of neurotransmitters. CRC Crit Rev Biochem. 1987;22:1–38. doi: 10.3109/10409238709082546. [DOI] [PubMed] [Google Scholar]
- Kanner BI, Sharon I. Active transport of l-glutamate by membrane vesicles isolated from rat brain. Biochemistry. 1978;17:3949–3953. doi: 10.1021/bi00612a011. [DOI] [PubMed] [Google Scholar]
- Kavanaugh MP, Bendahan A, Zerangue N, Zhang Y, Kanner BI. Mutation of an amino acid residue influencing potassium coupling in the glutamate transporter GLT-1 induces obligate exchange. J Biol Chem. 1997;272:1703–1708. doi: 10.1074/jbc.272.3.1703. [DOI] [PubMed] [Google Scholar]
- Larsson HP, Picaud SA, Werblin FS, Lecar H. Noise analysis of the glutamate-activated current in photoreceptors. Biophys J. 1996;70:733–742. doi: 10.1016/S0006-3495(96)79613-3. [DOI] [PMC free article] [PubMed] [Google Scholar]
- Larsson HP, Tzingounis AV, Koch HP, Kavanaugh MP. Fluorometric measurements of conformational changes in glutamate transporters. Proc Natl Acad Sci U S A. 2004;101:3951–3956. doi: 10.1073/pnas.0306737101. [DOI] [PMC free article] [PubMed] [Google Scholar]
- Lehre AC, Rowley NM, Zhou Y, Holmseth S, Guo C, Holen T, Hua R, Laake P, Olofsson AM, Poblete-Naredo I, Rusakov DA, Madsen KK, Clausen RP, Schousboe A, White HS, Danbolt NC. Deletion of the betaine-GABA transporter (BGT1; slc6a12) gene does not affect seizure thresholds of adult mice. Epilepsy Res. 2011;95:70–81. doi: 10.1016/j.eplepsyres.2011.02.014. [DOI] [PMC free article] [PubMed] [Google Scholar]
- Lehre KP, Danbolt NC. The number of glutamate transporter subtype molecules at glutamatergic synapses: chemical and stereological quantification in young adult rat brain. J Neurosci. 1998;18:8751–8757. doi: 10.1523/JNEUROSCI.18-21-08751.1998. [DOI] [PMC free article] [PubMed] [Google Scholar]
- Lehre KP, Levy LM, Ottersen OP, Storm-Mathisen J, Danbolt NC. Differential expression of two glial glutamate transporters in the rat brain: quantitative and immunocytochemical observations. J Neurosci. 1995;15:1835–1853. doi: 10.1523/JNEUROSCI.15-03-01835.1995. [DOI] [PMC free article] [PubMed] [Google Scholar]
- Li Y, Zhou Y, Danbolt NC. The rates of postmortem proteolysis of glutamate transporters differ dramatically between cells and between transporter subtypes. J Histochem Cytochem. 2012;60:811–821. doi: 10.1369/0022155412458589. [DOI] [PMC free article] [PubMed] [Google Scholar]
- Malarkey EB, Parpura V. Mechanisms of glutamate release from astrocytes. Neurochem Int. 2008;52:142–154. doi: 10.1016/j.neuint.2007.06.005. [DOI] [PMC free article] [PubMed] [Google Scholar]
- Mwaura J, Tao Z, James H, Albers T, Schwartz A, Grewer C. Protonation state of a conserved acidic amino acid involved in Na(+) binding to the glutamate transporter EAAC1. ACS Chem Neurosci. 2012;3:1073–1083. doi: 10.1021/cn300163p. [DOI] [PMC free article] [PubMed] [Google Scholar]
- Otis TS, Kavanaugh MP. Isolation of current components and partial reaction cycles in the glial glutamate transporter EAAT2. J Neurosci. 2000;20:2749–2757. doi: 10.1523/JNEUROSCI.20-08-02749.2000. [DOI] [PMC free article] [PubMed] [Google Scholar]
- Ottersen OP, Storm-Mathisen J, Bramham C, Torp R, Laake J, Gundersen V. A quantitative electron microscopic immunocytochemical study of the distribution and synaptic handling of glutamate in rat hippocampus. Prog Brain Res. 1990;83:99–114. doi: 10.1016/S0079-6123(08)61244-3. [DOI] [PubMed] [Google Scholar]
- Picaud SA, Larsson HP, Grant GB, Lecar H, Werblin FS. Glutamate-gated chloride channel with glutamate-transporter-like properties in cone photoreceptors of the tiger salamander. J Neurophysiol. 1995;74:1760–1771. doi: 10.1152/jn.1995.74.4.1760. [DOI] [PubMed] [Google Scholar]
- Pines G, Kanner BI. Counterflow of l-glutamate in plasma membrane vesicles and reconstituted preparations from rat brain. Biochemistry. 1990;29:11209–11214. doi: 10.1021/bi00503a008. [DOI] [PubMed] [Google Scholar]
- Pressman BC, Fahim M. Pharmacology and toxicology of the monovalent carboxylic ionophores. Annu Rev Pharmacol Toxicol. 1982;22:465–490. doi: 10.1146/annurev.pa.22.040182.002341. [DOI] [PubMed] [Google Scholar]
- Rossi DJ, Oshima T, Attwell D. Glutamate release in severe brain ischaemia is mainly by reversed uptake. Nature. 2000;403:316–321. doi: 10.1038/35002090. [DOI] [PubMed] [Google Scholar]
- Ryan RM, Mindell JA. The uncoupled chloride conductance of a bacterial glutamate transporter homolog. Nat Struct Mol Biol. 2007;14:365–371. doi: 10.1038/nsmb1230. [DOI] [PubMed] [Google Scholar]
- Ryan RM, Mitrovic AD, Vandenberg RJ. The chloride permeation pathway of a glutamate transporter and its proximity to the glutamate translocation pathway. J Biol Chem. 2004;279:20742–20751. doi: 10.1074/jbc.M304433200. [DOI] [PubMed] [Google Scholar]
- Ryan RM, Compton EL, Mindell JA. Functional characterization of a Na+-dependent aspartate transporter from Pyrococcus horikoshii. J Biol Chem. 2009;284:17540–17548. doi: 10.1074/jbc.M109.005926. [DOI] [PMC free article] [PubMed] [Google Scholar]
- Shimamoto K. Glutamate transporter blockers for elucidation of the function of excitatory neurotransmission systems. Chem Rec. 2008;8:182–199. doi: 10.1002/tcr.20145. [DOI] [PubMed] [Google Scholar]
- Shimamoto K, Shigeri Y. Elucidation of glutamate transporter functions using selective inhibitors. Cent Nerv Syst Agents Med Chem. 2006;6:59–71. doi: 10.2174/187152406776056528. [DOI] [Google Scholar]
- Shimamoto K, Lebrun B, Yasuda Kamatani Y, Sakaitani M, Shigeri Y, Yumoto N, Nakajima T. dl-threo-beta-benzyloxyaspartate, a potent blocker of excitatory amino acid transporters. Mol Pharmacol. 1998;53:195–201. doi: 10.1124/mol.53.2.195. [DOI] [PubMed] [Google Scholar]
- Takagaki G. Sodium and potassium ions and accumulation of labelled d-aspartate and GABA in crude synaptosomal fraction from rat cerebral cortex. J Neurochem. 1978;30:47–56. doi: 10.1111/j.1471-4159.1978.tb07033.x. [DOI] [PubMed] [Google Scholar]
- Tanaka K, Watase K, Manabe T, Yamada K, Watanabe M, Takahashi K, Iwama H, Nishikawa T, Ichihara N, Kikuchi T, Okuyama S, Kawashima N, Hori S, Takimoto M, Wada K. Epilepsy and exacerbation of brain injury in mice lacking the glutamate transporter GLT- 1. Science. 1997;276:1699–1702. doi: 10.1126/science.276.5319.1699. [DOI] [PubMed] [Google Scholar]
- Trotti D, Volterra A, Lehre KP, Rossi D, Gjesdal O, Racagni G, Danbolt NC. Arachidonic acid inhibits a purified and reconstituted glutamate transporter directly from the water phase and not via the phospholipid membrane. J Biol Chem. 1995;270:9890–9895. doi: 10.1074/jbc.270.17.9890. [DOI] [PubMed] [Google Scholar]
- Tzingounis AV, Wadiche JI. Glutamate transporters: confining runaway excitation by shaping synaptic transmission. Nat Rev Neurosci. 2007;8:935–947. doi: 10.1038/nrn2274. [DOI] [PubMed] [Google Scholar]
- Ullensvang K, Lehre KP, Storm-Mathisen J, Danbolt NC. Differential developmental expression of the two rat brain glutamate transporter proteins GLAST and GLT. Eur J Neurosci. 1997;9:1646–1655. doi: 10.1111/j.1460-9568.1997.tb01522.x. [DOI] [PubMed] [Google Scholar]
- Vandenberg RJ, Ryan RM. Mechanisms of glutamate transport. Physiol Rev. 2013;93:1621–1657. doi: 10.1152/physrev.00007.2013. [DOI] [PubMed] [Google Scholar]
- Volterra A, Bezzi P, Rizzini BL, Trotti D, Ullensvang K, Danbolt NC, Racagni G. The competitive transport inhibitor l-trans-pyrrolidine-2,4-dicarboxylate triggers excitotoxicity in rat cortical neuron-astrocyte co-cultures via glutamate release rather than uptake inhibition. Eur J Neurosci. 1996;8:2019–2028. doi: 10.1111/j.1460-9568.1996.tb01345.x. [DOI] [PubMed] [Google Scholar]
- Wadiche JI, Kavanaugh MP. Macroscopic and microscopic properties of a cloned glutamate transporter chloride channel. J Neurosci. 1998;18:7650–7661. doi: 10.1523/JNEUROSCI.18-19-07650.1998. [DOI] [PMC free article] [PubMed] [Google Scholar]
- Wadiche JI, Amara SG, Kavanaugh MP. Ion fluxes associated with excitatory amino acid transport. Neuron. 1995a;15:721–728. doi: 10.1016/0896-6273(95)90159-0. [DOI] [PubMed] [Google Scholar]
- Wadiche JI, Arriza JL, Amara SG, Kavanaugh MP. Kinetics of a human glutamate transporter. Neuron. 1995b;14:1019–1027. doi: 10.1016/0896-6273(95)90340-2. [DOI] [PubMed] [Google Scholar]
- Watzke N, Bamberg E, Grewer C. Early intermediates in the transport cycle of the neuronal excitatory amino acid carrier EAAC1. J Gen Physiol. 2001;117:547–562. doi: 10.1085/jgp.117.6.547. [DOI] [PMC free article] [PubMed] [Google Scholar]
- Zander CB, Albers T, Grewer C. Voltage-dependent processes in the electroneutral amino acid exchanger ASCT2. J Gen Physiol. 2013;141:659–672. doi: 10.1085/jgp.201210948. [DOI] [PMC free article] [PubMed] [Google Scholar]
- Zerangue N, Kavanaugh MP. Flux coupling in a neuronal glutamate transporter. Nature. 1996;383:634–637. doi: 10.1038/383634a0. [DOI] [PubMed] [Google Scholar]
- Zhou Y, Danbolt NC. GABA and glutamate transporters in brain. Front Endocrinol (Lausanne) 2013;4:165. doi: 10.3389/fendo.2013.00165. [DOI] [PMC free article] [PubMed] [Google Scholar]
- Zhou Y, Danbolt NC. Glutamate as a neurotransmitter in the healthy brain. J Neural Transm. 2014;121:799–817. doi: 10.1007/s00702-014-1180-8. [DOI] [PMC free article] [PubMed] [Google Scholar]
- Zhou Y, Waanders LF, Holmseth S, Guo C, Berger UV, Li Y, Lehre AC, Lehre KP, Danbolt NC. Proteome analysis and conditional deletion of the EAAT2 glutamate transporter provide evidence against a role of EAAT2 in pancreatic insulin secretion in mice. J Biol Chem. 2014;289:1329–1344. doi: 10.1074/jbc.M113.529065. [DOI] [PMC free article] [PubMed] [Google Scholar]