Abstract
Background
Response Evaluation Criteria in Solid Tumors (RECIST) defined measurements are limited when evaluating soft tissue sarcoma (STS) response to therapy. Histopathologic assessment of STS response requires a determination of necrosis following resection. A novel semiautomated technique for volumetric measurement of tumor necrosis, using enhanced magnetic resonance imaging (CE-MRI), is described.
Patients and Methods
Eighteen patients with STS were treated with neoadjuvant therapy and then resected. CE-MRI, obtained prior to resection, were evaluated by two observers using semi-automated segmentation. Tumor volume and percent necrosis was compared with histology and RECIST measurements.
Results
The median percent necrosis, determined histologically and from CE-MRI, was 71.9% and 67.8%, respectively. Accuracy of these semiautomated measurements was confirmed, being statistically similar to those obtained at histopathologic assessment of the resected tumor. High Intra-class correlation coefficients suggest good inter-observer reproducibility. Tumor necrosis did not correlate with RECIST measurements.
Conclusion
Semi-automated determination of tumor volume and necrosis, using CE-MRI, is suggested to be accurate and reproducible.
Keywords: Sarcoma, necrosis, magnetic resonance imaging, segmentation
Soft Tissue Sarcoma (STS) comprise a diverse group of tumors of mesenchymal differentiation which together account for approximately 10,000 cases per year in the United States (1). Patients with some STS receive external-beam radiotherapy (RT) and/or chemotherapy prior to surgical resection with curative intent (2). At present, the response of the tumor to chemotherapy/radiation is not reliably identified until histologic assessment of the resected tumor. Imaging based, non-invasive, detection of meaningful tumor response to therapies has proven elusive (3, 4). Standard measurements of the single longest diameter of the tumors, defined by The Response Evaluation Criteria in Solid Tumors (RECIST), have been shown to correlate poorly with oncologic outcome in many tumor types (5, 6, 7). This is well described in gastrointestinal stromal tumors (GISTs), being treated with imatinib (8). New criteria have been recently proposed for GISTs incorporating tumor attenuation in addition to tumor size (9, 10, 11). These criteria have been suggested to correlate with patient outcomes better than linear measurements of the whole tumor as defined by RECIST criteria. With regard to STS, it has been long appreciated that there may be a dramatic histologic response without any decrease in size, as measured in accordance with RECIST criteria (12, 13, 14).
It has been suggested in a number of tumors that volumetric determination of tumor necrosis, on imaging studies, may better predict survival (15, 16, 17). A quantitative noninvasive, estimate of STS tumor necrosis during various stages of chemotherapy or radiotherapy may yield prognostic information that is useful for subsequent patient treatment. Enhanced cross sectional imaging, such as CE-MRI, allows gross evaluation of the entire heterogeneous tumor volume, while histopatholgic determination of necrosis for STS may be based on selected sections of the tumor chosen by the pathologist and may not accurately represent the entire tumor volume.
In the current study semi-automated methods for volumetric segmentation of viable, enhancing, and necrotic, non-enhancing, portions of tumor are applied to CE-MRI of STS. The goal of this pilot study is to assess the accuracy and inter-observer reproducibility of this technique.
Patients and Methods
Approval for this study was obtained from the Institutional Review Board. The study was conducted in compliance with Health Insurance Portability and Accountability Act (HIPAA) guidelines. Clinical, histopathologic, imaging and treatment data were retrospectively reviewed. Between March 2008 and February 2011, a total of 18 patients with locally advanced, non-metastatic STS of the extremity of varying histology (Table I), were treated with neoadjuvant therapy then resected. These patients were prospectively entered and tracked in a computerized cancer center database. A diagnosis of soft tissue sarcoma was established by image-guided core biopsy. Patients with intermediate or high grade tumors greater than 5 cm, patients with low grade tumors > 8 cm, or patients with tumors abutting key neurovascular structures were treated with neoadjuvant radiation therapy (RT) monotherapy. RT was administered in 2 Gy fractions over 25 sessions for a total dose of 50 Gy. Surgical resection was performed approximately 4 to 6 weeks following the completion of RT to allow acute effects of radiation such as dermatitis to resolve. Seven patients were treated with the multi-kinase inhibitor sorafenib in combination with neoadjuvant RT, on a phase I trial. All patients underwent limb-sparing resection with curative intent, and pathologic margins were negative for tumor. CE-MRI images, obtained prior to and following treatment, within three weeks of resection, were evaluated with semi-automated segmentation techniques to determine whole tumor volume and percentage of, non-enhancing, tumor necrosis. These measurements were compared to the percentage of histologically determined necrosis of the surgically resected tumor, as well as the longest tumor diameter, determined in accordance with RECIST criteria (18) (http://ctep.cancer.gov/protocolDevelopment/docs/recist_guideline.pdf). The Electronic Medical Record (EMR) and imaging studies stored on a Philips iSite Picture Archiving and Communication System (PACS, Philips Healthcare, Andover, MA) were used to retrospectively determine time to distant recurrence and disease free survival rates.
Table I.
Characterization of soft tissue sarcoma.
| Pleomorphic undifferentiated sarcoma | 6 |
| Myxoid fibrosarcoma | 2 |
| Myxoid liposarcoma | 3 |
| Myxoid/round cell liposarcoma | 2 |
| Clear cell sarcoma | 1 |
| Myxoid chondrosarcoma | 1 |
| Extraskelatal osteosarcoma | 1 |
| Embroynal rhabdomysarcoma | 1 |
| Pleomorphic liposarcoma | 1 |
CE-MRI
MRI was obtained at the time of diagnosis and as close to surgical resection as possible. Ideally repeat imaging was performed 2 to 3 weeks before surgery to allow resolution of post-radiation changes and to help distinguish therapeutic effects, which may evolve over time, from side-effects such as tumoral edema to resolve. However, in some cases this was not possible due to patient availability and MRI scheduling. The mean time interval between the MRI and surgery was 13.6 (SD: 11.3) days with a range of one to forty six days. Four patients had an interval of greater than three weeks, 22 to 46 days, and so were not included in determinations of accuracy, comparing imaging to histology.
All MR imaging examinations were performed with a 1.5-T MR system (Signa Horizon EchoSpeed HDxt, LX Version 15 operating system software; GE Healthcare, Inc., Milwaukee, Wis). For each patient, a standardized imaging protocol was performed on the same scanner. This included fat saturated T1-weighted MR imaging (repetition time msec/echo time msec of 400/17) and fat-saturated T2-weighted MR imaging (4,000/85) in the transverse, sagittal and coronal planes. The coronal plane was usually used for the dynamic enhanced portion of the study to view the feeding vessel all in one section. Initially, gadopentetate dimeglumine (Magnevist; Berlex Laboratories, Wayne, NJ) was administered via a peripheral arm vein, at a concentration of 0.1 mmol per kilogram of body weight, resulting in a standard dose of 1 mL of gadopentetate dimeglumine per 10 kg of patient weight. A 20-mL saline flush was administered at the same flow rate immediately after the gadopentetate dimeglumine. A power injector delivery system (Medrad, Indianola, Pa) was used to provide fixed flow rates of 2 mL/sec. The phase of imaging showing greatest conspicuity of enhanced and necrotic, non-enhancing tumor, were chosen for analysis. MRI images were stored on a Philips iSite Picture Archiving and Communication System (PACS, Philips Healthcare, Andover, MA) and were then de-identified in accordance with HIPPA requirements.. The observers were blinded to patient demographics.
Semi-automated determination of whole tumor volume and the volume of necrotic tumor
The two observers (B.J. and C.M.) first received training regarding the appearance of enhancing and non-enhancing sarcoma and the use of the software for semi-automated calculations of tumor volumes and the volume of non-enhancing, necrotic, tumor tissue. The training session was conducted by an attending radiologist (W.L.M.) with 10 years experience and included analysis of 10 CE-MRIs of STS following treatment and just prior to resection. The 10 MRI scans used for this training were not included for the study. To avoid bias during measurements there was no consensus reading and observers were blinded to histopathologic data and to each others measurements.
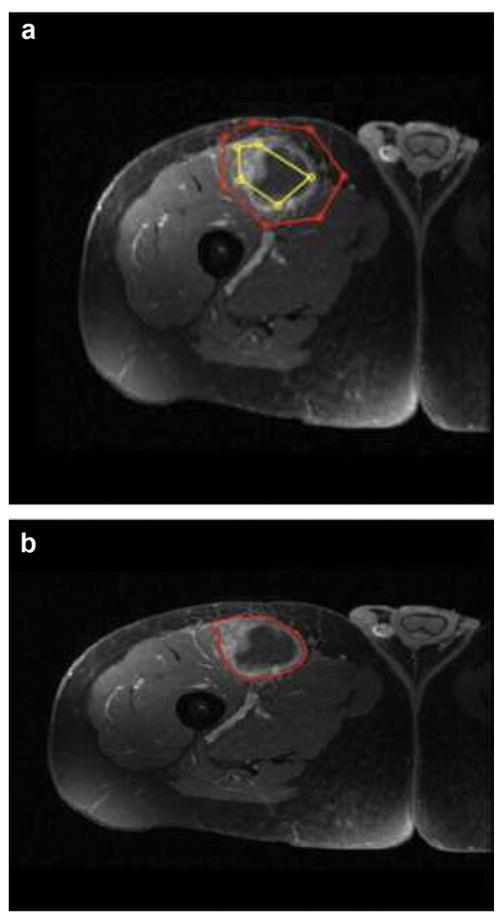
Our semi-automated segmentation software was developed on a Windows XP (Microsoft Corporation, Redmond, WA) workstation using the MATLAB programming language (version R2007a; The MathWorks, Natick, MA). The program was run on an HP Pavilion dv1000 Laptop with a 1.5-GHz processor, 2 GB RAM, and an 80-GB hard drive (Hewlett Packard, Palo Alto, CA). A graphical user interface was implemented. The semi-automated segmentation software developed for volumetric analysis used algorithms based on Iterative Watershed (IWS) (19) and Pixel Thresholding (PT) (20). The IWS algorithm implemented, first used gradient vector flow transformation of the image for edge enhancement, which was followed by a region-growing method, analogous to “flooding” the gradient vector flow map. Sarcoma tumor edges were finally determined, on each slice, from resultant ridgelines formed (Figure 1), as previously described and validated by Ray et al. (19), and then further applied to hepatic tumors undergoing radioembolization and chemoembolization (15, 16).
Figure 1.
58 year old man with right thigh myxoid fibrosarcoma. IWS based semi-automated determination of tumor edges. (a) Segmentation was performed by placing a series of markers that defined the outside of the tumor as well as series of markers that defined a representative sample of the tumor parenchyma. The software automatically connected each marker with a straight line, creating a polygonal shape. (b) Sarcoma tumor edges were determined, on each slice using automated segmentation algorithm incorporating gradient flow vector and iterative watershed (22).
Briefly summarized; segmentation was performed by placing a series of markers that defined the outside of the tumor as well as series of markers that defined a representative sample of the tumor parenchyma. The software automatically connected each marker with a straight line, creating a polygonal shape (Figure 1 a). On each axial image, the operators had the option of checking their work by way of an output image or to continue to the next set of images. The operators had the ability to delete, add, or move any marker at any time. When all image markers were set for all individual slices, the tumor edges were automatically outlined (Figure 1 b), as described by Ray et al. (19). The program added the individual slice areas and total volume were recorded accounting for the voxel dimensions.
The IWS algorithm calculated the whole-tumor volume (enhancing and nonenhancing). This was followed by application of the Pixel Thresholding (PT) algorithm, in which a region of normal parenchyma and the enhancing portion or necrotic nonenhancing portion of the tumor were included in separate regions of interest. The histogram of pixel attenuation values was evaluated (Figure 2 a). an automatic technique of analysing histograms similar to Otsu’s method is initially applied and the observer could then select a pixel attenuation value as the cut-off were all pixel values >x are counted as enhancing viable tumor which resulted in the image most clearly distinguishing enhancing viable tumor from non-enhancing necrosis based on the resultant outline and the histogram (Figure 2b).
Figure 2.
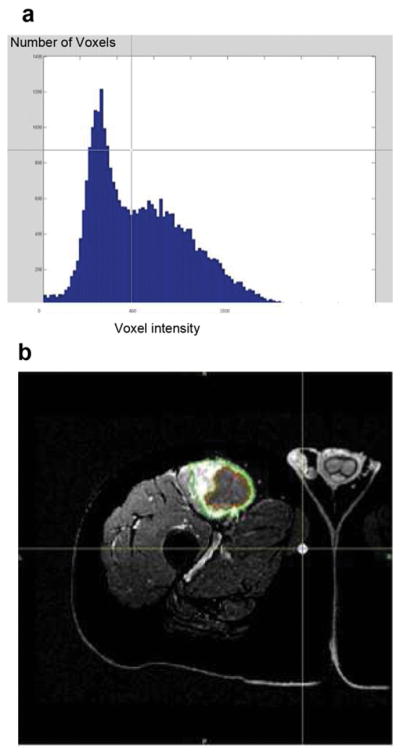
58 year old man with right thigh myxoid fibrosarcoma. Pixel thresholding based determination of tumor necrosis volume. (a) The histogram of number of Voxels (Y axis) Voxel having listed attenuation values (X axis) tumor initially outlined using IWS as described. (b) An automated outline most clearly distinguishing enhancing, viable tumor (green outline), from non-enhancing, necrotic tumor (red outline), is generated for each slice. These outlines are automatically added and low attenuation pixels below the determined threshold are summated to determine the volume of necrosis.
Histopathology
Hematoxylin and Eosin–stained slides were manually reviewed in a blinded fashion by a pathologist (D.B.). In all except two tumors the gross specimen was oriented in the coronal direction, and cut at the midline, center, of the tumor. As part of the usual examination of these tumors, a 5-μm-thick slice parallel to the first cut was removed for histologic analysis. The percentage of histologically intact tumor and the percentage of necrotic tumor were scored per slide, and the mean percentage of tumor necrosis was calculated, using a continuous scale. The median number of stained slides examined per patient was 10 (range, 8–18). A clinically good response is considered to be at least 90% necrosis (i.e., grade III or IV) (3).
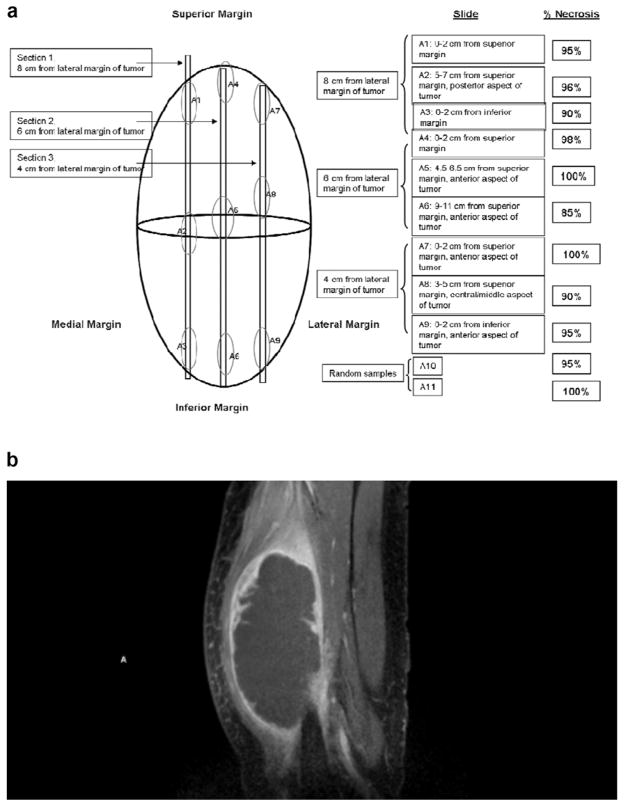
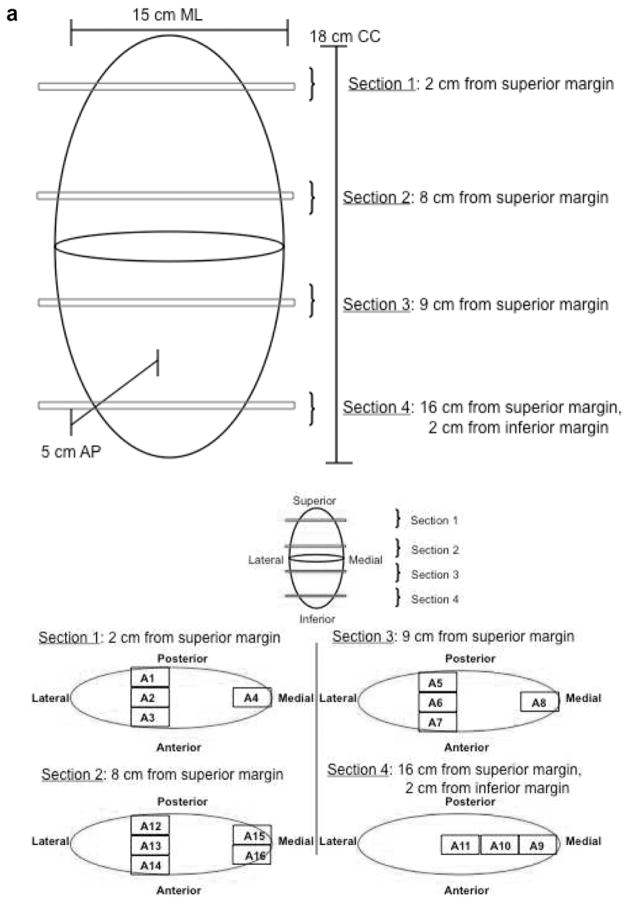
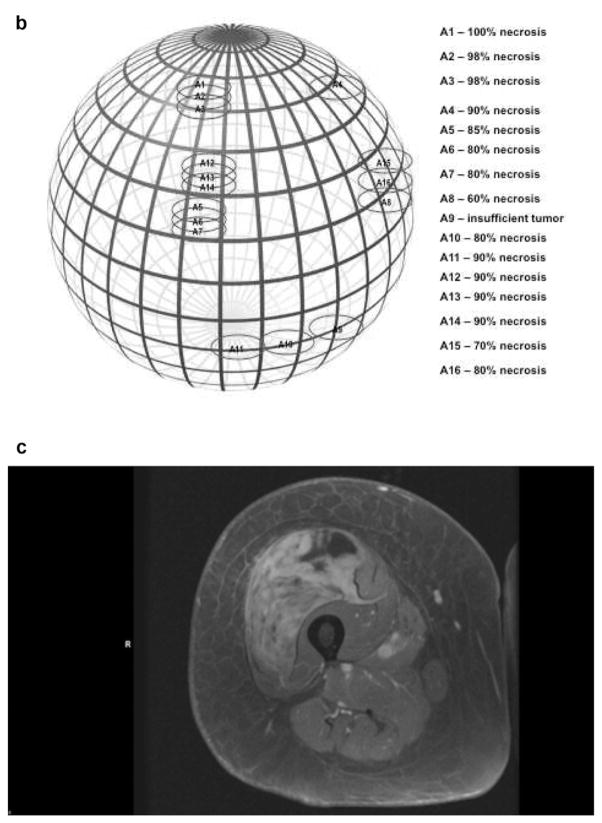
In two tumors, a more complex and complete sectioning of the tumor was performed. The spatial coordinates from which slides were prepared for histological analysis were defined and plotted on a map. The coordinates and maps were then used during analysis of imaging studies to determine the percentage of necrosis at each of these regions of the tumor (Figures 3 and 4).
Figure 3.
63 year old man with pleomorphic undifferentiated sarcoma. (a) Graphic depiction of tumor sectioning for histopathological determination of tumor necrosis. The location from where each histological section is taken is described and the percent necrosis, determined by histological assessment, of each of these sections is reported. (b) Sagital arterial phase CE MRI obtained 2 days prior to surgical resection. MRI image corresponds to sections 2 (S2 A4–6) from graphic depiction (a).
Figure 4.
72 year old man with pleomorphic undifferentiated sarcoma. (a and b) Graphic depiction of tumor sectioning for histopathological determination of tumor necrosis. (a) The location from where each histological section is taken is depicted (a and b). (b) The percent necrosis, determined by histological assessment, of each of these sections is reported. (c) CE MRI obtained 7 days prior to surgical resection. MRI image corresponds to sections sections 3 (S3 A5–8) from graphic depiction (a and b).
Statistical analysis
Interobserver Reproducibility of measurements of the volume of necrosis
The intra-class correlation coefficient (ICC) (21), for the two observers was calculated to determine inter-observer reproducibility for the measurements of the volume of sarcoma necrosis (%), determined using described semiautomated analysis of CE-MRI. Confidence limits were set at 95%. We also constructed Bland–Altman plots (22) between observers, in which the graphs were assigned the mean of the volumes, as measured by the two operators, as the abscissa (x-axis) value and the difference between the two necrosis volumes as the ordinate (y-axis) value. The Spearman’s rank correlation coefficient was used to study the correlation between tumor necrosis (%), determined at histopathology and imaging, RECIST defined change in longest tumor diameter (%), and percent change in whole tumor volume, determined from segmentation of CE-MRI
Results
Inter-observer reproducibility
Initial validation of this approach requires a measurement of inter-observer reproducibility. Semi-automated measurements of the percentage of tumor necrosis are made by 2 observers and compared. For 18 tumors analyzed, observer one and two calculated a median necrosis percentage of 63.7 (SD: 25.7) and 67.8 (SD:22.3), respectively. An ICC of 0.93 and 95% confidence limit of 0.83 and 0.97, respectively, suggest a high degree of inter-observer reproducibility. The Bland and Altman plot also suggests good inter-observer reproducibility (Figure 5).
Figure 5.
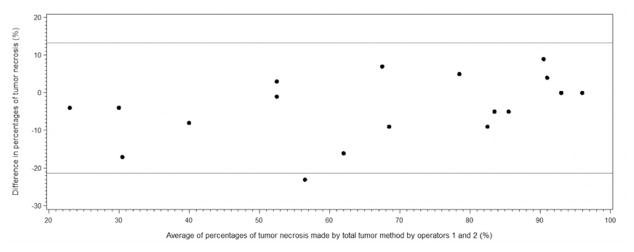
Bland and Altman plot of the difference against the mean of percentages of whole tumor necrosis determined by observers 1 and 2 using semi-automated segementation of CE-MRI.
Accuracy of semi-automated segmentation to determine percentage of tumor necrosis and whole tumor volume
Non-enhancing portions of the tumor are thought to be non-perfused and likely non-viable and necrotic. In an attempt to initially confirm accuracy of this determination, comparisons are made to the histopathologic assessment of resected tumor necrosis, serving as the gold standard. For 18 tumors analyzed, observer one and two calculated a whole tumor median necrosis percentage of 63.7% (SD: 25.7) and 67.8% (SD:22.3), respectively, with a range of 21 to 96% and 25 to 96%, respectively. Histologic assessment demonstrated a median percent necrosis of 71.9% (SD: 31.4) with a range of 5 to 100%. Seven tumors demonstrated near-complete pathologic response (≥95% necrosis) (36%).
There where four patients that had greater than a three week interval between MRI and resection, as a result of patient non-compliance with scheduling of imaging and surgery. If these patients are not included when determining accuracy, as defined as an agreement between the imaging and histology results, a high degree of accuracy is suggested. The ICC is 0.92 with 95% confidence limits of 0.78 and 0.97, respectively. The Bland and Altman plot comparing percentage of tumor necrosis determined by segmentation of CE-MRI with necrosis determined histologically also suggests excellent agreement of the measurements (Figure 6).
Figure 6.
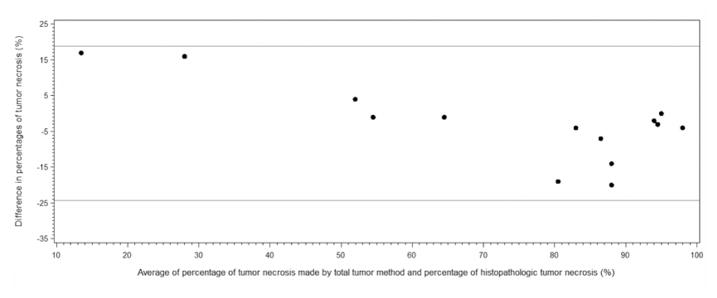
Bland and Altman plot of the difference against the mean of percentage of tumor necrosis determined, by observer one, using segmentation of CE-MRI and percentage of histopathologic tumor necrosis.
Usual histopathologic determination of tumor necrosis involves sampling of the mid-portion of the tumor and hence there may be propensity for sampling error. One potential advantage in determining the percentage of tumor necrosis, based on enhanced cross sectional imaging, is that the entire tumor volume is evaluated potentially eliminating sampling error. However, we found that measurements of tumor necrosis made on three consecutive MRI slices, obtained at the center/midline of the tumor (Mean±SD: 66.0±26.8), were not significantly different from the percentage of necrosis obtained with analysis of the whole tumor volume (Mean±SD: 63.7±25.7). When comparing MRI measurements at the midline of the tumor to histological measurements the ICC of 0.91, 95% confidence limit of 0.76 and 0.97, and the Bland and Altman plot suggest good agreement.
For two tumors, a more laborious complete and detailed approach to histological evaluation is utilized including detailed graphical depiction of locations within the tumor from which sections are taken for histological analysis (Figs 3 and 4). We sought to measure necrosis using segmentation of CE-MRI at specific locations were histological determination of necrosis was performed, using the grid representation of locations of tumor sectioning, with measured coordinates, to determine theses locations on CE-MRI images. For these two tumors 7 sections were obtained from which histologic sections were prepared and CE-MRI segmentation was performed. These measurements were very similar with MRI determined necrosis mean measurements of 82±11% and histologically determined mean measurements of 89±7% necrosis.
The accuracy of semi-automated determination of the volume of the whole tumor, is evaluated by comparing these measurements to the actual volume of the resected tumor. Three tumors were predominately cystic and a large amount of cyst fluid spilled from the specimen when being measured. Therefore, actual measurements of these tumors were deemed to be erroneous and not included in this analysis. However, comparisons using the other fifteen tumors suggest a high degree of accuracy of the volume determinations. The mean tumor volume, calculated using the semi-automated segmentation was 501.2±571 and actual mean volume, determined at pathology, was 448±568.5. The ICC of 0.98, 95% confidence limits of 0.94 and 0.99, as well as the Bland and Altman Plot all demonstrate excellent agreement between the tumor volume obtained from MRI segmentation and the actual tumor volume determined at pathology.
Comparison of RECIST criteria defined, linear measurements, with volumetric measurements of the whole tumor and tumor necrosis
In accordance with RECIST, the single longest linear diameter of each tumor is manually measured on our PACS system, by one of the observers (B.J.). Measurements were made from CE-MRI images obtained at the start of treatment and within three weeks of surgical resection. The whole tumor volume and percent change, over the course of treatment, is also determined from these MRI images using semi-automated segmentation. The median tumor diameter was 10.3 cm (range, 2.2–18.7 cm). The median percent change in tumor diameter is −11.2 ±19.8% (range, −33.6 to +32.3%), while the median change in tumor volume is −10.3 ±60.5 cm3.
There were no statistically significant correlations between RECIST defined measurements and necrotic tumor measurements, suggesting that RECIST criteria may not reflect clinically relevant changes in tumor necrosis. However, there was a statistically significant correlation between tumor necrosis (%), and tumor volume (cc), both determined from CE-MRI obtained within three weeks of resection (Spearman’s rank correlation coefficient=0.537; p-value=0.021). There was also a statistically significant correlation between the percent change in the longest tumor diameter and the percent change in whole tumor volume (Spearman’s rank correlation coefficient=0.847; p-value<0.0001).
Discussion
Currently, quantitation of necrosis in the surgical specimen is the most commonly applied assessment of response available to clinicians treating solid tumors with neoadjuvant therapy (23). Studies in STS, as in other tumors, may suggest degree of necrosis to correlate with survival (24). Although these studies have been retrospective in nature, have analyzed varying thresholds of tumor necrosis (80–99%), and have employed heterogenous preoperative regimens including multi-agent chemotherapy, chemoradiation, or RT monotherapy, the degree of treatment-induced pathologic necrosis in the surgical specimen continues to be used as a short term quantitative endpoint in STS despite limited data establishing a link between extent of pathologic necrosis and long term outcomes (25). It is useful to have a reproducible and validated surrogate imaging endpoint for early determination of response. The purpose of the present study is to describe a novel semi-automated segmentation approach applied to CE MRI to determine STS volume and the percentage of necrosis, non-enhancing, tumor. This pilot study represents initial steps to validate this approach, determining accuracy and reproducibility (26).
STS show significant histological treatment responses in the form of hyaline fibrosis, necrosis and granulation tissue. Despite this, there is minimal early change in the overall size of the tumor as evaluated using RECIST criteria, and volumetric whole tumor measurements (14, 27). Canter et al. have previously shown that these linear measurements did not predict clinical outcome while tumor necrosis, determined with histopathology, did predict clinical outcome (14). This suggested the need for novel imaging end points to evaluate response without the need for resection. For example, the Choi criteria of evaluating tumor contrast enhancement at CE MR or CE CT, is said to complement tumor size determination and has been suggested to be predictive of pathologic response (10).
The measurements described here are likely to predict clinical response since local treatment failure, evidenced by lack of substantial necrosis, frequently contributes to patient death (28). However, power calculations suggest at least 96 patients would be required to establish the ability of this approach to predict survival, which is out of the scope of this initial description and validation. Given the small sample size of the current study, it is not certain that the results can be generalized for all soft tissue sarcomas. It is important to note that biological plausibility alone is inadequate to allow any endpoint to be validated without a demonstration of correlation with a true patient benefit outcomes (26). This suggests the need for further evaluation of the technique in large prospective Phase II or III clinical trial following this initial validation, as proof of concept.
Assessment of necrosis, as determined from histology, utilizes 5 micron slices, usually from the midline of the tumor, which the pathologist feels is representative of the entire tumor. With this usual histologic determination of tumor necrosis, it is likely that there is the potential for sample error, in which the chosen tumor sections may not be representative of the entire tumor necrosis. It is known, from enhanced imaging, that often times the pattern of necrosis is patchy and irregular in shape throughout the tumor volume (15, 16). We hypothesized that the imaging based evaluation of the whole tumor necrotic volume would reduce this sampling error. However, we found that the percentage of non-enhancing necrosis, throughout the whole tumor, was not significantly different from necrosis at the midline of the tumor, corresponding to the section of the resected tumor usually evaluated histologically. This suggested that sampling error may be less of an issue than originally hypothesized.
A potential limitation of this approach is that imaging slices are approximately 5 to 10 mm and therefore do not directly match the histopathologic slices, perhaps limiting comparisons of imaging with histology. Furthermore, CE-MR imaging demonstrates lack of tissue enhancement, thought to correspond to necrosis, and not actual cell death demonstrated histologically. To further investigate the accuracy of the imaging based evaluation of tumor necrosis we evaluated more sophisticated approaches of documenting tumor section locations, mapping coordinates of where tumor sections were taken (Figures 3 and 4). Determination of “necrosis”, based on CE MRI, also correlated well with histological determination at these specific sections. It is thus suggested that areas of non-enhancing, low signal intensity, tumor likely correspond with tumor necrosis determined with H&E staining of tumor sections. While our results suggest good correlation of percentage of non-enhancing, necrotic, tumor on MRI with that determined at histology, Bajpai et al. found that a change in pattern of enhancement did not correlate with necrosis (29).
A possible limitation of CE-MRI is that over time Gadolinium may diffuse into the necrotic tissue, thereby potentially obscuring tumor necrosis on the contrast enhanced MR images. This may result in false reduction in “necrotic volume” (31). In the current study, there was likely little diffusion of the gadolinium across the interstitium into the necrotic tissue since images are obtained in the arterial phase of enhancement, 4 seconds following contrast administration. Another limitation of CE MRI is that portions of a tumor may enhance and yet contain no viable tumor cells; for example, the supporting stroma may persist despite death of the tumor cells, and enhancing reparative granulation tissue may be present. This could result in falsely elevated determination of “viable” tumor tissue. Our results suggest good accuracy of this approach for the depiction of necrotic tumor tissue, correlating well with percentage tumor necrosis determined histologically.
Measurements of whole tumor volume may be useful in evaluating response to therapy (18, 30). However, these approaches also need to be validated. We found whole tumor volumes determined with these semi-automated techniques corresponded well with tumor volumes determined by pathologists, following resection. Any discrepancy between volume change, as assessed by MRI, and at histopathology might be explained by the slow regression of any osteoid matrix and/or cystic degeneration in good responders with possible corresponding fallacious increase in size on MRI (32). This may be illustrated in the three resected cystic tumors that could not be accurately measured at pathology.
When evaluating reproducibility, two blinded medical students performed the analysis, following a training session. The intent was to demonstrate that relatively inexperienced observers could accurately perform this semi-automated segmentation as might be the case if technologists, physician extenders, or radiologists in training in a core lab or academic centers may be providing these measurements.
Conclusion
This technique of CE-MR imaging with semi-automated volumetric segmentation of necrotic tumor allows noninvasive depiction of the entire tumor and can be performed early in the course of therapy and serially throughout therapy. This may allow earlier identification of inferior responders, giving clinicians the opportunity to identify a population of patients that may benefit from a change in therapy type or dose. This initial validation suggests the technique to be reproducible, and accurate, correlating with histopathologic evaluation.
References
- 1.Jemal A, Siegel R, Xu J, Ward E. Cancer statistics 2010. CA Cancer J Clin. 2010;60(5):277–300. doi: 10.3322/caac.20073. [DOI] [PubMed] [Google Scholar]
- 2.Grimer R, Judson I, Peake D, Seddon B. Guidelines for the Management of soft tissue sarcoma. Sarcoma. 2010;2010:506182. doi: 10.1155/2010/506182. [DOI] [PMC free article] [PubMed] [Google Scholar]
- 3.Weitz J, Antonescu C, Brennan M. Localized extremity soft tissue sarcoma: improved knowledge with unchanged survival over time. J Clin Oncol. 2003;21:2719–2725. doi: 10.1200/JCO.2003.02.026. [DOI] [PubMed] [Google Scholar]
- 4.Wunder J, Nielsen T, Maki R, O’Sullivan B, Alman B. Opportunities for improving the therapeutic ratio for patients with sarcoma. The Lancet Oncology. 2007;8:513–524. doi: 10.1016/S1470-2045(07)70169-9. [DOI] [PubMed] [Google Scholar]
- 5.Schuetze SM, Baker LH, Benjamin RS, Canetta R. Selection of response criteria for clinical trials of sarcoma treatment. Oncologist. 2008;13:32–40. doi: 10.1634/theoncologist.13-S2-32. [DOI] [PubMed] [Google Scholar]
- 6.Stacchiotti S, Collini P, Messina A, et al. High-grade soft-tissue sarcomas: tumor response assessment–pilot study to assess the correlation between radiologic and pathologic response by using RECIST and Choi criteria. Radiology. 2009;251:447–456. doi: 10.1148/radiol.2512081403. [DOI] [PubMed] [Google Scholar]
- 7.Stahl R, Wang T, Lindner LH, et al. Comparison of radiological and pathohistological response to neoadjuvant chemotherapy combined with regional hyperthermia (RHT) and study of response dependence on the applied thermal parameters in patients with soft tissue sarcomas (STS) Int J Hyperthermia. 2009;25:289–298. doi: 10.1080/02656730902873616. [DOI] [PubMed] [Google Scholar]
- 8.Benjamin R, Choi H, Macapinlac H, et al. We should desist using RECIST, at least in GIST. J Clin Oncol. 2007;25:1760–1764. doi: 10.1200/JCO.2006.07.3411. [DOI] [PubMed] [Google Scholar]
- 9.Apfaltrer P, Meyer M, Meier C, et al. Contrast-enhanced dual-energy CT of gastrointestinal stromal tumors: is iodine-related attenuation a potential indicator of tumor response? Invest Radiol. 2011 Sep 19; doi: 10.1097/RLI.0b013e31823003d2. Epub ahead of print. [DOI] [PubMed] [Google Scholar]
- 10.Choi H. Critical issues in response evaluation on computed tomography: lessons from the gastrointestinal stromal tumor model. Curr Oncol Rep. 2005;7(4):307–311. doi: 10.1007/s11912-005-0055-4. [DOI] [PubMed] [Google Scholar]
- 11.Dudeck O, Zeile M, Reichardt P, Pink D. Comparison of RECIST and Choi criteria for computed tomographic response evaluation in patients with advanced gastrointestinal stromal tumor treated with sunitinib. Ann Oncol. 2011;22(8):1828–1833. doi: 10.1093/annonc/mdq696. [DOI] [PubMed] [Google Scholar]
- 12.Kaste SC, Liu T, Billups CA, Daw NC, Pratt CB, Meyer WH. Tumor size as a predictor of outcome in pediatric non-metastatic osteosarcoma of the extremity. Pediatr Blood Cancer. 2004;43:723–772. doi: 10.1002/pbc.20077. [DOI] [PubMed] [Google Scholar]
- 13.Uhl M, Saueressig U, van Buiren M, et al. Osteosarcoma: preliminary results of in vivo assessment of tumor necrosis after chemotherapy with diffusion- and perfusion-weighted magnetic resonance imaging. Invest Radiol. 2006;41(8):618–623. doi: 10.1097/01.rli.0000225398.17315.68. [DOI] [PubMed] [Google Scholar]
- 14.Canter RJ, Martinez SR, Tamurian RM, et al. Radiographic and histologic response to neoadjuvant radiotherapy in patients with soft tissue sarcoma. Ann Surg Oncol. 2010;17:2578–2584. doi: 10.1245/s10434-010-1156-3. [DOI] [PMC free article] [PubMed] [Google Scholar]
- 15.Monsky WL, Kim I, Loh S, et al. Semiautomated segmentation for volumetric analysis of intratumoral ethiodol uptake and subsequent tumor necrosis after chemoembolization. AJR. 2010;195:1220–1230. doi: 10.2214/AJR.09.3964. [DOI] [PubMed] [Google Scholar]
- 16.Monsky WL, Garza AS, Kim I, et al. Treatment planning and volumetric response assessment for Yttrium-90 radioembolization: semiautomated determination of liver volume and volume of tumor necrosis in patients with hepatic malignancy. Cardiovasc Intervent Radiol. 2011;34:306–318. doi: 10.1007/s00270-010-9938-3. [DOI] [PMC free article] [PubMed] [Google Scholar]
- 17.Yaghmai V, Miller FH, Rezai P, Benson AB, 3rd, Salem R. Response to treatment series: part 2, tumor response assessment--using new and conventional criteria. AJR. 2011;197:18–27. doi: 10.2214/AJR.11.6581. [DOI] [PubMed] [Google Scholar]
- 18.Eisenhauer EA, Therasse P, Bogaerts J, et al. New response evaluation criteria in solid tumours: revised RECIST guideline (version 1.1) Eur J Cancer. 2009;45:228–247. doi: 10.1016/j.ejca.2008.10.026. [DOI] [PubMed] [Google Scholar]
- 19.Ray S, Hagge R, Gillen M, et al. Comparison of two-dimensional and three-dimensional iterative watershed segmentation methods in hepatic tumor volumetrics. Med Phys. 2008;35:5869–5881. doi: 10.1118/1.3013561. [DOI] [PMC free article] [PubMed] [Google Scholar]
- 20.Drever L, Robinson DM, McEwan A, et al. A local contrast based approach to threshold segmentation for PET target volume delineation. Med Phys. 2006;33:1583–1594. doi: 10.1118/1.2198308. [DOI] [PubMed] [Google Scholar]
- 21.Fisher RA. Biological monographs and manuals. 12. Hafner; New York, NY: 1954. Statistical methods for research workers; p. 356. [Google Scholar]
- 22.Bland JM, Altman DG. Statistical methods for assessing agreement between two methods of clinical measurement. Lancet. 1986;1(8476):307–310. [PubMed] [Google Scholar]
- 23.Eilber FC, Rosen G, Eckardt J, Forscher C, Nelson SD, Selch M, Dorey F, Eilber FR. Treatment-induced pathologic necrosis: a predictor of local recurrence and survival in patients receiving neoadjuvant therapy for high-grade extremity soft tissue sarcomas. J Clin Oncol. 2001;19:3203–3209. doi: 10.1200/JCO.2001.19.13.3203. [DOI] [PubMed] [Google Scholar]
- 24.Macdermed DM, Miller LL, Peabody TD, Simon MA, Luu HH, Haydon RC, Montag AG, Undevia SD, Connell PP. Primary tumor necrosis predicts distant control in locally advanced soft-tissue sarcomas after preoperative concurrent chemoradiotherapy. Int J Radiat Oncol Biol Phys. 2009 doi: 10.1016/j.ijrobp.2009.03.015. [DOI] [PMC free article] [PubMed] [Google Scholar]
- 25.Mansour JC, Schwarz RE. Pathologic response to preoperative therapy: does it mean what we think it means? Ann Surg Oncol. 2009;16:1465–1479. doi: 10.1245/s10434-009-0374-z. [DOI] [PubMed] [Google Scholar]
- 26.Sargent DJ, Rubinstein L, Schwartz L, et al. Validation of novel imaging methodologies for use as cancer clinical trial endpoints. Eur J Cancer. 2009;45:290–299. doi: 10.1016/j.ejca.2008.10.030. [DOI] [PMC free article] [PubMed] [Google Scholar]
- 27.Roberge D, Skamene T, Nahal A, Turcotte RE, Powell T, Freeman C. Radiological and pathological response following pre-operative radiotherapy for soft-tissue sarcoma. Radiother Oncol. 2010;97:404–407. doi: 10.1016/j.radonc.2010.10.007. [DOI] [PubMed] [Google Scholar]
- 28.Canter RJ, Qin LX, Ferrone CR, et al. Why do patients with low-grade soft tissue sarcoma die? Ann Surg Oncol. 2008;15:3550–3560. doi: 10.1245/s10434-008-0163-0. [DOI] [PMC free article] [PubMed] [Google Scholar]
- 29.Bajpai J, Gamnagatti S, Kumar R, Sreenivas V, et al. Role of MRI in osteosarcoma for evaluation and prediction of chemotherapy response: correlation with histological necrosis. Pediatr Radiol. 2011;41:441–450. doi: 10.1007/s00247-010-1876-3. [DOI] [PubMed] [Google Scholar]
- 30.Dyke JP, Panicek DM, Healey JH, et al. Osteogenic and Ewing sarcomas: estimation of necrotic fraction during induction chemotherapy with dynamic contrast-enhanced MR imaging. Radiology. 2003;228:271–278. doi: 10.1148/radiol.2281011651. [DOI] [PubMed] [Google Scholar]
- 31.Reddick WE, Bhargava R, Taylor JS, Meyer WH, Fletcher BD. Dynamic contrast-enhanced MR imaging evaluation of osteosarcoma response to neoadjuvant chemotherapy. J Magn Reson Imaging. 1995;5:689–694. doi: 10.1002/jmri.1880050612. [DOI] [PubMed] [Google Scholar]
- 32.van der Woude HJ, Bloem JL, Hogendoorn PC. Preoperative evaluation and monitoring chemotherapy in patients with high-grade osteogenic and Ewing’s sarcoma: review of current imaging modalities. Skeletal Radiol. 1998;27:57–71. doi: 10.1007/s002560050339. [DOI] [PubMed] [Google Scholar]


