

Abstract
Background
We previously demonstrated that morphologic defects of ileal Paneth cells correlate with multiple susceptible genetic variants, the presence of granuloma, and clinical outcome in Crohn’s disease. These studies were performed using uninvolved areas of resection specimens. To develop Paneth cell phenotype as a prognostic biomarker in Crohn’s disease, further characterization is necessary. Specifically, effects of disease activity, phenotype duration, and the minimal crypt number that would allow for accurate Paneth cell phenotyping are unknown.
Methods
We compared Paneth cell phenotypes in (1) 46 cases with paired involved and uninvolved sections; (2) 36 cases with multiple ileal resections over time; (3) “virtual biopsies” by randomly selecting 10 to 60 crypts from 85 surgical cases where 250 crypts had been analyzed; and (4) 26 cases with resection and biopsy performed within 1 year.
Results
In paired resection specimens, the Paneth cell phenotypes in the uninvolved areas correlated with those seen in involved areas (P < 0.0001) and also predicted the presence of granuloma (P = 0.042). Importantly, the Paneth cell phenotype remained stable over time (P < 0.0001). By mathematical analyses, a minimum of 40 crypts was required to generate results equivalent to those using resection specimens. Finally, there was good correlation in Paneth cell phenotypes in biopsy specimens and resection specimens obtained within 1 year (P = 0.0004).
Conclusions
Accurate Paneth cell phenotypes can be assessed using biopsy materials with the caveat that sufficient well-oriented crypts exist in the specimen. This advance will extend the potential clinical application of this novel stratification platform.
Keywords: lysozyme, defensin, immunofluorescence, endoscopy, stratification
Crohn’s disease (CD) involves a complex network of etiologic factors, including genetic susceptibility, immune dysregulation, and environmental triggers.1–4 Therefore, it is challenging to study the pathogenesis and prognosis using simple genotype–phenotype correlation models. Conversely, the importance of studying disease-relevant cell types has been increasingly recognized as an effective and insightful direction in CD research.5,6 Therefore, new approaches are needed that focus on a CD-associated cell type that can synthesize the impact of genetic and potential environmental factors.
One disease-relevant cell type is the Paneth cell, which was previously shown to integrate both genetic and environmental factors that can lead to abnormal function.7–9 Localized in the base of crypts of Lieberkühn, the major role of Paneth cells is to produce, package, and secrete antimicrobial peptides (e.g., lysozymes, defensins) that play important roles in innate mucosal immunity. The distribution of lysozyme in Paneth cells, which is normally contained in abundant apical granules, can be abnormal as a consequence of multiple disease susceptibility loci, including the autophagy-associated ATG16L1 and NOD2 genes,7–13 and environmental factors. In genetically susceptible mice, viral infection can trigger these defects, although the trigger in CD patients is still unknown.8 Using clinical specimens, we found that the Paneth cell phenotypes are associated with gene expression profiles and the presence of granuloma, one of the pathologic hallmarks of CD.9 Importantly, the Paneth cell phenotype more accurately predicts the time to disease recurrence in CD patients undergoing resection as opposed to genotype.9
However, the Paneth cell phenotype analysis in our previous study was determined using a single resection specimen from each patient. Although promising, many clinical and biologic questions remain unanswered. The utility of this morphologic signature as a prognostic biomarker for use in clinical practice would be greatly enhanced if biopsy-obtained material could provide similar information to that taken from resection specimens. To further characterize the plasticity of Paneth cell phenotype and address the feasibility of extending our Paneth cell phenotype analysis to routine diagnostic mucosal biopsy materials, we first compared the Paneth cell phenotypes in paired involved and uninvolved areas from the same resection cases. We also compared the Paneth cell phenotypes from patients who received multiple resections over a number of years. To best validate this technique, we further applied a mathematical analysis for “virtual biopsy” using a large series of analyzed resection specimens. Finally, we compared the Paneth cell phenotypes between biopsy and resection specimens from the same patients. Our data demonstrate the spatial and temporal stability of Paneth cell phenotype and also the feasibility of using biopsy material for Paneth cell phenotype analysis.
MATERIALS AND METHODS
Collection of Human Ileum Tissue Samples
For characterization of disease activity and Paneth cell phenotype and “virtual biopsy,” patients with CD were recruited at the Washington University School of Medicine between 2005 and 2010 or at the Cedars-Sinai Medical Center between 1999 and 2010. All patients were genotyped as described previously.9 The Institutional Review Boards of the Washington University School of Medicine and the Cedars-Sinai Medical Center approved the study protocol. All study participants provided a written informed consent.
For longitudinal studies, patients with multiple small intestinal resections and those with preoperative or postoperative endoscopic biopsy performed within a year of resection were identified through computer search of the Department of Pathology and Immunology archive at the Washington University School of Medicine, and resections performed between 1987 and 2009 with sufficient tissue material for analysis were included. The Institutional Review Board of the Washington University School of Medicine approved the study protocol.
Morphologic Analysis of Paneth Cells
Pathologists (T.-C.L. and T.S.S.) selected the representative sections from each ileal/ileocolic resection and biopsy specimen after reviewing the routine hematoxylin and eosin –stained slides for each case. Lysozyme distribution was classified as previously described (Fig. 1).7–9 A pathologist (T.-C.L.) who was blinded to the identity and characteristics of the cases scored a total of 250 crypts for each resection specimen, with the documentation of each individual crypt. Paneth cells located within Peyer’s patches were excluded. A case was classified as “bad” Paneth cell phenotype if ≥20% Paneth cells contained abnormal cytoplasmic antimicrobial granules and “good” Paneth cell phenotype if it contained <20% abnormal cytoplasmic granules.9
FIGURE 1.
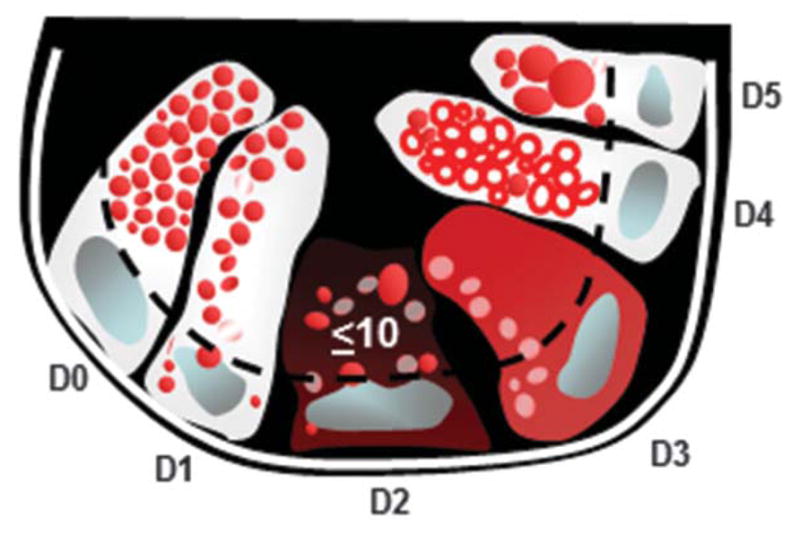
Diagram of Paneth cell cytoplasmic antimicrobial granule morphology classification under lysozyme immunofluorescence. The Paneth cell lysozyme distribution can be categorized into normal (D0) and 5 abnormal (D1–D5) categories. D1: disordered; D2: diminished; D3: diffuse; D4: excluded; D5: enlarged.
Virtual Biopsy Analysis
Virtual biopsy samples were generated from the 250 crypt-analyzed resection specimens. From the annotated crypt-by-crypt database from these resection specimens, 10, 20, 30, 40, 50, and 60 random consecutive crypts were selected using random number generator software (Graphpad Prism). For each case, the random number generated by the software was used to designate the first crypt of the virtual biopsy, from which consecutive crypts were selected. The results of these virtual biopsies were then compared with the 250-crypt analysis of the resected specimen using logarithm transformation.
Statistical Analysis
For the correlation study comparing the Paneth cell phenotypes in involved and uninvolved areas, Paneth cell phenotypes in first and subsequent resection specimens, and Paneth cell phenotypes in paired resection and biopsy specimens, linear regression and the correlation coefficient (Pearson’s r) were performed (Graphpad Prism software). A P value of <0.05 was considered significant. For virtual biopsy analyses, the percentage of abnormal Paneth cells in each random sample was described using mean and SD. Means and SDs for the absolute differences between virtual biopsies and 250-crypt sample were also calculated. The bioequivalence between virtual biopsies and 250-crypt samples was assessed using two-way analysis of variance for repeated measurement data, followed by post hoc multiple comparisons for between-group differences. A logarithm transformation was performed on the percentage of abnormal Paneth cells in each sample to better satisfy the normality assumption. A coefficient of variance (mean/SD) of approximately 30% was observed in the 250-crypt sample after logarithm transformation. The designed sample size (85 cases) would allow us with 95% power at 1-sided 0.1 significance level to show a difference of 1.5% or less in abnormal Paneth cells being “equivalent.” All analyses were 2-sided tests, with the significance indicated by P < 0.20 for bioequivalence and P < 0.05 otherwise. The statistical analyses were performed using SAS version 9.2 (SAS Institutes, Cary, NC).
Ethical Considerations
The submitted manuscript is an original contribution not previously published and not be under consideration for publication elsewhere and, if accepted, will not be published elsewhere in similar form, in any language, without the consent of the publisher.
RESULTS
Paneth Cell Phenotypes in Involved and Uninvolved Areas Are Consistent
To mitigate the potential, unknown impact of disease activity on Paneth cell phenotypes, our previous study was based on the analysis of ileal resection margins, which were screened and selected to contain no or minimal disease activity.9 A highly significant advance would be the ability to apply Paneth cell phenotypes to clinical studies where only biopsy material is available including biopsies from areas with active disease. Therefore, we need to determine whether Paneth cell phenotypes are altered by proximity to known areas of disease activity (ulcer, acute inflammation, etc). In other words, are Paneth cell phenotypes in the involved areas consistent with those of the uninvolved areas? We analyzed paired areas in 46 ileocolic resection specimens representing both disease involved and uninvolved areas. We compared the sum total percentages of “bad” Paneth cells including “diminished,” “diffuse,” “excluded,” and “enlarged” phenotypes in each specimen.9 For each case, the sum percentage of abnormal Paneth cells in a disease involved area was compared with uninvolved areas (Table 1). Our cutoff to determine whether a specimen has an enrichment of bad Paneth cells is 20% of the total, as this classification showed correlations with both pathologic and clinical features.9 As shown in Figure 2A, the Paneth cell phenotypes of uninvolved areas correlated with that of the involved areas (Pearson’s r = 0.6921; P < 0.0001). Of note, in this cohort, 18 of the 46 cases (39%) would be classified as the bad Paneth cell phenotype using the analysis from the uninvolved areas. Importantly, using 20% abnormal Paneth cells as cutoff, the Paneth cell phenotype in the involved area also inversely correlated with the presence of granuloma (Fig. 2B; P = 0.042) in keeping with our previous findings. Representative hematoxylin and eosin–stained photomicrographs of uninvolved and involved areas that were scored here are shown in Figure 2C and D, respectively.
TABLE 1.
Sum of Total Percentage of Abnormal Paneth Cells in Involved and Uninvolved Areas of CD Resection Specimens
| Involved Area | Uninvolved Area |
|---|---|
| 11.95 | 9.69 |
| 12.4 | 9.79 |
| 21.06 | 21.95 |
| 25.48 | 29.12 |
| 20.17 | 15.96 |
| 7.11 | 6.59 |
| 21.04 | 7.89 |
| 19.97 | 17.08 |
| 7.36 | 12.83 |
| 23.68 | 60.3 |
| 24.14 | 32.7 |
| 14.89 | 9.75 |
| 8.62 | 8.27 |
| 27.31 | 26.35 |
| 19.25 | 38.25 |
| 21.88 | 16.4 |
| 7.92 | 8.4 |
| 11.53 | 35.78 |
| 14.92 | 24.62 |
| 14.42 | 5.66 |
| 15.82 | 40.34 |
| 10.45 | 4.5 |
| 17.71 | 13.03 |
| 41.46 | 36.57 |
| 33.79 | 29.7 |
| 18.29 | 25.3 |
| 20.72 | 10.73 |
| 28.29 | 30.58 |
| 27.67 | 28.93 |
| 16.23 | 0.95 |
| 13.13 | 5.96 |
| 25.91 | 60.78 |
| 31.55 | 52.04 |
| 38.83 | 72.63 |
| 18.31 | 19.88 |
| 13.24 | 6.27 |
| 15.81 | 4.67 |
| 13.47 | 18.21 |
| 16.92 | 15.72 |
| 25.9 | 35.93 |
| 28.14 | 33.48 |
| 16.4 | 5.82 |
| 7.8 | 5.6 |
| 12.16 | 18.19 |
| 15.21 | 8.03 |
| 18.83 | 9.71 |
FIGURE 2.

Paneth cell phenotypes from involved areas in resection specimens correlated with that of uninvolved areas and predict the presence of granuloma. A, Using 20% abnormal Paneth cells as a cutoff, 46 paired involved and uninvolved small intestinal resection specimens were compared. The Paneth cell phenotypes (determined by total percentage of abnormal Paneth cells) obtained from the involved areas significantly correlated with that from the uninvolved areas (P < 0.0001). B, In involved area, <20% abnormal Paneth cells significantly correlate with the presence of granuloma (P = 0.042). C, Representative photomicrograph of uninvolved area (hematoxylin and eosin). D, Representative photomicrograph of involved area (hematoxylin and eosin). Scale bar: 20 μm.
Paneth Cell Phenotype is Stable Over Time
To evaluate the stability of Paneth cell phenotype over time, we identified 30 CD patients who underwent 2 small intestinal resections and 6 additional patients who had 3 or more small intestinal resections. The uninvolved areas were used for the analysis. As shown in Figure 3, in the 30 patients who had 2 resections, the Paneth cell phenotype of the first resection correlated with that of the second resection (Pearson’s r = 0.6597; P < 0.0001). The Paneth cell phenotypes in the 6 patients who received 3 or more small intestinal resections were also stable over time (Table 2). These findings suggest that during the course of CD, the Paneth cell phenotype is similar at multiple time points during the natural history of the disease.
FIGURE 3.

Paneth cell phenotypes are consistent over multiple specimens over time. In patients (n = 30) who received 2 resections, the Paneth cell phenotype from the first resection specimens correlated with that of the second resections (P < 0.0001).
TABLE 2.
Paneth Cell Phenotype Remains Stable in a Series of Small Intestinal Resections from the Same Patients
| Patient | 1 | 2 | 3 | 4 | 5 | 6 |
|---|---|---|---|---|---|---|
| Resection 1 | 7.01 | 6.60 | 8.88 | 8.90 | 7.15 | 11.94 |
| Resection 2 | 15.71 | 8.40 | 14.10 | 17.99 | 7.32 | 6.89 |
| Resection 3 | 12.83 | 8.83 | 19.17 | 7.27 | 7.47 | 10.23 |
| Resection 4 | N/A | 7.63 | N/A | N/A | N/A | N/A |
Total percentage of abnormal Paneth cells (%) is listed for each specimen.
N/A, non applicable.
Determination of Minimal Crypt Number for Paneth Cell Phenotype Analysis
The ileocolic resection specimens used for our previous Paneth cell phenotype analysis provided morphologic detail of the disease involvement and contained ≥250 well-oriented crypts. However, as the distribution of abnormal Paneth cells could be focal within the specimen,9 it was important to determine the minimal number of crypts in the context of biopsy that would accurately reflect the Paneth cell phenotype from the resection specimens. As an unbiased approach, we performed mathematical analysis on “virtual biopsies” from the resection specimens analyzed above. We first determined and recorded the phenotype of each individual crypt in 85 previously analyzed resection specimens (n = 250 crypts for all cases). A series of “virtual biopsies” were then performed by randomly selecting 10, 20, 30, 40, 50, or 60 consecutive crypts. The average discrepancies in the percentages of abnormal Paneth cells of these virtual biopsies as compared with the 250 total crypts were shown in Table 3. Bio-equivalence analysis showed that results from randomly sampled 40 or more crypts were statistically equivalent to the measures using 250 crypt-analyzed resection specimens. Detailed information of the abnormal Paneth cell percentage in each resection specimens (250 crypts) and corresponding individual virtual biopsy are shown in Table, Supplemental Digital Content 1, http://links.lww.com/IBD/A410.
TABLE 3.
Discrepancy Between Virtual Biopsy and Resection Specimens
| Crypt Numbers | Mean Discrepancy | SD | Median Discrepancy | Minimum Discrepancy | Maximum Discrepancy | P |
|---|---|---|---|---|---|---|
| 10 | 5.64 | 5.43 | 4.06 | 0.19 | 27.15 | 0.0002 |
| 20 | 4.60 | 4.71 | 3.04 | 0.00 | 23.66 | 0.0333 |
| 30 | 4.15 | 3.83 | 3.57 | 0.02 | 19.44 | 0.1164 |
| 40 | 3.50 | 3.94 | 2.64 | 0.02 | 21.34 | 0.4322 |
| 50 | 3.98 | 4.27 | 2.61 | 0.09 | 22.20 | 0.7708 |
| 60 | 3.28 | 3.89 | 1.97 | 0.05 | 21.83 | 0.6587 |
Biopsy Material Is Sufficient for Paneth Cell Phenotype Analysis
We next tested if Paneth cell analysis on actual biopsy samples correlated with previous analysis of resection specimens. We performed Paneth cell phenotype analysis on endoscopic biopsy material from 34 cases that had prior scored resection within 1 year of the biopsy. Uninvolved areas were used in the resection specimens, whereas the biopsy specimens show none or mild activity. Our second inclusion criterion was that the biopsy material contained ≥50 crypts that are free of cautery artifact. As shown in Figure 4A, among the 26 cases that met both criteria, there was a significant correlation of Paneth cell phenotypes between the resection and biopsy specimens (Pearson’s r = 0.6437; P = 0.0004). Figure 4B is a representative microphotograph of lysozyme immunofluorescence stain (costained with beta-catenin for cell border and DAPI for nucleus). To determine the percentage of routine biopsy material that would meet the criteria for Paneth cell phenotype analysis, we examined 188 randomly selected biopsy samples. Among these, 142 cases (75.5%) met the requirement. Thus, the Paneth cell phenotype analysis can be performed in most of the biopsy specimens stored in pathology archives.
FIGURE 4.
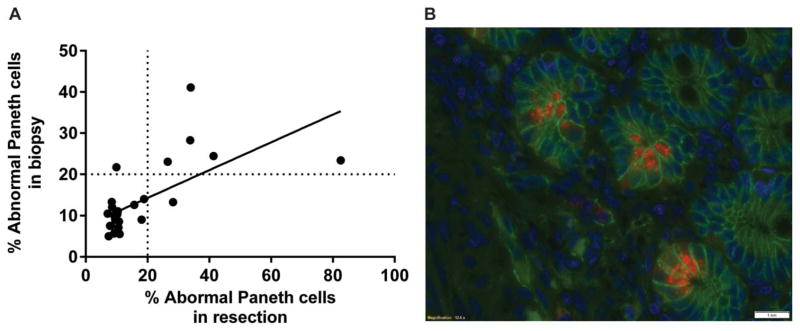
Paneth cell phenotypes are similar from biopsy and resections specimen. A, In patients (n = 26) who received endoscopic biopsy within a year of their resections, the Paneth cell phenotypes from the resection specimens correlated with that of the biopsy specimens (P = 0.0004). B, Representative photomicrographs of small intestinal biopsy specimens under lysozyme immunofluorescent staining. Red: lysozyme; blue: DAPI (nuclei); green: beta-catenin (cell border). Scale bar: 20 μm.
DISCUSSION
In this study, we demonstrated that Paneth cell phenotypes were consistent when comparing involved and uninvolved areas of resection specimens. We also showed that the Paneth cell phenotypes in the same patient were stable over time in multiple resections. We then systematically performed virtual biopsies on a series of resection specimens. Using mathematical analyses, we determined the minimal crypts needed in biopsy specimens for Paneth cell phenotype assay. Finally, we demonstrated that in the same patients, the Paneth cell phenotypes are consistent in resection specimens and biopsy performed within a year of the resection.
These results have significant implications for the study of Paneth cell phenotypes in CD. We concluded that there is a significant correlation between the Paneth cell phenotypes between areas with and without active inflammation. Therefore, Paneth cell phenotype is not simply a reflection of disease activity. An additional practical concern is that mucosal biopsies are usually sampled from endoscopically (grossly) involved areas where identifiable, and uninvolved areas may not be routinely sampled. Furthermore, variable microscopic features of disease activity can often be found in specimens sampled from endoscopically uninvolved areas. Thus, the concern about the degree of inflammation in a biopsy does not seem to be a major concern in performing Paneth cell phenotype analysis.
Another important issue of developing Paneth cell phenotypes as a prognostic biomarker is whether therapy alters the Paneth cell phenotype of a given patient and can be used as a surrogate marker for biologic efficacy for therapies. The patients who underwent multiple resections in this study had been treated with various therapeutic agents and followed over a long period (longest 17 yr), suggesting that medical therapies do not significantly impact the Paneth cell phenotype in vivo.
One critical finding in our previous analysis using resection specimens is that the presence of bad Paneth cells occurred in an irregular distribution, with regions of crypts showing normal Paneth cells interspersed with clusters of crypts with abnormal Paneth cells.9 The patchy distribution of these abnormal Paneth cells poses a challenge in analyzing biopsy material, and therefore, a series of virtual biopsy was necessary to determine the minimal number of crypts that generates equivalent results as resection specimens. We demonstrated through robust mathematical analysis that 40 crypts is the minimal number required in biopsy material for analysis. To account for any unforeseen technical limitations, we propose to use a minimum of 50 crypts that are well oriented and free of cautery artifact for Paneth cell analysis. Our experience with cases where either traditional or newer “jumbo” forceps are used for endoscopic biopsy with multiple bites taken per biopsy show that approximately 75% of the specimens meet this requirement. Of note, in our previous study, the incidence of the bad Paneth cell phenotype was 29%, whereas in the current study, the combined incidence of the cohorts included in the longitudinal study and the matched resection biopsy study was 18%. This is likely due to selection bias in the previous study, as patients with certain genotype(s) were selected.9
The ability of using biopsy material for determining Paneth cell phenotype has the potential for significantly enhancing aspects of CD research. To date, there are no robust, pathologically relevant parameters to stratify mild or new-onset CD cases for the risk of more severe disease in the future. Paneth cell phenotyping has the advantage of integrating genetic and environmental causative factors and pathologic hallmarks, thus representing a unique cellular biomarker. The ability to determine this biomarker on biopsies will enable rapid investigation of its utility in other areas of CD beyond its apparent ability to stratify patients on postoperative recurrence. Furthermore, as therapies are developed that target the NOD2/ATG16L1 autophagy pathways,14,15 Paneth cell phenotype can be rapidly used to determine in which individuals these pathways may be relevant, thereby significantly reducing the number of patients potentially needed for clinical trials. This may greatly reduce the time and cost of bringing new agents to clinical use as well, potentially avoiding therapies in those least likely to respond.
In summary, we demonstrated that Paneth cell phenotypes are not affected either by disease activity or by exposure to therapeutic agents, which is important in the evaluation of this biomarker for future studies. We have also demonstrated that mucosal biopsy specimens are feasible for Paneth cell analysis and propose using biopsy samples containing at least 50 well-oriented crypts that are free of cautery artifact for clinical and translational investigations. Our findings will enable the future assessment of this promising assay for large-scale prospective clinical studies.
Supplementary Material
Acknowledgments
The research was funded by The Helmsley Charitable Trust, a Washington University Institute of Clinical and Translational Sciences Pilot Award (CTSA308) and the CCFA Genetics Initiative. Research at Cedars-Sinai is supported by USPHS grant PO1DK046763 and the Cedars-Sinai F. Widjaja Foundation Inflammatory Bowel and Immunobiology Research Institute Research Funds. D. P. B. McGovern is supported by the European Union, the CCFA, the Joshua L. and Lisa Z. Greer Chair in IBD Genetics, and grants DK062413, DK046763-19, AI067068, AI084887, and HS021747.
Footnotes
Supplemental digital content is available for this article. Direct URL citations appear in the printed text and are provided in the HTML and PDF versions of this article on the journal’s Web site (www.ibdjournal.org).
The authors have no conflicts of interest to disclose.
Author contributions: Study concept and design, acquisition of data, analysis and interpretation of data, drafting of the manuscript: T.-C. Liu. Statistical analysis and drafting of the manuscript: F. Gao. Provided material, obtained funding, drafting of the manuscript: D. P. B. McGovern. Study concept and design, obtained funding, drafting of the manuscript: T. S. Stappenbeck.
References
- 1.Virgin HW, Todd JA. Metagenomics and personalized medicine. Cell. 2011;147:44–56. doi: 10.1016/j.cell.2011.09.009. [DOI] [PMC free article] [PubMed] [Google Scholar]
- 2.Levine B, Mizushima N, Virgin HW. Autophagy in immunity and inflammation. Nature. 2011;469:323–335. doi: 10.1038/nature09782. [DOI] [PMC free article] [PubMed] [Google Scholar]
- 3.Virgin HW, Levine B. Autophagy genes in immunity. Nat Immunol. 2009;10:461–470. doi: 10.1038/ni.1726. [DOI] [PMC free article] [PubMed] [Google Scholar]
- 4.Jostins L, Ripke S, Weersma RK, et al. Host-microbe interactions have shaped the genetic architecture of inflammatory bowel disease. Nature. 2012;491:119–124. doi: 10.1038/nature11582. [DOI] [PMC free article] [PubMed] [Google Scholar]
- 5.Meisch JP, Nishimura M, Vogel RM, et al. Human beta-defensin 3 peptide is increased and redistributed in Crohn’s ileitis. Inflamm Bowel Dis. 2013;19:942–953. doi: 10.1097/MIB.0b013e318280b11a. [DOI] [PMC free article] [PubMed] [Google Scholar]
- 6.Gunther C, Martini E, Wittkopf N, et al. Caspase-8 regulates TNF-alpha-induced epithelial necroptosis and terminal ileitis. Nature. 2011;477:335–339. doi: 10.1038/nature10400. [DOI] [PMC free article] [PubMed] [Google Scholar]
- 7.Cadwell K, Liu JY, Brown SL, et al. A key role for autophagy and the autophagy gene Atg16l1 in mouse and human intestinal Paneth cells. Nature. 2008;456:259–263. doi: 10.1038/nature07416. [DOI] [PMC free article] [PubMed] [Google Scholar]
- 8.Cadwell K, Patel KK, Maloney NS, et al. Virus-plus-susceptibility gene interaction determines Crohn’s disease gene Atg16L1 phenotypes in intestine. Cell. 2010;141:1135–1145. doi: 10.1016/j.cell.2010.05.009. [DOI] [PMC free article] [PubMed] [Google Scholar]
- 9.VanDussen KL, Liu TC, Li D, et al. Genetic variants synthesize to produce Paneth cell phenotypes that define subtypes of Crohn’s disease. Gastroenterology. 2014;146:200–209. doi: 10.1053/j.gastro.2013.09.048. [DOI] [PMC free article] [PubMed] [Google Scholar]
- 10.Baldassano RN, Bradfield JP, Monos DS, et al. Association of the T300A non-synonymous variant of the ATG16L1 gene with susceptibility to paediatric Crohn’s disease. Gut. 2007;56:1171–1173. doi: 10.1136/gut.2007.122747. [DOI] [PMC free article] [PubMed] [Google Scholar]
- 11.Hampe J, Cuthbert A, Croucher PJ, et al. Association between insertion mutation in NOD2 gene and Crohn’s disease in German and British populations. Lancet. 2001;357:1925–1928. doi: 10.1016/S0140-6736(00)05063-7. [DOI] [PubMed] [Google Scholar]
- 12.Hugot JP, Chamaillard M, Zouali H, et al. Association of NOD2 leucine-rich repeat variants with susceptibility to Crohn’s disease. Nature. 2001;411:599–603. doi: 10.1038/35079107. [DOI] [PubMed] [Google Scholar]
- 13.Ogura Y, Bonen DK, Inohara N, et al. A frameshift mutation in NOD2 associated with susceptibility to Crohn’s disease. Nature. 2001;411:603–606. doi: 10.1038/35079114. [DOI] [PubMed] [Google Scholar]
- 14.Homer CR, Richmond AL, Rebert NA, et al. ATG16L1 and NOD2 interact in an autophagy-dependent antibacterial pathway implicated in Crohn’s disease pathogenesis. Gastroenterology. 2010;139:1630–1641. 1641 e1631–1632. doi: 10.1053/j.gastro.2010.07.006. [DOI] [PMC free article] [PubMed] [Google Scholar]
- 15.Rickard DJ, Sehon CA, Kasparcova V, et al. Identification of benzimidazole diamides as selective inhibitors of the nucleotide-binding oligomerization domain 2 (NOD2) signaling pathway. PLoS One. 2013;8:e69619. doi: 10.1371/journal.pone.0069619. [DOI] [PMC free article] [PubMed] [Google Scholar]
Associated Data
This section collects any data citations, data availability statements, or supplementary materials included in this article.