

Abstract
Ionising radiation is a pleiotropic stress agent that may induce a variety of adverse effects. Molecular biomarker approaches possess promise to assess radiation exposure, however, the pleiotropic nature of ionising radiation induced transcriptional responses and the historically poor inter-laboratory performance of omics-derived biomarkers serve as barriers to identification of unequivocal biomarker sets. Here, we present a whole-genome survey of the murine transcriptomic response to physiologically relevant radiation doses, 2 Gy and 8 Gy. We used this dataset with the Random Forest algorithm to correctly classify independently generated data and to identify putative metabolite biomarkers for radiation exposure.
Keywords: ionising radiation exposure, radiation response biomarkers, murine blood transcriptome, reporter metabolites, inter-laboratory omics variation, random forests
1 Introduction
Ionising radiation is a multi-faceted stress agent that can induce a variety of adverse effects in organisms over a wide dose range (Hyduke et al., 2009). An important target for radiation is cellular DNA. Damage to DNA can lead to genomic instability and carcinogenesis or, in the case of high dose exposure, organ failure (Loft and Poulsen, 1996; Hall and Angele, 1999; Mothersill et al., 2005). Mitotically active cells are particularly sensitive to radiation exposure (Hall and Giaccia, 2006). Both genotoxic stress as well as damage to other cellular targets, such as membranes, can trigger a variety of signalling pathways (Hyduke et al., 2009). Also, in a phenomenon termed the ‘bystander effect’, radiation-exposed cells are known to release factors that induce a stress-response in unexposed cells (Lorimore and Wright, 2003; Ghandhi et al., 2008; Hei et al., 2008). In addition to direct damage, circulating White Blood Cells (WBCs) will be exposed to stress signals expressed by damaged cells (Paul and Amundson, 2008), thus allowing the WBCs to serve as systemic monitors of stress.
As ionising radiation is pleiotropic, it is difficult to identify unequivocal biomarkers for radiation exposure (Amundson et al., 2003, 2005, 2008). Radiation exposure may induce a variety of responses, including, inflammation (Lorimore and Wright, 2003), oxidative stress (Riley, 1994), the unfolded protein response (Cook et al., 2006), apoptosis and genomic instability (Laiakis and Morgan, 2005). Identifying molecular biomarkers to assess the presence of a pathology is a topic that has received much attention, notably in cancer research as well as in radiation biodosimetry (Ramaswamy et al., 2001; Tibshirani et al., 2002; Ressom et al., 2008).
Whole-genome transcriptome measurements provide a systems-level view of a stress response, however, whole-genome analyses are not practical for rapid diagnostic purposes. For example, to rapidly screen a population after a radiological event, field devices will likely be limited to a few 10 s or 100 s of genes. To identify candidate molecular markers for radiation exposure, researchers have explored the transcriptional response to radiation using WBC (Amundson et al., 2004; Dressman et al., 2007; Paul and Amundson, 2008). Specifically, a 74-gene set was developed that could distinguish unirradiated human WBC from ex vivo-irradiated WBC and discriminate according to dose at biologically relevant doses, 0.5 Gy to 8 Gy (Paul and Amundson, 2008). These studies have illustrated the potential of the WBC transcriptome as a source of radiation biomarkers, however, the initial studies focused on ex vivo radiation exposure or on a subset of the transcriptome and may have overlooked key biomarkers. Development of effective in vivo biodosimetry requires animal models due to limited dose range data available for human exposure.
A common criticism of biomarker studies is the substantial impact of inter-laboratory variation on transcriptome-derived signatures; oftentimes, a classifier works well within a study but exhibits decayed performance when applied to independently generated data (Shi et al., 2006). The inter-laboratory variation in gene expression signatures often arises from differences in sample preparation and transcriptomics technology (Shi et al., 2006). To overcome the difficulties associated with confounding factors, a variety of machine-learning algorithms have been employed to identify robust gene expression signatures for a variety of pathologies. These methods include support vector machines (Song and Rajasekaran, 2010), decision trees (Evans et al., 2010), boosting (Dettling and Buhlmann, 2003), bagging (Dinnis et al., 2006) and Random Forests (Brieman, 2001).
The Random Forests algorithm (Brieman, 2001) is gaining popularity (Strobl et al., 2008; Lanz et al., 2009; Heitner et al., 2010) in the field of biomarker identification for a number of reasons:
it is not biased toward strongly expressed genes
it is easily applied to multi-category data
it is applicable for quantitative predictions
it provides internal estimates of error and variable importance
it is freely available.
Here, we present a whole-genome dataset of the murine blood transcriptional responses to in vivo ionising irradiation and use the Random Forests algorithm to create a radiation exposure classifier. When we use the Random Forests algorithm to assess the radiation exposure of independently generated data, all samples were correctly classified by dose. In addition, we show how transcriptome data can be used with a network model of metabolism to predict putative biomarker metabolites indicative of radiation exposure that may provide insight into underlying mechanisms.
2 Methods
2.1 Murine γ-ray blood transcriptome
Male C57BL/6N mice, 8–12 wks old, were obtained from Charles River Laboratories, Inc. (Wilmington, MA). Mice were housed at Georgetown University under standard 12 h light and 12 h dark cycle conditions and given water and regular rodent chow ad libitum. All experimental procedures and animal handling were in accordance with animal protocols approved by the Georgetown University Animal Care and Use Committee. γ-irradiation of mice (2 Gy and 8 Gy) and sham-treatment of controls (0 Gy) were conducted with a Cesium-137 source in a pie cage and in accordance with Georgetown University policy.
Mice were euthanised 6 h post-exposure and blood samples were collected by cardiac puncture. RNA was purified using PreAnalytiX’s PAXgene blood RNA system (Qiagen, Valencia, CA) or Ambion’s Mouse RiboPure-Blood RNA isolation kit (Applied Biosystems, Carslbad, CA). Total RNA quality was assessed with Agilent’s (Carlsbad, CA) RNA 6000 Nano Kit and Bioanalyser 2100. Globin RNA was removed with Ambion’s Globinclear Mouse/Rat kit (Applied Biosystems). Cy3-labelled cRNA was generated from 400 ng total RNA using Agilent’s QuickAMP kit. Cy3-labelled cRNA (1.65 μg) was hybridised to Agilent’s Mouse Whole Genome arrays (G4122F) with Agilent’s GEx Hybridisation HI-RPM Buffer. The samples were hybridised for 16 h in a rotisserie hybridisation oven (G2545A, Agilent), then the arrays were washed with Agilent’s gene expression wash buffers and scanned with an Agilent DNA Microarray Scanner 2505A in an ozone hood. Quantitative reverse-transcriptase polymerase chain reaction (qRT-PCR) was performed with an iCycler and iScript onestep RT-PCR kit (Bio-Rad, Hercules, CA); measurements were normalised to GADPH expression. RT-PCR primer sets (Supporting Information Table 1) were selected from PrimerBank (ISG20L1) or RTPrimerDB (BAX, CDKN1A, GADPH) and purchased from Operon Biotechnologies, Inc. (Huntsville, AL).
2.2 Data analysis
Microarray Processing. Image analysis and intra-chip normalisation were performed with Feature Extraction 9.5.3.1 (Agilent). Unless otherwise noted, subsequent analyses were performed with the R statistical analysis framework (Team, 2010) and associated packages (Reimers and Carey, 2006). Probes that had intensity readings of at least 50 counts (as assessed by Feature Extraction) in over 20% of the test samples (for at least one dose) and 20% of the control samples were retained for analysis. To account for inter-chip variation, quantile normalisation was performed on the retained probes using the R bioconductor limma package (Reimers and Carey, 2006). Data were filtered based on a significant (p < 0.05 t-test with Benjamini–Hochberg correction) (Benjamini and Hochberg, 1995) 2-fold change versus control samples. Then, a classifier was constructed using the Random Forests algorithm (Brieman, 2001) as implemented in the R package random Forest (Liaw and Wiener, 2002) for the three exposure doses (0, 2 and 8 Gy).
To identify a subset of features that facilitate dose-dependent classification while maintaining accuracy, we selected the 50 most important genes. The Random Forest package provides an approach to calculate the relative importance of features in a classifier: To calculate the importance of a gene, the gene’s expression value was replaced with a value randomly chosen from the dataset and the cross-validation performance was assessed; if a significant decay in performance occurred, then the gene was important for solving the classification problem.
Test set comparison
To determine if we could develop a classifier that was robust to inter-laboratory variation, we constructed a Random Forests classifier from our data and used it to classify 21 samples from Dressman et al. (2007), hereafter referred to as the test set. We downloaded the Dressman et al. data from GEO (GEO Accession ID: GSE6873) and then removed genes from our data that were not present in the test set leaving 11,822 unique genes. We did not use statistics from the test set to filter any of the genes. After selecting for genes with strong (>50 counts in 20% of the samples) signals and significant (p < 0.05 t-test with Benjamini–Hochberg correction) 2-fold perturbations, we used the Random Forests algorithm to construct a classifier comprised of 50 genes, which was then used to classify the test set data.
Reporter metabolite analysis
To create a draft murine metabolic network model, we downloaded the current version of the human metabolic network reconstruction (Duarte et al., 2007) from the BiGG database (Schellenberger et al., 2010). We then used Homologene (Wheeler et al., 2003) build 64 to map the enzymatic reactions from the human network to mouse genes; this draft murine metabolic network model was then used to identify reporter metabolites. The murine metabolic network model contains 3742 biochemical reactions of which 2273 are catalysed by 1401 gene products; 1355 genes were present on the arrays and used for the reporter metabolite calculations.
Reporter metabolite calculations were performed with the COBRA for Python package (http://opencobra.sourceforge.net) using SciPy’s (http://www.scipy.org) statistical modules, according to Patil and Nielsen (2005). In short, the metabolic network was represented as a bipartate graph where the nodes were the metabolites, genes and edges. From the transcriptome data, for each gene a p-value was calculated with Student’s t-test and converted into a Z-score using the inverse normal cumulative distribution. Then, based on metabolic network topology, a size-independent aggregate Z-score (Whitlock, 2005) was calculated for each metabolite from the Z-scores of the surrounding genes. The metabolite Z-scores were then background corrected and metabolites were ranked by Z-score – the larger the Z-score the more activity associated with the metabolite.
3 Results
3.1 Reference mouse blood radiation-response transcriptome dataset
Here, we present a whole-genome dataset of the murine blood transcriptomic response to γ-rays. The final dataset is comprised of 18 samples collected 6 h after whole-body radiation exposure (NCBI GEO Accession GSE33172). For biodosimetry after a radiologic event (DiCarlo et al., 2010), the dose range of interest is 1 Gy to 8 Gy. In our study, we used 2 Gy, a dose not associated with acute mortality, and 8 Gy, which will cause mortality in 50% or more of mice within several weeks (Green, 1966). These doses and times, also, enabled the comparison of our results with other data from mouse and human studies (Dressman et al., 2007; Paul and Amundson, 2008).
In this study, we use the dataset to assess the ability of the Random Forests algorithm to construct a radiation exposure signature that is robust to interlaboratory variation and we identify putative reporter metabolites (Patil and Nielsen, 2005) that are associated with significant transcriptional perturbations. Reporter metabolites are metabolites that are associated with a large number of transcriptional perturbations and could thus serve as biomarkers. This dataset could be used as a baseline to delineate radiation-response mechanisms using transcriptome measurements from genetically engineered mouse models.
When we explored the transcriptional perturbations of the murine homologs for a set of genes from an ex vivo human radiation response classifier, we found that the majority of the significantly perturbed (p < 0.05 t-test with Benjamini–Hochberg correction) (Benjamini and Hochberg, 1995) mouse genes were in the same direction as the human homologs and some exhibited a graded response (Figure 1(A)). Differences in radiation sensitivity between the human classifier and our murine dataset may be due to different radiation responses inherent in mice and humans or due to experimental configuration. The classifier from Paul and Amundson was derived from ex vivo irradiated blood, thus the WBCs were not exposed to internal stress signals that would be detected by circulating WBCs. Additionally, the classifier for the Paul and Amundson set consisted of control/treatment sets comprised of blood from an individual donor, whereas each sample in our study came from an individual mouse and, when assessing fold-change, was compared with the median of the control group.
Figure 1.
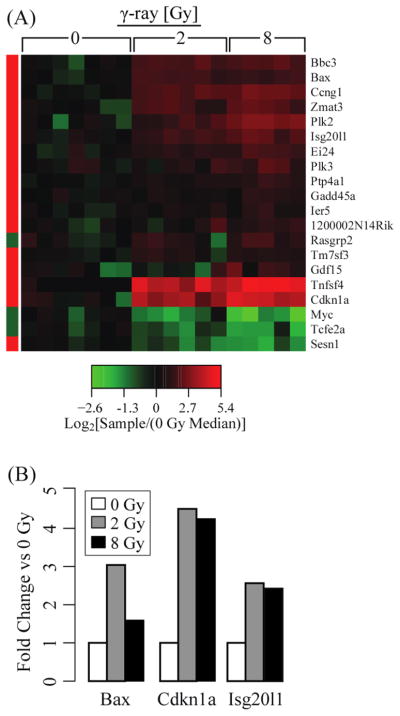
Assessment of the murine transcriptional response to γ-rays in the context of radiation responsive genes identified in an ex vivo human study (Paul and Amundson, 2008). (A) Heatmap of the murine homologs for the genes in the radiation response classifier constructed by Paul and Amundson. The left-side bar indicates the direction of transcriptional perturbation by ionising radiation in the human dataset (green: down-regulated, red: up-regulated). The majority of the murine homologs are perturbed in the same direction as the human genes by ionising radiation exposure. (B) qRT-PCR measurements of select radiation-responsive genes (Bax, Cdkn1a, Isg20l1) normalised to GADPH from three of the samples (0, 2 and 8Gy) (see online version for colours)
Quantitative RT-PCR was performed to verify that radiation increased the expression of Bax, Cdkn1a and Isg20l1 (Figure 1(B)). These genes and others in the set of significantly perturbed genes (p < 0.05 Benjamini–Hochberg correction) are associated with the tumour suppressor p53 (Chipuk et al., 2004; Lohr et al., 2003; Eby et al., 2010). When we compared our set of significantly perturbed genes to a set of murine genes previously shown to be upregulated by p53 in response to ionising radiation in spleen and thymus (Burns and El-Deiry, 2003), there was sizable qualitative concordance (Supporting Information Figure 1). The qualitative similarities across tissues highlight the potential for using our data with genetically modified mouse strains to explore the aetiology of the radiation response.
3.2 Construction and assessment of a robust radiation response classifier
We were interested in determining if we could identify a set of 50 genes that could be used to accurately classify samples by radiation exposure. We used the Random Forests algorithm to construct a classifier from the 1318 genes that were significantly (p < 0.05 Benjamini–Hochberg correction) perturbed 2-fold or more (vs. the median of the control set) in at least 20% of our samples. The genes were selected using the Random Forests importance metric, which calculates the change in performance when the specific gene is not used on the classifier. The Random Forests classifier created with the 50 most important genes was 100% accurate in self-classification (Figure 2(A)); the power of a Random Forests classifier is evident in the strong separation of the control and two treatment doses. Regardless, of whether we built the classifier using all perturbed or only the up-regulated genes (2-fold perturbation; p < 0.05), the classifier was 100% accurate at self-validation. The Random Forest algorithm estimates errors internally based on the average of the accuracies of each tree in the forest (Brieman, 2001). Each tree is calculated with a different bootstrap sample that does not include all of the original data then accuracy is assessed by comparing the predictions for the unused data with their actual classes.
Figure 2.

Analysis of the classifier. (A) Multi-dimensional-scaling plot of the control (0 Gy) and γ-irradiated (2 and 8 Gy) samples using the 50 most important genes as determined by Random Forests illustrates a strong separation of the control and two treatment groups. (B) Heatmap of radiation-responsive transcriptional perturbations, relative to the median of the control group, for the 50 most important genes as determined by Random Forests. (C) Heatmap of radiation-responsive transcriptional perturbations, relative to the median of the control group, for the 50 most important up-regulated genes as determined by Random Forests (see online version for colours)
It is important to note that we constructed the classifier with normalised gene expression values, not gene expression ratios. Using expression levels simplifies the selection of candidate biomarker genes based on absolute expression. When selecting biomarker genes for a field deployable device, it may be prudent to focus on genes that are positively and strongly perturbed by radiation.
The 50 most important (Supporting Information Table 2), as determined by the Random Forests approach, overall and up-regulated genes exhibited a dose-dependent response (Figure 2(B)–(C)), indicating that their relative expression levels may serve to identify exposure dose. In the up-regulated gene list, there are known stress responsive genes that function in apoptosis, cell survival signalling and oxidative stress, such as Fas, Plk2, Trp53inp1, GTSE and Gadd45b (Mizuno et al., 2003; Liu and Erikson, 2003; Tomasini et al., 2005; Brown et al., 2007; Yoo et al., 2003). Interestingly, there is a number (>20) of strongly down-regulated (<30-fold vs. median of control groups) genes in the classifier (Figure 2(B)). These down-regulated genes had no obvious involvement in known radiation response mechanisms, which could mean that they are components of uncharacterised stress-responses or tertiary perturbations that provide good discriminating power but do not link directly back to the core stress-response pathways.
One issue that plagues the field of molecular biomarker research is over-fitting to the training dataset (Kim et al., 2002; Shi et al., 2006). Over-fitting means that the classifier would be highly successful in classifying the original dataset, or in a leave one out cross-validation study, but exhibit decreased performance with an independently generated dataset. Over-fitting may arise from outlier elimination or a sample preparation artifact. To minimise the introduction of an artifact during sample preparation, each γ-ray exposure dose group consisted of mice that were treated on separate dates and each Agilent 4 × 44 slide was hybridised with samples from at least two distinct dose groups.
Over-fitting of the classifier to laboratory conditions would severely reduce the value of the classifier in less controlled conditions. For example, in the case of a radiological event, the samples collected during triage are not likely to be acquired in the exact same fashion as each other, and the preparation method is likely to be substantially different than that employed in the controlled laboratory environment used to develop the assay. Because of the non-uniformity in sample collection and preparation, it is essential for a radiation response classifier to maintain a high accuracy in spite of sizable differences in sample collection and processing protocols. Successful classification of an independently generated dataset by our approach would serve to illustrate the robustness of the Random Forests method.
To ascertain whether our classifier was over-fit to our dataset and to assess the robustness of our feature selection procedure, we sought an independently generated transcriptome dataset to test our classifier. Dressman et al. (2007) have recently published a survey of the mouse blood transcriptome response to γ-rays. Dressmen et al. exposed mice to various levels of γ-rays and performed transcriptome analysis on mononuclear cells (MNC) purified from whole blood using a dual-channel labelling strategy: Cy3 for universal mouse reference RNA from Stratagene (Agilent, Carlsbad, CA), and Cy5 for sample RNA.
Crucial differences between our study and Dressman et al. include the following:
different microarray technologies (Agilent inkjet oligomers vs. spotted Operon oligomer arrays in Dressman et al.)
some different radiation doses were employed
blood collection protocol (cardiac puncture and whole blood vs. ocular bleed and MNCs isolated via Ficoll Hypaque centrifugation by Dressman et al.)
different protocols for purifying, labelling (1-channel vs. 2-channel in Dressman et al.) and hybridising the mRNA were followed.
The presence of these potential confounding factors made the Dressman et al. dataset an ideal candidate for assessing the robustness of our method to inter-laboratory variation. Hereafter, our dataset is referred to as the training set and the dataset from Dressman et al. is referred to as the test set.
From the test set, we extracted the raw intensity values for the doses (0, 2 and 10 Gy) that were most similar to our training set doses (0, 2 and 8 Gy). After removing features from our training set that were not present in the raw test set data, there were 11,822 unique genes. The test set contained 12,651 unique transcripts meaning that our training set covered over 93% of the test set genes. It is crucial to note that we did not consider the significance levels or fold changes of genes in the test set for this comparison. If we had focused on only the genes that were significantly perturbed in both the training set and the test set, then we would bias our classifier toward genes significantly perturbed in the test set. Next, we performed quantile normalisation (Ballman et al., 2004) across the combined training and test sets. The test set was not used during classifier construction; it was only used to assess the classifier’s predictive accuracy.
Next, we selected genes that were significantly (p < 0.05 t-test with Benjamini–Hochberg correction) perturbed at least 2-fold vs. the control in our training set; there were 1083 genes in our training set meeting these criteria. We then devised a 50 gene classifier using the Random Forests algorithm (Supporting Information Table 3).
The robustness of the classifier to inter-laboratory variation was then assessed by comparing the predictions for the test set with their actual radiation exposure levels. Surprisingly, there were misclassifications when comparing predicted exposure levels versus the actual exposure levels (Table 1). Taken together with the different methodologies used to acquire the data, this indicates that the Random Forests algorithm is capable of constructing robust classifiers that function in the face of sizable sample preparation differences and are not over-fit to the training data.
Table 1.
Random Forests classifier prediction of test set γ-ray exposure. Training set doses were 0, 2, and 8 Gy, whereas test set doses were 0, 2, and 10 Gy. A classification was considered a true positive if the predicted dose was the closest match to the actual delivered dose. All independent test samples were correctly classified by dose
| Prediction (Gy) | |||
|---|---|---|---|
| γ-ray (Gy) | 0 | 2 | 8 |
| 0 | 7 | 0 | 0 |
| 2 | 0 | 7 | 0 |
| 10 | 0 | 0 | 7 |
3.3 Analysis of radiation response in the context of a genome-scale murine metabolic network
Even though a classifier may be excellent at identifying the presence of a disease, such as cancer, or a perturbation, such as radiation exposure, the features in a classifier may provide little or no biological insight into the mechanisms. In the case of Random Forests, and a variety of other machine learning algorithms, the algorithm is blind to the biochemical network in which the genes are involved and will only strive to select genes that provide the greatest discriminating power across classes; these genes may be the result of tertiary perturbations that are not easily related to the underlying mechanism of interest.
One approach for gaining insight into the mechanisms underlying a transcriptomic response is to analyse the data in the context of a genome-scale metabolic network reconstruction (Duarte et al., 2007; Lewis et al., 2009). Genome-scale network reconstructions may be converted to mathematical models to visually or computationally analyse transcriptome data (Lewis et al., 2009). The most common visualisation methods involve simply overlaying the expression data on the pathways within the model and visually determining what sections of the network are associated with negative or positive changes in gene expression. Visual inspection of genome-scale network models is limited by the fact that the networks are typically too large to visually inspect in toto and a number of subtle effects will not be obvious from the genome-scale. Computational methods have been devised that take advantage of network structure to identify patterns in omics datasets (Patil and Nielsen, 2005; Cakir et al., 2006; Oliveira et al., 2008). These methods are often used to identify elements or regions of the larger network that are associated with a larger than average number of transcriptional perturbations, under the assumption that intense transcriptional activity associated with genes for a portion of a metabolic network, or pathway, would indicate that the pathway is being perturbed.
To determine if there were any metabolic processes that may be highly sensitive to radiation, we applied the reporter metabolites (Patil and Nielsen, 2005) algorithm to a genome-scale model of murine metabolism. The murine metabolic network model was derived from a human network reconstruction (Duarte et al., 2007) using homologene (Wheeler et al., 2003) to map the human enzymatic reactions to murine enzymes. Of the 1805 genes in the human model, there were murine homologs for 1401 genes. The reporter metabolites algorithm uses a biochemical network’s structure to determine which metabolites are associated with a large number of statistically significant transcriptional perturbations. A metabolite that is a substrate for many gene products whose genes are weakly yet significantly perturbed will have a higher score than a metabolite that is associated with a single strongly perturbed gene. The Z-score for each metabolite is calculated by aggregating the Z-scores for all gene products that use the metabolite as a substrate. The larger the aggregated Z-score for a metabolite, the more attractive it is as a putative metabolite biomarker.
A number of metabolites from the murine metabolic network with aggregate Z-scores > 2 (Figure 3) are known to be perturbed by radiation exposure in a number of mammals (Koenig et al., 2005; Kandasamy and Hunt, 1990; Dale et al., 1949; Tyburski et al., 2008, 2009). Interestingly, bicarbonate (HCO3), which may possess potential as a radionuclide eliminator (Koenig et al., 2005), had a large Z-score (4.2 for 2 Gy and 3.5 for 8 Gy). Histamine was the highest scoring compound for 8 Gy (Z-score = 6.9), and along with prostaglandin H2 (Z-score = 2.9), is known to be produced after exposure to ionising radiation in rats (Kandasamy et al., 1988; Kandasamy and Hunt, 1990). Metabolites (ornithine, urea, ammonia, GDP, xanthine) associated with deamination of amino acids and nucleotides were also associated with significant transcriptional activity (Z-score > 2). γ-rays are known to induce deamination of amino acids (Dale et al., 1949) and metabolites associated with nucleotide deamination have recently been proposed as radiation exposure biomarkers based on murine urine metabolomics measurements (Tyburski et al., 2009).
Figure 3.
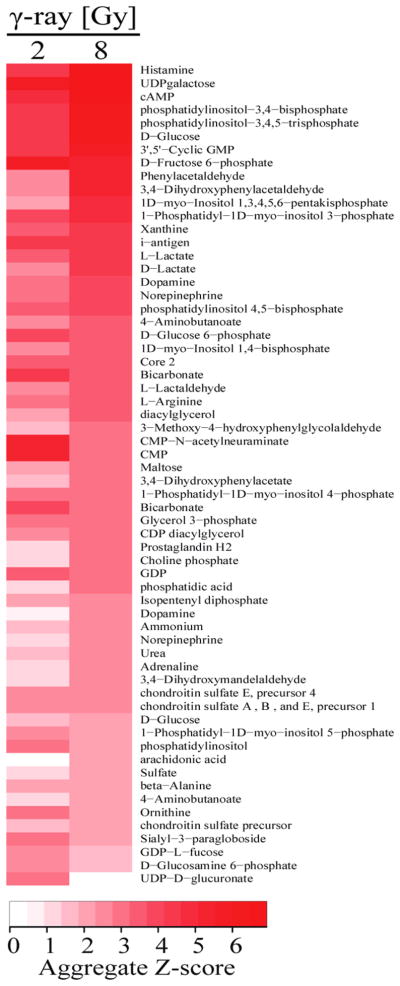
Heatmap of the aggregate Z-scores for putative reporter metabolites associated with transcriptional perturbations in the murine metabolic network following γ-ray exposure (2 Gy and 8 Gy). P-values were calculated for each gene in the treatment groups vs. the control group using Student’s t-test and the Benjamini–Hochberg correction for multiple hypotheses testing. The p-values were converted to Z-scores using the inverse normal cumulative distribution, and aggregate Z-scores for the metabolites were calculated from the Z-scores of all genes whose gene products employed the metabolite as a substrate. Promiscuous metabolites, such as the hydrogen ion, phosphate ion and water, were excluded from analysis (see online version for colours)
4 Discussion
Here, we present an in vivo whole-genome dataset of the murine blood-transcriptome response to ionising radiation. Genes in the mouse dataset show a similar response to homologous radiation-responsive genes from an ex vivo human study (Figure 1(A)) indicating that a mouse model may be useful in extrapolating to a human radiation response. However, the different directions in some of the perturbations (vs. the human) indicate that there may be differences arising from the experiment configuration (in vivo vs. ex vivo) or species-specific biology. From this dataset, we devised a classifier that illustrated that it is possible to discriminate radiation exposure, in a dose-dependent fashion, 6 h post-radiation exposure. The method that we used to develop the radiation response signature from our dataset was able to successfully classify the radiation exposure levels of independently generated mouse blood transcriptome data (Table 1), even though there were notable collection and processing differences for the independent dataset compared with our study. We then analysed the transcriptome data in the context of a genome-scale murine metabolic network model and identified a set of putative reporter metabolites for radiation exposure (Figure 3). A number of these metabolites (ammonia, GDP, xanthine) were detected in a urine metabolomics study of the mouse radiation response (Tyburski et al., 2008, 2009). Overall, our work provides a whole-genome reference dataset and presents a robust mRNA-based radiation-exposure classifier from mouse whole blood and identifies candidate metabolite biomarkers for radiation exposure.
Supplementary Material
Acknowledgments
DRH was supported, in part, by Grant Number T32 CA009078 from the NCI. This work was funded, in part, by the National Institutes of Health (National Institute of Allergy and Infectious Diseases) grant 5U19AI067773 to AJF and performed as part of the Columbia University Center for Medical Counter measures against Radiation.
Biographies
Daniel R. Hyduke received his PhD under the guidance of James C. Liao at the University of California – Los Angeles, where he studied nitric oxide signal transduction in the circulatory system and uncovered a mechanism through which nitric oxide inhibits bacterial growth. He subsequently embarked on a postdoctoral fellowship in the stress-signalling laboratory of Albert J. Fornace Jr. at the Harvard School of Public Health, where he used transcriptomics technologies to interpret stress responses in mammalian systems. Currently, he is at the University of California-San Diego, USA, where he is investigating the molecular programs through which enteropathogens manipulate their hosts.
Evagelia C. Laiakis received her PhD in Human Genetics from the University of Maryland, Baltimore under the mentorship of William F. Morgan, PhD, DSc. Her graduate work concentrated on the inflammatory responses initiating and perpetuating radiation-induced genomic instability. She subsequently joined the laboratory of Albert J. Fornace Jr., MD as a post-doctoral fellow. The focus of her research has been metabolomics with the primary interest lying in the development of radiation metabolomic signatures in various species, including the human population. Parallel work involves biomarker identification in biofluids for cancer progression and staging and infectious diseases.
Heng-Hong Li received her PhD in Environmental Toxicology at the University of California – Riverside, where she studied signal transduction of pathways associated with the tumour suppressor p53 and p53-dependent transcriptional regulation. She was a post-doctoral fellow in Albert J. Fornace’s laboratory at Harvard School of Public Health. Currently, she is a Research Assistant Professor at Georgetown University Medical Center. Her major research focus is on developing omics-guided methods to survey the systems-level effects of ionising radiation and subsequently elucidating the underlying molecular mechanisms with genetic approaches. She also has substantial experience in functional genomics, molecular biology and bioinformatics and has carried out a variety of studies in stress signalling and molecular toxicology.
Albert J. Fornace Jr. MD is a Professor at Georgetown University and holds the Molecular Cancer Research Chair at the Lombardi Comprehensive Cancer Center. Previously, he was Director of the John B. Little for the Radiation Sciences and Environmental Health at Harvard and earlier led the Gene Response Section at NCI. He is an internationally recognised expert in stress-signalling mechanisms and is in the top 0.5% of cited authors in the life sciences (http://ISIHighlyCited.com). Fornace has pioneered the use of transcriptomics and more recently metabolomics approaches for stress signalling applications with relevance to molecular toxicology and radiobiology.
Contributor Information
Daniel R. Hyduke, Email: hyduke@ucsd.edu, Department of Biochemistry and Molecular and Cellular Biology, and Lombardi Comprehensive Cancer Center, Georgetown University Medical Center, Washington, DC 20057, USA and John B. Little Center for the Radiation Sciences and Environmental Health, Harvard School of Public Health, Boston, MA 02115, USA and Department of Bioengineering, University of California, San Diego, La Jolla, CA 92093, USA
Evagelia C. Laiakis, Email: ecl28@georgetown.edu, Department of Biochemistry and Molecular and Cellular Biology, and Lombardi Comprehensive Cancer Center, Georgetown University Medical Center, Washington, DC 20057, USA
Heng-Hong Li, Email: hl234@georgetown.edu, Department of Biochemistry and Molecular and Cellular Biology, and Lombardi Comprehensive Cancer Center, Georgetown University Medical Center, Washington, DC 20057, USA and John B. Little Center for the Radiation Sciences and Environmental Health, Harvard School of Public Health, Boston, MA 02115, USA.
Albert J. Fornace, Jr., Email: af294@georgetown.edu, Department of Biochemistry and Molecular and Cellular Biology, and Lombardi Comprehensive Cancer Center, Georgetown University Medical Center, Washington, DC 20057, USA and John B. Little Center for the Radiation Sciences and Environmental Health, Harvard School of Public Health, Boston, MA 02115, USA and Center of Excellence in Genomic Medicine Research (CEGMR), King Abdulaziz University, Jeddah, Saudi Arabia
References
- Amundson SA, Grace MB, McLeland CB, Epperly MW, Yeager A, Zhan Q, Greenberger JS, Fornace AJ., Jr Human in vivo radiation-induced biomarkers: gene expression changes in radiotherapy patients. Cancer Res. 2004;64:6368–6371. doi: 10.1158/0008-5472.CAN-04-1883. [DOI] [PubMed] [Google Scholar]
- Amundson SA, Do KT, Vinikoor L, Koch-Paiz CA, Bittner ML, Trent JM, Meltzer P, Fornace AJ., Jr Stress-specific signatures: expression profiling of p53 wild-type and -null human cells. Oncogene. 2005;24:4572–4579. doi: 10.1038/sj.onc.1208653. [DOI] [PubMed] [Google Scholar]
- Amundson SA, Do KT, Vinikoor LC, Lee RA, Koch-Paiz CA, Ahn J, Reimers M, Chen Y, Scudiero DA, Weinstein JN, Trent JM, Bittner ML, Meltzer PS, Fornace AJ., Jr Integrating global gene expression and radiation survival parameters across the 60 cell lines of the national cancer institute anticancer drug screen. Cancer Res. 2008;68:415–424. doi: 10.1158/0008-5472.CAN-07-2120. [DOI] [PubMed] [Google Scholar]
- Amundson SA, Bittner M, Fornace AJ., Jr Functional genomics as a window on radiation stress signaling. Oncogene. 2003;22:5828–5833. doi: 10.1038/sj.onc.1206681. [DOI] [PubMed] [Google Scholar]
- Ballman KV, Grill DE, Oberg AL, Therneau TM. Faster cyclic loess: normalizing RNA arrays via linear models. Bioinformatics. 2004;20:2778–2786. doi: 10.1093/bioinformatics/bth327. [DOI] [PubMed] [Google Scholar]
- Benjamini Y, Hochberg Y. Controlling the false discovery rate: a practical and powerful approach to multiple testing. Journal of the Royal Statistical Society. Series B (Methodological) 1995;57:289–300. [Google Scholar]
- Brieman L. Random forests. Machine Learning. 2001;45:5–32. [Google Scholar]
- Brown L, Boswell S, Raj L, Lee SW. Transcriptional targets of p53 that regulate cellular proliferation. Crit Rev Eukaryot Gene Expr. 2007;17:73–85. doi: 10.1615/critreveukargeneexpr.v17.i1.50. [DOI] [PubMed] [Google Scholar]
- Burns TF, El-Deiry WS. Microarray analysis of p53 target gene expression patterns in the spleen and thymus in response to ionizing radiation. Cancer Biol Ther. 2003;2:431–443. doi: 10.4161/cbt.2.4.478. [DOI] [PubMed] [Google Scholar]
- Cakir T, Patil KR, Onsan Z, Ulgen KO, Kirdar B, Nielsen J. Integration of metabolome data with metabolic networks reveals reporter reactions. Mol Syst Biol. 2006;2:50. doi: 10.1038/msb4100085. [DOI] [PMC free article] [PubMed] [Google Scholar]
- Chipuk JE, Kuwana T, Bouchier-Hayes L, Droin NM, Newmeyer DD, Schuler M, Green DR. Direct activation of Bax by p53 mediates mitochondrial membrane permeabilization and apoptosis. Science. 2004;303:1010–1014. doi: 10.1126/science.1092734. [DOI] [PubMed] [Google Scholar]
- Cook JA, Chuang EY, Tsai MH, Coffin D, Degraff W, Sowers AL, Mitchell JB. Radiation-induced changes in gene-expression profiles for the SCC VII tumor cells grown in vitro and in vivo. Antioxid Redox Signal. 2006;8:1263–1272. doi: 10.1089/ars.2006.8.1263. [DOI] [PubMed] [Google Scholar]
- Dale WM, Davies JV, Gilbert CW. The kinetics and specificities of deamination of nitrogenous compounds by X-radiation. Biochem J. 1949;45:93–99. doi: 10.1042/bj0450093. [DOI] [PMC free article] [PubMed] [Google Scholar]
- Dettling M, Buhlmann P. Boosting for tumor classification with gene expression data. Bioinformatics. 2003;19:1061–1069. doi: 10.1093/bioinformatics/btf867. [DOI] [PubMed] [Google Scholar]
- DiCarlo AL, Ramakrishnan N, Hatchett RJ. Radiation combined injury: overview of NIAID research. Health Phys. 2010;98:863–867. doi: 10.1097/HP.0b013e3181a6ee32. [DOI] [PMC free article] [PubMed] [Google Scholar]
- Dinnis DM, Stansfield SH, Schlatter S, Smales CM, Alete D, Birch JR, Racher AJ, Marshall CT, Nielsen LK, James DC. Functional proteomic analysis of GS-NS0 murine myeloma cell lines with varying recombinant monoclonal antibody production rate. Biotechnol Bioeng. 2006;94:830–841. doi: 10.1002/bit.20899. [DOI] [PubMed] [Google Scholar]
- Dressman HK, Muramoto GG, Chao NJ, Meadows S, Marshall D, Ginsburg GS, Nevins JR, Chute JP. Gene expression signatures that predict radiation exposure in mice and humans. PLoS Med. 2007;4:e106. doi: 10.1371/journal.pmed.0040106. [DOI] [PMC free article] [PubMed] [Google Scholar]
- Duarte NC, Becker SA, Jamshidi N, Thiele I, Mo ML, Vo TD, Srivas R, Palsson BO. Global reconstruction of the human metabolic network based on genomic and bibliomic data. Proc Natl Acad Sci USA. 2007;104:1777–1782. doi: 10.1073/pnas.0610772104. [DOI] [PMC free article] [PubMed] [Google Scholar]
- Eby KG, Rosenbluth JM, Mays DJ, Marshall CB, Barton CE, Sinha S, Johnson KN, Tang L, Pietenpol JA. ISG20L1 is a p53 family target gene that modulates genotoxic stress-induced autophagy. Mol Cancer. 2010;9:95. doi: 10.1186/1476-4598-9-95. [DOI] [PMC free article] [PubMed] [Google Scholar]
- Evans SE, Tuvim MJ, Zhang J, Larson DT, Garcia CD, Pro SM, Coombes KR, Dickey BF. Host lung gene expression patterns predict infectious etiology in a mouse model of pneumonia. Respir Res. 2010;11:101. doi: 10.1186/1465-9921-11-101. [DOI] [PMC free article] [PubMed] [Google Scholar]
- Ghandhi SA, Yaghoubian B, Amundson SA. Global gene expression analyses of bystander and alpha particle irradiated normal human lung fibroblasts: synchronous and differential responses. BMC Med Genomics. 2008;1:63. doi: 10.1186/1755-8794-1-63. [DOI] [PMC free article] [PubMed] [Google Scholar]
- Green EL. Biology of the Laboratory Mouse. Blakiston Division, McGraw-Hill; New York: 1966. [Google Scholar]
- Hall EJ, Giaccia AJ. Radiobiology for the Radiologist. Lippincott Williams and Wilkins; Philadelphia: 2006. [Google Scholar]
- Hall J, Angele S. Radiation, DNA damage and cancer. Mol Med Today. 1999;5:157–164. doi: 10.1016/s1357-4310(99)01435-5. [DOI] [PubMed] [Google Scholar]
- Hei TK, Zhou H, Ivanov VN, Hong M, Lieberman HB, Brenner DJ, Amundson SA, Geard CR. Mechanism of radiation-induced bystander effects: a unifying model. J Pharm Pharmacol. 2008;60:943–950. doi: 10.1211/jpp.60.8.0001. [DOI] [PMC free article] [PubMed] [Google Scholar]
- Heitner SB, Hollenberg SM, Colilla SA. Heat maps, random forests, and nearest neighbors: a peek into the new molecular diagnostic world. Crit Care Med. 2010;38:296–298. doi: 10.1097/CCM.0b013e3181c545ed. [DOI] [PubMed] [Google Scholar]
- Hyduke DR, Amundson SA, Fornace AJ., Jr Complexity of stress signaling and responses. Handbook of Cell Signaling. 2009;3:2107–2125. [Google Scholar]
- Kandasamy SB, Hunt WA. Involvement of prostaglandins and histamine in radiation-induced temperature responses in rats. Radiat Res. 1990;121:84–90. [PubMed] [Google Scholar]
- Kandasamy SB, Hunt WA, Mickley GA. Implication of prostaglandins and histamine H1 and H2 receptors in radiation-induced temperature responses of rats. Radiat Res. 1988;114:42–53. [PubMed] [Google Scholar]
- Kim S, Dougherty ER, Barrera J, Chen Y, Bittner ML, Trent JM. Strong feature sets from small samples. J Comput Biol. 2002;9:127–146. doi: 10.1089/10665270252833226. [DOI] [PubMed] [Google Scholar]
- Koenig KL, Goans RE, Hatchett RJ, Mettler FAJ, Schumacher TA, Noji EK, Jarrett DG. Medical treatment of radiological casualties: current concepts. Ann Emerg Med. 2005;45:643–652. doi: 10.1016/j.annemergmed.2005.01.020. [DOI] [PubMed] [Google Scholar]
- Laiakis EC, Morgan WF. Communicating the non-targeted effects of radiation from irradiated to non-irradiated cells. Acta Medica Nagasakiensia. 2005;50:79–84. [Google Scholar]
- Lanz C, Patterson AD, Slavik J, Krausz KW, Ledermann M, Gonzalez FJ, Idle JR. Radiation metabolomics. 3. Biomarker discovery in the urine of gamma-irradiated rats using a simplified metabolomics protocol of gas chromatography-mass spectrometry combined with random forests machine learning algorithm. Radiat Res. 2009;172:198–212. doi: 10.1667/RR1796.1. [DOI] [PMC free article] [PubMed] [Google Scholar]
- Lewis NE, Cho BK, Knight EM, Palsson BO. Gene expression profiling and the use of genome-scale in silico models of Escherichia coli for analysis: providing context for content. J Bacteriol. 2009;191:3437–3444. doi: 10.1128/JB.00034-09. [DOI] [PMC free article] [PubMed] [Google Scholar]
- Liaw A, Wiener M. Classification and regression by random forest. R News. 2002;2:18–22. [Google Scholar]
- Liu X, Erikson RL. Polo-like kinase 1 in the life and death of cancer cells. Cell Cycle. 2003;2:424–425. [PubMed] [Google Scholar]
- Loft S, Poulsen HE. Cancer risk and oxidative DNA damage in man. J Mol Med. 1996;74:297–312. doi: 10.1007/BF00207507. [DOI] [PubMed] [Google Scholar]
- Lohr K, Moritz C, Contente A, Dobbelstein M. p21/CDKN1A mediates negative regulation of transcription by p53. J Biol Chem. 2003;278:32507–32516. doi: 10.1074/jbc.M212517200. [DOI] [PubMed] [Google Scholar]
- Lorimore SA, Wright EG. Radiation-induced genomic instability and bystander effects: related inflammatory-type responses to radiation-induced stress and injury? A review. Int J Radiat Biol. 2003;79:15–25. [PubMed] [Google Scholar]
- Mizuno T, Zhong X, Rothstein TL. Fas-induced apoptosis in B cells. Apoptosis. 2003;8:451–460. doi: 10.1023/a:1025534223168. [DOI] [PubMed] [Google Scholar]
- Mothersill C, Moriarty MJ, Seymour CB. Bystander and other delayed effects and multi-organ involvement and failure following high dose exposure to ionising radiation. BJR Suppl. 2005;27:128–131. [Google Scholar]
- Oliveira AP, Patil KR, Nielsen J. Architecture of transcriptional regulatory circuits is knitted over the topology of bio-molecular interaction networks. BMC Syst Biol. 2008;2:17. doi: 10.1186/1752-0509-2-17. [DOI] [PMC free article] [PubMed] [Google Scholar]
- Patil KR, Nielsen J. Uncovering transcriptional regulation of metabolism by using metabolic network topology. Proc Natl Acad Sci USA. 2005;102:2685–2689. doi: 10.1073/pnas.0406811102. [DOI] [PMC free article] [PubMed] [Google Scholar]
- Paul S, Amundson SA. Development of gene expression signatures for practical radiation biodosimetry. Int J Radiat Oncol Biol Phys. 2008;71:1236–1244. doi: 10.1016/j.ijrobp.2008.03.043. [DOI] [PMC free article] [PubMed] [Google Scholar]
- Ramaswamy S, Tamayo P, Rifkin R, Mukherjee S, Yeang CH, Angelo M, Ladd C, Reich M, Latulippe E, Mesirov JP, Poggio T, Gerald W, Loda M, Lander ES, Golub TR. Multiclass cancer diagnosis using tumor gene expression signatures. Proc Natl Acad Sci USA. 2001;98:15149–15154. doi: 10.1073/pnas.211566398. [DOI] [PMC free article] [PubMed] [Google Scholar]
- Reimers M, Carey VJ. Bioconductor: an open source framework for bioinformatics and computational biology. Methods Enzymol. 2006;411:119–134. doi: 10.1016/S0076-6879(06)11008-3. [DOI] [PubMed] [Google Scholar]
- Ressom HW, Varghese RS, Zhang Z, Xuan J, Clarke R. Classification algorithms for phenotype prediction in genomics and proteomics. Front Biosci. 2008;13:691–708. doi: 10.2741/2712. [DOI] [PMC free article] [PubMed] [Google Scholar]
- Riley PA. Free radicals in biology: oxidative stress and the effects of ionizing radiation. Int J Radiat Biol. 1994;65:27–33. doi: 10.1080/09553009414550041. [DOI] [PubMed] [Google Scholar]
- Schellenberger J, Park JO, Conrad TM, Palsson BO. BiGG: a biochemical genetic and genomic knowledgebase of large scale metabolic reconstructions. BMC Bioinformatics. 2010;11:213. doi: 10.1186/1471-2105-11-213. [DOI] [PMC free article] [PubMed] [Google Scholar]
- Shi L, Reid LH, Jones WD, Shippy R, Warrington JA, Baker SC, Collins PJ, de Longueville F, Kawasaki ES, Lee KY, Luo Y, Sun YA, Willey JC, Setterquist RA, Fischer GM, Tong W, Dragan YP, Dix DJ, Frueh FW, Goodsaid FM, Herman D, Jensen RV, Johnson CD, Lobenhofer EK, Puri RK, Schrf U, Thierry-Mieg J, Wang C, Wilson M, Wolber PK, Zhang L, Amur S, Bao W, Barbacioru CC, Lucas AB, Bertholet V, Boysen C, Bromley B, Brown D, Brunner A, Canales R, Cao XM, Cebula TA, Chen JJ, Cheng J, Chu TM, Chudin E, Corson J, Corton JC, Croner LJ, Davies C, Davison TS, Delenstarr G, Deng X, Dorris D, Eklund AC, Fan XH, Fang H, Fulmer-Smentek S, Fuscoe JC, Gallagher K, Ge W, Guo L, Guo X, Hager J, Haje PK, Han J, Han T, Harbottle HC, Harris SC, Hatchwell E, Hauser CA, Hester S, Hong H, Hurban P, Jackson SA, Ji H, Knight CR, Kuo WP, LeClerc JE, Levy S, Li QZ, Liu C, Liu Y, Lombardi MJ, Ma Y, Magnuson SR, Maqsodi B, McDaniel T, Mei N, Myklebost O, Ning B, Novoradovskaya N, Orr MS, Osborn TW, Papallo A, Patterson TA, Perkins RG, Peters EH, Peterson R, Philips KL, Pine PS, Pusztai L, Qian F, Ren H, Rosen M, Rosenzweig BA, Samaha RR, Schena M, Schroth GP, Shchegrova S, Smith DD, Staedtler F, Su Z, Sun H, Szallasi Z, Tezak Z, Thierry-Mieg D, Thompson KL, Tikhonova I, Turpaz Y, Vallanat B, Van C, Walker SJ, Wang SJ, Wang Y, Wolfinger R, Wong A, Wu J, Xiao C, Xie Q, Xu J, Yang W, Zhang L, Zhong S, Zong Y, Slikker WJ. The MicroArray Quality Control (MAQC) project shows inter- and intraplatform reproducibility of gene expression measurements. Nat Biotechnol. 2006;24:1151–1161. doi: 10.1038/nbt1239. [DOI] [PMC free article] [PubMed] [Google Scholar]
- Song M, Rajasekaran S. A greedy algorithm for gene selection based on SVM and correlation. Int J Bioinform Res Appl. 2010;6:296–307. doi: 10.1504/IJBRA.2010.034077. [DOI] [PubMed] [Google Scholar]
- Strobl C, Boulesteix AL, Kneib T, Augustin T, Zeileis A. Conditional variable importance for random forests. BMC Bioinformatics. 2008;9:307. doi: 10.1186/1471-2105-9-307. [DOI] [PMC free article] [PubMed] [Google Scholar]
- Team, R.D.C. R: A Language and Environment for Statistical Computing. R Foundation for Statistical Computing; Vienna: 2010. [Google Scholar]
- Tibshirani R, Hastie T, Narasimhan B, Chu G. Diagnosis of multiple cancer types by shrunken centroids of gene expression. Proc Natl Acad Sci USA. 2002;99:6567–6572. doi: 10.1073/pnas.082099299. [DOI] [PMC free article] [PubMed] [Google Scholar]
- Tomasini R, Seux M, Nowak J, Bontemps C, Carrier A, Dagorn JC, Pebusque MJ, Iovanna JL, Dusetti NJ. TP53INP1 is a novel p73 target gene that induces cell cycle arrest and cell death by modulating p73 transcriptional activity. Oncogene. 2005;24:8093–8104. doi: 10.1038/sj.onc.1208951. [DOI] [PubMed] [Google Scholar]
- Tyburski JB, Patterson AD, Krausz KW, Slavik J, Fornace AJ, Jr, Gonzalez FJ, Idle JR. Radiation metabolomics. 1. Identification of minimally invasive urine biomarkers for gamma-radiation exposure in mice. Radiat Res. 2008;170:1–14. doi: 10.1667/RR1265.1. [DOI] [PMC free article] [PubMed] [Google Scholar]
- Tyburski JB, Patterson AD, Krausz KW, Slavik J, Fornace AJ, Jr, Gonzalez FJ, Idle JR. Radiation metabolomics. 2. Dose- and time-dependent urinary excretion of deaminated purines and pyrimidines after sublethal gamma-radiation exposure in mice. Radiat Res. 2009;172:42–57. doi: 10.1667/RR1703.1. [DOI] [PMC free article] [PubMed] [Google Scholar]
- Wheeler DL, Church DM, Federhen S, Lash AE, Madden TL, Pontius JU, Schuler GD, Schriml LM, Sequeira E, Tatusova TA, Wagner L. Database resources of the national center for biotechnology. Nucleic Acids Res. 2003;31:28–33. doi: 10.1093/nar/gkg033. [DOI] [PMC free article] [PubMed] [Google Scholar]
- Whitlock MC. Combining probability from independent tests: the weighted Z-method is superior to Fisher’s approach. J Evol Biol. 2005;18:1368–1373. doi: 10.1111/j.1420-9101.2005.00917.x. [DOI] [PubMed] [Google Scholar]
- Yoo J, Ghiassi M, Jirmanova L, Balliet AG, Hoffman B, Fornace AJ, Jr, Liebermann DA, Bottinger EP, Roberts AB. Transforming growth factor-beta-induced apoptosis is mediated by Smad-dependent expression of GADD45b through p38 activation. J Biol Chem. 2003;278:43001–43007. doi: 10.1074/jbc.M307869200. [DOI] [PubMed] [Google Scholar]
Associated Data
This section collects any data citations, data availability statements, or supplementary materials included in this article.