

Abstract
Large antibiotic resistance gene pools in the microbiota of foods may ultimately pose a risk for human health. This study reports the identification and quantification of tetracycline- and erythromycin-resistant populations, resistance genes, and gene diversity in traditional Spanish and Italian cheeses, via culturing, conventional PCR, real-time quantitative PCR (qPCR), and denaturing gradient gel electrophoresis (DGGE). The numbers of resistant bacteria varied widely among the antibiotics and the different cheese varieties; in some cheeses, all the bacterial populations seemed to be resistant. Up to eight antibiotic resistance genes were sought by gene-specific PCR, six with respect to tetracycline, that is, tet(K), tet(L), tet(M), tet(O), tet(S), and tet(W), and two with respect to erythromycin, that is, erm(B) and erm(F). The most common resistance genes in the analysed cheeses were tet(S), tet(W), tet(M), and erm(B). The copy numbers of these genes, as quantified by qPCR, ranged widely between cheeses (from 4.94 to 10.18log10/g). DGGE analysis revealed distinct banding profiles and two polymorphic nucleotide positions for tet(W)-carrying cheeses, though the similarity of the sequences suggests this tet(W) to have a monophyletic origin. Traditional cheeses would therefore appear to act as reservoirs for large numbers of many types of antibiotic resistance determinants.
1. Introduction
Antibiotic resistance (AR) is a natural phenomenon, the appearance of which predates the clinical use of antibiotics [1, 2]. Unfortunately, the widespread use and misuse of antibiotics in clinical and nonclinical environments for more than seven decades have provided optimal conditions for the appearance, mobilization, and concentration of highly efficient resistance systems in bacteria [3]. The transfer of AR genes into human and animal pathogens could ultimately lead to a failure of antibiotic therapy [4]. Mobilization among bacterial species is facilitated by AR genes being commonly located on mobile genetic elements such as transposons and plasmids, which have high horizontal transfer capacity [5]. The presence of antibiotics in the environment not only provides a positive selection for resistant pathogens, but also exerts an evolutive pressure on components of the commensal microbiota [6]. Under these conditions, the commensal bacteria in food could become a reservoir for AR determinants that could then further be disseminated via the food chain [7–9].
Determining the prevalence of AR genes in a given environment, and their characterization, requires the isolation and identification of the resistant bacteria, followed by a molecular analysis of their AR determinants [10–12]. The identification and quantification of AR genes directly in environmental samples, that is, without culturing biases, would be useful [13, 14]. Culture-independent analysis is also faster and more accurate than culture-based methods. Indeed, several AR identification and AR gene quantification techniques that require no culturing have recently been developed, such as denaturing gradient gel electrophoresis (DGGE) [15, 16], real-time quantitative PCR (qPCR) [13, 14, 17], construction and functional analysis of gene libraries [18–20], AR gene microarrays [21, 22], and analysis of metagenomic sequences [23, 24]. Knowledge of the types and loads of AR genes in foods could ultimately be of help to estimate the risk of their transmission during cheese manufacturing and after consumption. To our knowledge, few attempts have been made to directly analyze AR gene numbers and diversity in food samples.
The aims of the present work were to identify the microbial populations resistant to tetracycline and erythromycin in commercial Spanish and Italian cheeses and to quantify their antibiotic resistance genes, using culturing and molecular techniques. These antibiotics were selected as a model due to the fact that resistance against tetracycline and erythromycin has been extensively documented among food-borne bacteria, including strains of lactic acid bacteria species.
2. Material and Methods
2.1. Cheese Sampling
Twenty commercial cheeses—10 Spanish (Cabrales, Zamorano, Majorero, Mahón, Torta del Casar, Manchego, Ibores, Garrotxa, De La Mesta, and Ibérico) and 10 Italian (Gorgonzola “dolce,” Gorgonzola “picante,” Caprino, Quartirolo Lombardo, Pecorino Sardo, Grana Padano, Montasio, Monte Veronese, Asiago, and Taleggio)—were bought at retail stores. These cheese types vary in terms of the technology used to manufacture them (artisanal (without starters), industrial (using commercial starters), the type of milk used (cow, goat, ewe, or mixtures), the treatment to which that milk is subject (raw, pasteurised), and ripening time (from one to 24 months)).
2.2. Plate Counts of Cultivable Antibiotic-Resistant Bacteria
Cubes of ten grams of cheese from the centre were homogenised with 90 mL of a 2% (w/v) sterilised sodium citrate solution prewarmed at 45°C for 1 min in a Colworth Stomacher 400 (Seward Ltd., London, UK). Cheese homogenates were tenfold diluted in Ringer's solution (Merck, Darmstadt, Germany) and the dilutions were plated in duplicate on selective and nonselective agarified media. Total aerobic mesophilic bacteria (including aerotolerant and facultative anaerobes) were enumerated on Plate Count Milk Agar (PCMA; Merck), Gram-positive bacteria such as lactic acid bacteria (LAB) were enumerated using de Man Rogosa and Sharpe agar (MRS; Merck), enterococci on Slanetz and Bartley agar (SB; Merck), and staphylococci on Baird-Parker agar (BP; Merck). Tetracycline and erythromycin resistant populations were counted using the same nonselective selective and media containing tetracycline (15 μg mL−1) and erythromycin (8 μg mL−1) (Sigma-Aldrich, St. Louis, MO, USA). Antibiotic concentrations were considered eight- to tenfolds higher than the usual resistance levels of susceptible populations [29]. This concentration, which is much lower than that provided by dedicated resistance mechanisms [5, 29], was considered to avoid unspecific growth of susceptible bacteria. Plates were then incubated at 30°C (PCMA and MRS media) and 45°C (SB medium) for 72 h and at 37°C (BP medium) for 48 h.
2.3. Total DNA Extraction and Purification
Cheese samples (5 grams) were homogenized with 45 mL of a 2% sterile sodium citrate solution and incubated at 37°C for 3 h in the presence of 1 mg mL−1 pronase (Sigma-Aldrich) and 100 μL β-mercaptoethanol (Merck). Total microbial cells were harvested by centrifugation at 5000 ×g for 20 min and disrupted using 0.1 mm glass beads (Sigma-Aldrich) as reported elsewhere [30]. Genomic DNA was purified by phenol and phenol/chloroform extractions and precipitated with 2-propanol (all chemicals from Sigma-Aldrich). Finally, it was suspended in sterile water containing 5–15 mg mL−1 of RNase (Sigma-Aldrich).
Total DNA was also isolated from pure cultures of control strains carrying known AR genes: Staphylococcus epidermidis SE36 [tet(K)], Enterococcus faecium ET51 [tet(L)], Lactococcus lactis IPLA 31008 [tet(M)], Enterococcus faecalis Jtet [tet(O)], Enterococcus spp. ET15 [tet(S)], Bifidobacterium longum B93 [tet(W)], Lactobacillus johnsonii G41 [erm(B)], and Bacteroides fragilis 79a [erm(F)]. Genomic microbial DNA from these strains was purified from 1 mL of an overnight culture in brain heart infusion broth (BHI; Merck) using the Kit GenElute bacterial genomic DNA (Sigma-Aldrich). The recovered DNA was then stored at −20°C until analysis.
2.4. PCR Detection of Tetracycline and Erythromycin Resistance Genes
The presence of tetracycline and erythromycin resistance genes was examined in DNA from the cheese samples and from control strains by standard PCR using both universal primers for genes encoding tetracycline resistance through ribosomal protection proteins (RPPs), such as tet(M), tet(O), tet(S), and tet(W), and gene-specific primer pairs for genes encoding tetracycline resistance [tet(K) and tet(L)] and erythromycin resistance [erm(B) and erm(F)] (Table 1). The PCR conditions used for amplification were those reported in Table 1. Positive (DNA from appropriate control strains) and negative (no template DNA) controls were subjected to amplification under the same conditions.
Table 1.
Sequence and properties of the PCR primers used in this work.
| Application/primer | Target gene | Sequence (5′-3′) | Annealing T a (°C) | Amplicon size (bp) | Reference |
|---|---|---|---|---|---|
| Conventional PCR | |||||
| Tet-F | tet a | GCTCA(T/C)GTTGA(T/C)GCAGGAA | 50 | 1292 | [25] |
| Tet-R | AGGATTTGGCGG(C/G)ACTTC(G/T)A | ||||
| TetK-F | tet(K) | TTATGGTGGTTGTAGCTAGAAA | 55 | 348 | [15] |
| TetK-R | AAAGGGTTAGAAACTCTTGAAA | ||||
| TetL-F | tet(L) | GTMGTTGCGCGCTATATTCC | 55 | 696 | [15] |
| TetL-R | GTGAAMGRWAGCCCACCTAA | ||||
| DI-F | tet(M) | GAYACICCIGGICAYRTIGAYTT | 55 | 1513 | [26] |
| TetM-R | CACCGAGCAGGGATTTCTCCAC | ||||
| TetO-F | tet(O) | AATGAAGATTCCGACAATTT | 55 | 781 | [26] |
| TetO-R | CTCATGCGTTGTAGTATTCCA | ||||
| TetS-F | tet(S) | ATCAAGATATTAAGGAC | 55 | 573 | [26] |
| TetS-R | TTCTCTATGTGGTAATC | ||||
| TetW-F | tet(W) | AAGCGGCAGTCACTTCCTTCC | 50 | 1150 | [11] |
| Tet-R | AGGATTTGGCGG(C/G)ACTTC(G/T)A | ||||
| ErmB-F | erm(B) | GAAAAGGTACTCAACCAAATA | 50 | 639 | [27] |
| ErmB-R | AGTAACGGTACTTAAATTGTTTAC | ||||
| ErmF-F | erm(F) | CGGGTCAGCACTTTACTATTG | 50 | 466 | [27] |
| ErmF-R | GGACCTACCTCATAGACAAG | ||||
| Real-time qPCR | |||||
| TBA-F | 16S rDNA | CGGCAACGAGCGCAACCC | 60 | 130 | [28] |
| TBA-R | CCATTGTAGCACGTGTGTAGCC | ||||
| TetK-qPCR-F | tet(K) | TGCTGCATTCCCTTCACTGA | 60 | 69 | This study |
| TetK-qPCR-R | GCTTTGCCTTGTTTTTTTCTTGTAA | ||||
| TetL-qPCR-F | tet(L) | GGGTAAAGCATTTGGTCTTATTGG | 60 | 63 | This study |
| tetL-qPCR-R | ATCGCTGGACCGACTCCTT | ||||
| TetM-qPCR-F | tet(M) | CAGAATTAGGAAGCGTGGACAA | 60 | 67 | This study |
| TetM-qPCR-R | CCTCTCTGACGTTCTAAAAGCGTAT | ||||
| TetO-qPCR-F | tet(O) | AATGTCAGAACTGGAACAGGAAGAA | 60 | 59 | This study |
| TetO-qPCR-R | CGTGATAAACGGGAAATAACGTT | ||||
| TetS-qPCR-F | tet(S) | CGAGGTCATTCTCATTGGTGAA | 60 | 84 | This study |
| TetS-qPCR-R | CAGACACTGCGTCCATTTGTAAA | ||||
| TetW-qPCR-F | tet(W) | ACGGCAGCGCAAAGAGAA | 60 | 60 | This study |
| TetW-qPCR-R | CGGGTCAGTATCCGCAAGTT | ||||
| ErmB-qPCR-F | erm(B) | GGATTCTACAAGCGTACCTTGGA | 60 | 69 | This study |
| ErmB-qPCR-R | AATCGAGACTTGAGTGTGCAAGAG | ||||
| ErmF-qPCR-F | erm(F) | TGATGCCCGAAATGTTCAAGT | 60 | 63 | This study |
| ErmF-qPCR-R | AAAGGAAATTTCGGAACTGCAA | ||||
| DGGE assays | |||||
| TetM-F | tet(M) | ACAGAAAGCTTATTATATAAC | 55 | 171 | [15] |
| GCb-TetM-R | TGGCGTGTCTATGATGTTCAC | ||||
| TetW-F | tet(W) | GAGAGCCTGCTATATGCCAGC | 64 | 168 | [15] |
| GC-TetW-R | GGGCGTATCCACAATGTTAAC |
a tet, genes encoding ribosome protection proteins.
bSequence of the GC clamp: CGCCCGGGGCGCGCCCCGGGCGGGGGGGGGGCACGGGGGG.
2.5. Real-Time Quantitative PCR
2.5.1. Design of Primers
Updated tetracycline and erythromycin resistance genes in databases were compiled for designing of new primers for the qPCR analysis. Nucleotide sequences encoding tetracycline resistance in the form of RPPs and efflux pumps, and erythromycin resistance, were downloaded from the GenBank database (see Table 1 in Supplementary Material available online at http://dx.doi.org/10.1155/2014/746859) and aligned with one another using Mega 5 software. Conserved regions at appropriate distances were used for designing the primers employed in qPCR reactions (Table 1). This was achieved using Primer Express 3.0 software (Applied Biosystems, Carlsbad, CA, USA).
2.5.2. qPCR Conditions
qPCR analyses were performed to quantify tetracycline (tet) and erythromycin (erm) resistance genes in the total microbial DNA from the cheese samples. Amplifications were performed in an ABI Prism Fast 7500 sequence detection system (Applied Biosystems). Each 20 μL qPCR reaction included 4 μL of extracted DNA (approximately 200 ng), 10 μL of SYBR Green PCR Master Mix (containing ROX as a passive reference), and 900 nM of each primer. The following cycling conditions were used: 2 min at 50°C, an initial denaturation step of 10 min at 95°C, followed by 40 cycles of 15 s at 95°C, and 60 s at 60°C. Baseline and threshold calculations were performed using ABI Prism Fast 7500 software. Melting temperature analyses and size estimations of the PCR products were performed on agarose gels to check for nonspecific amplification.
2.5.3. Construction of qPCR Standards
Conventional PCR reactions, as described above, were used to generate gene-specific amplicons used as template DNA standards for qPCR. Amplicons were purified using a gel/PCR extraction kit (ATP Biotech, Banciao City, Taiwan) and quantified fluorometrically using a Gen5 Microplate dsDNA Quantitation Kit (Biotek Instruments, Winooski, VT, USA). The number of DNA molecules was calculated based on the size and mass of the amplicons. Tenfold serial dilutions of the amplicons were prepared and used following the procedure by Yu et al. [17]. To ensure accuracy in copy number quantification, a complementary control standard curve was obtained using DNA from known numbers of B. longum B93 cells (enumerated in MRS agar plates containing 0.25% cysteine following incubation in anaerobiosis at 37°C for 72 h); this strain carries a single copy of tet(W) [31]. Dilutions of total DNA from the cells were subjected to qPCR analysis as above.
2.5.4. qPCR Expression Data
Absolute gene copy number was expressed as the number of copies of resistant genes per g−1, whereas relative copy number was expressed as the number of resistant genes per million copies of total bacteria ribosomal genes, as determined with the universal prokaryotic primers TBA-F and TBA-R (Table 1). Absolute abundance was calculated based on the results obtained for the corresponding standard of each resistant gene. Relative abundance was calculated using E ΔCt, where E is the efficiency of the primer according to the slope of standard curve (E = 10−1/slope) and ΔCt is the Ct value of the gene target (tetracycline and erythromycin resistance genes) normalized against the Ct value of the total bacterial numbers in the samples. For the relative quantification, the copy number of the 16S rRNA genes per cell was averaged to five. The efficiency E of each pair of primers was as follows: 1.94 for tet(K), 1.97 for tet(L), 1.97 for tet(M), 2,03 for tet(O), 2,02 for tet(S) and 2,03 for tet(W), and 1.94 for erm(B) and 1.99 for erm(F).
2.6. Denaturing Gradient Gel Electrophoresis Analysis
DNA from cheeses and strains harbouring known tet genes (Lactococcus lactis IPLA 31008 [tet(M)], Enterococcus faecalis Jtet [tet(O)], Enterococcus spp. ET15 [tet(S)], and Bifidobacterium longum B93 [tet(W)]) was amplified by PCR using DGGE primers (Table 1), employing the PCR conditions described elsewhere [15]. DGGE analysis of the amplified tet genes was performed as previously reported [16] with slight modifications. Briefly, DGGE was performed in a DCode apparatus (Bio-Rad, Richmond, CA, USA) at 60°C on 8% polyacrylamide gels with a formamide-urea denaturing gradient of 15–50%. Electrophoresis was conducted at 150 V for 2 h and 200 V for 1 h. After electrophoresis, gels were stained in an ethidium bromide solution (0.5 μg mL−1), and the DNA bands were visualized and captured using a Gbox system and GeneSys software (Syngene, Cambridge, UK). After isolation and reamplification with the same primers without the GC clamp and identical PCR conditions, bands from the acrylamide gels were identified by sequencing and sequence comparison. Online similarity searches were performed by using the BLAST tool in the GenBank database (http://www.ncbi.nlm.nih.gov/BLAST/).
3. Results
3.1. Prevalence of AR Populations in Spanish and Italian Cheeses
The Spanish and Italian cheese samples were subjected to conventional microbiological analysis on selective and differential media supplemented or not with tetracycline and erythromycin. Populations of tetracycline-resistant (Tetr) and/or erythromycin-resistant bacteria (Ermr) were detected on most counting media for both Spanish and Italian cheeses made from raw or pasteurised milk (Tables 2 and 3, resp.). The AR bacterial counts varied widely depending on the microbial group and type of cheese. In general, Italian cheeses (Table 3) returned lower Tetr and Ermr counts than Spanish cheeses (Table 2). Table 2 shows the total number of mesophilic, aerobic, Tetr, and Ermr bacteria (enumerated in PCMA) to reach a maximum of 6.79 log10 cfu g−1 and 7.15 log10 cfu g−1, respectively, in samples of Cabrales. Microbial counts in this cheese type showed the antibiotic-resistant populations to generally be two to three log10 units lower than in antibiotic-free media; such results were only returned by this cheese.
Table 2.
Microbial counts (log10 cfu g−1) of the total and antibiotic resistant bacterial populations found in samples of ten Spanish cheeses.
| Culture mediuma | Cheese | |||||||||
|---|---|---|---|---|---|---|---|---|---|---|
| Cabrales∗ | Zamorano∗ | Majorero∗ | Mahón | Torta del Casar∗ | Manchego | Ibores∗ | Garrotxa | De La Mesta∗ | Ibérico | |
| PCMA | 7.74 | 6.64 | 9.23 | 6.49 | 8.18 | 8.21 | 8.26 | 7.58 | 6.01 | 8.62 |
| PCMA + Tc | 6.76 | 2.74 | 4.26 | <2.0b | 5.98 | 3.21 | 5.76 | 3.68 | 5.46 | 4.70 |
| PCMA + Erm | 7.15 | 3.92 | 4.36 | 3.84 | 5.82 | 3.16 | 5.65 | 4.72 | 3.91 | 3.62 |
|
| ||||||||||
| MRS | 7.20 | 6.53 | 4.53 | 6.36 | 7.93 | 6.21 | 8.12 | 7.40 | 5.08 | 7.92 |
| MRS + Tc | 6.79 | 3.64 | 4.11 | <2.0 | 4.96 | <2.0 | 4.77 | 3.12 | <2.0 | <2.0 |
| MRS + Erm | 6.90 | 4.18 | 4.03 | <2.0 | 4.89 | <2.0 | 5.67 | 3.22 | <2.0 | <2.0 |
|
| ||||||||||
| SB | 5.83 | 4.07 | 2.95 | <2.0 | 5.67 | <2.0 | 5.85 | 3.13 | 4.82 | 5.04 |
| SB + Tc | 5.08 | 2.30 | <2.0 | <2.0 | 4.82 | <2.0 | 3.20 | <2.0 | 2.81 | 4.24 |
| SB + Erm | 5.18 | 3.04 | <2.0 | <2.0 | 4.95 | <2.0 | <2.0 | <2.0 | 3.61 | <2.0 |
|
| ||||||||||
| BP | 5.34 | 3.53 | 3.91 | 3.74 | 5.30 | <2.0 | 4.27 | 4.26 | 4.18 | 4.72 |
| BP + Tc | 4.71 | 2.78 | <2.0 | <2.0 | 4.84 | <2.0 | 2.98 | 3.20 | <2.0 | <2.0 |
| BP + Erm | 5.00 | 2.98 | 3.56 | <2.0 | 4.95 | <2.0 | <2.0 | 4.47 | <2.0 | <2.0 |
aCulture media used for counting of different bacteria groups: PCMA for total mesophilic bacteria, MRS for lactic acid bacteria, SB for enterococci, and BP for staphylococci and micrococci. Antibiotics utilized to supplement the culture media: Tc, tetracycline and Erm, erythromycin.
bCounts below the detection limit (2.0 log10 cfu g−1).
∗Cheeses made from raw milk.
Table 3.
Microbial counts (log10 cfu g−1) of the total and antibiotic resistant bacterial populations found in samples of ten Italian cheeses.
| Culture mediuma | Cheese | |||||||||
|---|---|---|---|---|---|---|---|---|---|---|
| Gorgonzola “dolce” | Gorgonzola “piccante” | Caprino∗ | Quartirolo Lombardo | Pecorino Sardo∗ | Grana Padano∗ | Montasio∗ | Monte Veronese∗ | Asiago∗ | Taleggio∗ | |
| PCMA | 7.78 | 8.70 | 8.23 | 6.00 | 6.00 | 8.04 | 7.38 | 8.63 | 7.36 | 8.34 |
| PCMA + Tc | 5.04 | 4.48 | 3.00 | 2.05 | <2.0b | 3.60 | <2.0 | 3.00 | 4.60 | <2.0 |
| PCMA + Erm | 6.00 | <2.0 | <2.0 | 2.85 | 5.30 | <2.0 | <2.0 | 5.45 | 2.48 | 2.70 |
|
| ||||||||||
| MRS | 6.40 | 7.60 | 8.30 | 6.38 | 5.30 | 7.00 | 7.63 | 8.15 | 5.00 | 6.70 |
| MRS + Tc | 4.08 | <2.0 | <2.0 | <2.0 | <2.0 | 3.60 | 2.00 | <2.0 | 3.67 | <2.0 |
| MRS + Erm | 3.08 | 3.01 | <2.0 | <2.0 | <2.0 | <2.0 | <2.0 | <2.0 | 3.73 | <2.0 |
|
| ||||||||||
| SB | 5.46 | 5.21 | <2.0 | 6.00 | 4.88 | 3.60 | 4.41 | 3.20 | 5.30 | 2.00 |
| SB + Tc | <2.0 | <2.0 | <2.0 | 2.30 | <2.0 | 3.78 | 2.00 | 2.78 | 2.00 | <2.0 |
| SB + Erm | 2.48 | <2.0 | <2.0 | <2.0 | 2.00 | <2.0 | 2.00 | <2.0 | <2.0 | <2.0 |
|
| ||||||||||
| BPA | 5.95 | 5.44 | <2.0 | 3.90 | <2.0 | 3.97 | 2.60 | 3.78 | <2.0 | 2.85 |
| BP + Tc | 3.78 | 2.48 | <2.0 | 3.23 | <2.0 | 3.60 | 2.00 | <2.0 | <2.0 | <2.0 |
| BP + Erm | 3.00 | <2.0 | <2.0 | 2.48 | <2.0 | <2.0 | <2.0 | 3.00 | <2.0 | <2.0 |
aCulture media used for counting of different bacteria groups: PCMA for total mesophilic bacteria, MRS for lactic acid bacteria, SB for enterococci, and BP for staphylococci and micrococci. Antibiotics utilized to supplement the culture media: Tc, tetracycline and Erm, erythromycin.
bCounts below the detection limit (2.0 log10 cfu g−1).
∗Cheeses made from raw milk.
3.2. Prevalence of AR Genes in Spanish and Italian Cheeses
Table 4 shows the resistance genes identified by PCR in total DNA from the different cheeses using specific primers for six tetracycline and two erythromycin resistance genes. Two or more AR genes were detected in all cheeses with the exception of Mahón and Gorgonzola “dolce” cheeses, both of which returned a single AR gene (tet(W) and tet(K), resp.). Indeed, the Spanish De La Mesta cheese harboured all eight AR genes examined in this work, while the Italian Asiago cheese harboured seven (all but tet(L)). The most common gene encoding tetracycline resistance was tet(S), which was identified in nine Spanish and six Italian cheeses, followed by tet(W) in seven Spanish and four Italian cheeses. In contrast, tet(L) and tet(O) were the least widespread of the tetracycline resistance determinants; these were detected in three Spanish cheeses and in two Spanish and two Italian cheeses, respectively. The erm(B) gene was detected in all but three cheese types, while the erm(F) gene was identified in seven of the 10 Italian cheeses, but only in one Spanish cheese (De La Mesta).
Table 4.
Tetracycline and erythromycin resistance genes detected by conventional PCR in Spanish and Italian cheeses.
| Cheese | Gene | |||||||
|---|---|---|---|---|---|---|---|---|
| Tetracycline resistance gene | Erythromycin resistance gene | |||||||
| tet(K) | tet(L) | tet(M) | tet(O) | tet(S) | tet(W) | erm(B) | erm(F) | |
| Spanish cheeses | ||||||||
| Cabrales∗ | + | + | + | − | + | + | + | − |
| Zamorano∗ | + | + | + | − | + | + | + | − |
| Majorero∗ | − | − | − | − | + | − | + | − |
| Mahón | − | − | − | − | − | + | − | − |
| Torta del Casar∗ | − | − | + | + | + | + | + | − |
| Manchego | − | − | − | − | + | − | + | − |
| Ibores∗ | − | − | + | − | + | + | + | − |
| Garrotxa | − | − | − | − | + | + | + | − |
| De La Mesta∗ | + | + | + | + | + | + | + | + |
| Ibérico | − | − | + | − | + | − | + | − |
| Italian cheeses | ||||||||
| Gorgonzola “dolce” | − | − | − | − | − | − | + | − |
| Gorgonzola “piccante” | + | − | − | − | − | − | + | + |
| Caprino∗ | − | − | − | + | + | + | + | + |
| Quartirolo Lombardo | − | − | − | − | + | + | − | − |
| Pecorino Sardo∗ | + | − | + | − | + | + | − | − |
| Grana Padano∗ | − | − | − | − | − | − | + | + |
| Montasio∗ | − | − | − | − | − | − | + | + |
| Monte Veronese∗ | − | − | − | − | + | − | + | + |
| Asiago∗ | + | − | + | + | + | + | + | + |
| Taleggio∗ | − | − | − | − | + | − | + | + |
*Cheeses made from raw milk.
3.3. Quantification of Tetracycline and Erythromycin Resistance Genes by qPCR
Samples positive for AR genes in gene-specific PCR were subjected to qPCR to quantify those identified. A standard curve encompassing 103 through 1010 gene copies per reaction was produced using total DNA from B. longum B93 as a control (r 2 ≥ 0.996). The qPCR detection limit determined from both the control DNA of B. longum and the serial dilutions of gene-specific amplicons was estimated to be about 104 copies per gram of cheese. Independent reactions were performed in triplicate; high reproducibility was always obtained (average standard deviation ≤0.3). The amplification of AR genes with conventional gene-specific PCR and qPCR primers returned similar results for the Spanish cheeses (Table 4; Figures 1 and 2). Indeed, only two samples showed qPCR amplification failures for genes previously detected by gene-specific PCR among the Spanish cheeses (one tet(K) and one erm(B) gene). In contrast, among the Italian cheeses, eight samples showing AR genes in gene-specific PCR analysis (three for erm(F), two for each erm(B) and tet(W), plus one for tet(S)) failed to show the same with qPCR-specific primers.
Figure 1.
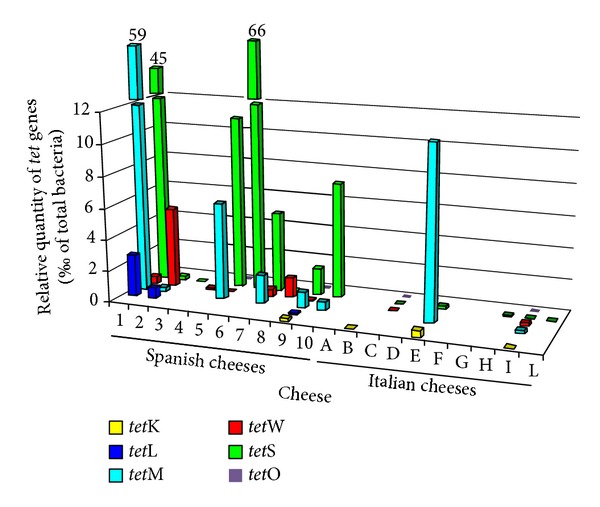
Bars diagram depicting the percentage copy number (‰) of different tetracycline resistance genes quantified by qPCR as a function of the total bacteria in Spanish (1 to 10) and Italian (A to L) cheeses. The order of both Spanish and Italian cheese types is the same as in the tables.
Figure 2.
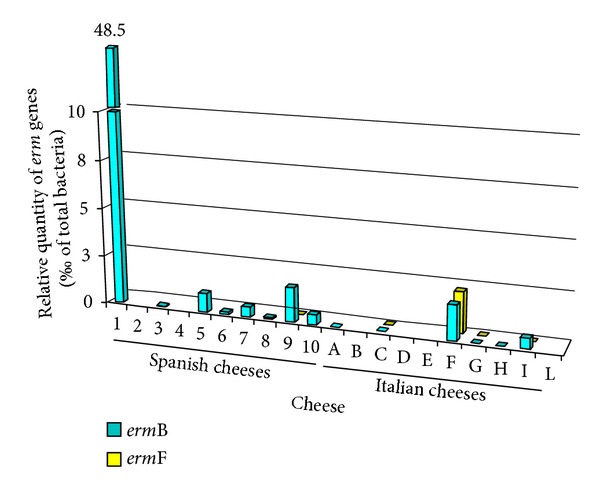
Bars diagram depicting the percentage copy number (‰) of erm(B) and erm(F) erythromycin resistance genes quantified by qPCR as a function of the total bacteria in Spanish (1 to 10) and Italian (A to L) cheeses. The order of both Spanish and Italian cheese types is the same as in the tables.
The copy number of the different tetracycline (Figure 1) and erythromycin (Figure 2) resistance genes varied widely among the cheese types. Absolute copy numbers of AR genes (log10/g of cheese) ranged from 4.94 (erm(F) in Asiago cheese) to 10.18 (tet(S) in Torta del Casar cheese). On average, the copy number of the different AR genes, quantified by qPCR analysis, was 6.6 ± 1.2 copies per gram of cheese. Figures 1 and 2 show the number of each resistance gene as a percentage (‰) of the total bacterial loads in the cheeses as determined by 16S rDNA analysis. In this way, intersample variations in gene copy number between cheeses are clearly depicted. In general agreement with the microbial counting results, fewer AR gene copies were found in the Italian than in the Spanish cheeses.
3.4. Denaturing Gradient Gel Electrophoresis (DGGE) Analysis
DGGE analyses were undertaken to assess the intragenic sequence variability of two of the most prevalent AR genes, tet(W) and tet(M). Besides differences in gene copy number, sequence variability can be a cause of amplification failure in gene-specific PCR and qPCR. Figure 3 shows the DGGE profiles obtained for tet(W) using total DNA from Spanish cheese samples as a template. The DGGE primers returned amplifications in six of the seven cheese samples deemed positive by gene-specific PCR (all but Mahón cheese). A prominent band was present in all samples analysed, the mobility of which was comparable to that produced when using as a template DNA from the B. longum control strain carrying a chromosomal tet(W) gene. Ten other bands of minor intensity were also observed across the cheeses (up to six bands in one sample; Figure 3, line 1), of which eight could be reamplified and sequenced. Sequence comparison showed these bands to be of identical nucleotide sequence to tet(W), except at two polymorphic positions. These polymorphic bands migrated differently on the gel. However, surprisingly, some bands from different positions showed identical sequences.
Figure 3.
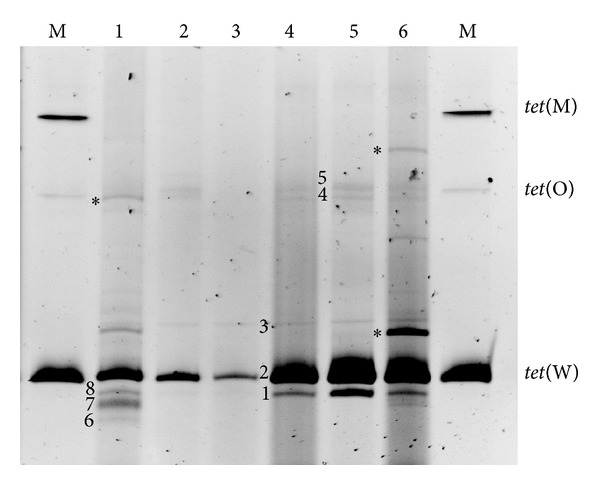
PCR-DGGE analysis of total DNA from Spanish cheeses using specific DGGE-primers for the tetracycline resistance tet(W) gene. Lanes from 1 to 6, Cabrales, Zamorano, Torta del Casar, Ibores, Garrotxa, and De La Mesta. Lanes M, DGGE markers consisting of amplicons obtained with specific DGGE primers for tet(M), tet(O), and tet(W), and using as template total DNA from bacterial strains harboring the respective tetracycline resistance gene. The asterisks denote bands that did no reamplification and, consequently, could not be identified.
DGGE analysis was also performed with specific primers for tet(M) using DNA from cheeses in which this gene had been identified. In this case, no differences were seen among the DGGE profiles. All the profiles obtained were composed of one intense and two weak bands, but all these bands were also produced when DNA from a control strain carrying a single-copy tet(M) gene was used as a template (data not shown).
4. Discussion
It is acknowledged that the misuse and overuse of antibiotics in agriculture, aquaculture, animal husbandry, and the clinic have caused an increase in AR bacteria, the consequence of the selection pressure exerted in these environments [3, 32]. AR in dairy products has traditionally been examined by conventional methods of microbial analysis. Indeed, in the present work, the tetracycline and erythromycin resistant populations of 20 Spanish and Italian traditional cheeses were first identified by culturing. High numbers of Tetr and Ermr bacteria were found in most samples, suggesting cheese to be an important vehicle of AR genes within the food chain. Similar ratios between counts of AR and antibiotic susceptible bacteria have previously been reported in other cheese types, such as Mozzarella [33] and Cheddar [8].
No significant differences were seen in AR counts between cheeses made from raw or pasteurised milk or between cheeses made from milk of different species. These results agree with previous reports that indicate reductions in the presence of AR bacteria only in sterile foods [4]. Pasteurisation may reduce the numbers and types of environmental bacteria, but traditional cheesemaking is open to contamination, in which organisms from many sources can gain access to and develop in the cheese. The Italian cheeses contained smaller AR populations than the Spanish ones. The curd-cooking step in some Italian cheeses may reduce the number of nonstarter microorganisms (e.g., enterococci and staphylococci), which have been shown to contain a plethora of resistance types [34–36]. Further, AR counts seemed to be inversely correlated with ripening time (data not shown), which is usually longer for Italian cheeses.
The presence of a wide range of tetracycline and erythromycin resistance genes in microbial populations from different environments has been reported elsewhere [13–15, 37, 38]. In the present study, the most abundant tet and erm genes were tet(S), tet(W), tet(M), and erm(B). In addition, erm(F) was widespread among the Italian cheeses.
The detection of tet and erm resistance genes by qPCR has frequently been used to monitor AR gene loads in different environments [13, 39–41]. However, it has been little used with dairy products [14, 37]. In the present work, great variation was seen between the cheeses in terms of the total abundance of Tetr and Ermr genes. Absolute copy numbers higher than 5 log10 units have previously been reported for different tet genes [37]. In the present work, gene copy numbers were much higher than the corresponding AR bacterial counts in antibiotic-containing media. Similar results have recently been reported for tet(A) and tet(B) in hake using qPCR and Taqman probes [42]. This might be a reflection of the actual copy number of the genes in AR bacteria (e.g., they may be present in high copy number plasmids) or due to the fact that DNA-based techniques do not distinguish between live, viable-but-noncultivable, and dead bacteria [13, 14, 37, 42]. Despite this, qPCR results showed a similar trend to plate counting. Lower gene copy numbers and AR bacterial counts were always recorded for the Italian cheeses. Intragenic variability, amplification yields by different primer pairs, and/or the high qPCR detection limit (of 104 copies per gram of cheese) might explain the discrepancies between the results obtained by this technique and those by gene-specific PCR.
As mentioned earlier, in addition to its use for tracking bacterial populations, the DGGE technique has already been used to analyse the polymorphism of tetracycline resistance genes in several environments [15, 16]. However, to our knowledge, this is the first attempt to use this molecular tool to estimate the diversity of tet genes in dairy products. A canonical tet(W) and tet(M) sequence accounted for the majority of genes in all cheeses. Nevertheless, single-nucleotide differences at two positions in the analysed segment of tet(W) were noted. Whether polymorphic sequences are carried by different bacterial species remains unknown. Nevertheless, the low sequence divergence suggests that tet resistance genes in cheese have a monophyletic origin and are spread among the majority bacterial populations through horizontal transfer. This has already been reported for tet genes in bacterial populations from other environments [43, 44].
5. Conclusions
The Spanish and Italian cheeses analyzed in this work showed wide variation in their AR bacterial populations, AR gene diversity, and AR gene loads for resistance to tetracycline and erythromycin. The results of this research are of basic and applied interest. Methods and techniques can be extended to study resistance against other groups of antibiotics of currently higher clinical significance, such as β-lactams and aminoglycosides. On average, more than three different AR genes were detected in every cheese type. Indeed, all eight erm and tet resistance genes searched for were identified in one Spanish cheese (De La Mesta) and seven in one Italian cheese (Asiago). The diversity of genes and their large copy numbers can be considered as a biological hazard with a likely, yet undefined, risk of horizontal transfer. To fully assess this risk would require the genetic characteristics of the bacteria carrying these AR genes and the location of these genes in the genome (chromosome, plasmid, transposon, integrons, etc.) to be known. As some other foods of animal origin, cheeses might be key players on the spread of AR genes via the food chain. This is certainly a biological hazard, which anticipates a transfer to susceptible bacteria during cheese manufacture or after consumption. Therefore, improvements in hygiene in animal husbandry, milk production, and cheese manufacturing practices may contribute to preventing the spread of these (and maybe others) AR determinants.
Supplementary Material
Supplementary Table 1 summarizes updated tetracycline and erythromycin resistance genes which were compiled for designing primers for the qPCR analyses. Nucleotide sequences were downloaded from the GenBank database and aligned with one another using Mega 5 Software.
Acknowledgments
The study was partially supported by a Spain-Italy bilateral collaboration program (Ref. IT2009-0080 and IT105MD12L). Financial support was further provided by projects from CICYT (Ref. AGL2011-24300-ALI) and INIA (Ref. RM2011-00005-00-00). A. B. Flórez and S. Delgado were supported by research contracts under Juan de la Cierva Program (Ref. JCI-2010-07457 and JCI-2008-02391, resp.). A. Alegría was awarded a scholarship of the Severo Ochoa program from FICYT (Ref. BP08-053). A. Quesada, Departamento de Biotecnología, Universidad de Extremadura, Spain, is greatly acknowledged for providing the authors with the B. fragilis 79a strain carrying erm(F).
Conflict of Interests
The authors declare that there is no conflict of interests regarding the publication of this paper.
References
- 1.Davies J, Davies D. Origins and evolution of antibiotic resistance. Microbiology and Molecular Biology Reviews. 2010;74(3):417–433. doi: 10.1128/MMBR.00016-10. [DOI] [PMC free article] [PubMed] [Google Scholar]
- 2.D'Costa VM, King CE, Kalan L, et al. Antibiotic resistance is ancient. Nature. 2011;477(7365):457–461. doi: 10.1038/nature10388. [DOI] [PubMed] [Google Scholar]
- 3.Wright GD. The antibiotic resistome: the nexus of chemical and genetic diversity. Nature Reviews Microbiology. 2007;5(3):175–186. doi: 10.1038/nrmicro1614. [DOI] [PubMed] [Google Scholar]
- 4.Levy SB, Marshall B. Antibacterial resistance worldwide: causes, challenges and responses. Nature Medicine. 2004;10(supplement 12):S122–S129. doi: 10.1038/nm1145. [DOI] [PubMed] [Google Scholar]
- 5.van Hoek AHAM, Mevius D, Guerra B, Mullany P, Roberts AP, Aarts HJM. Acquired antibiotic resistance genes: an overview. Frontiers in Microbiology. 2011;2, article 203 doi: 10.3389/fmicb.2011.00203. [DOI] [PMC free article] [PubMed] [Google Scholar]
- 6.Donoghue DJ. Antibiotic residues in poultry tissues and eggs: human health concerns? Poultry Science. 2003;82(4):618–621. doi: 10.1093/ps/82.4.618. [DOI] [PubMed] [Google Scholar]
- 7.Durán GM, Marshall DL. Ready-to-eat shrimp as an international vehicle of antibiotic-resistant bacteria. Journal of Food Protection. 2005;68(11):2395–2401. doi: 10.4315/0362-028x-68.11.2395. [DOI] [PubMed] [Google Scholar]
- 8.Wang HH, Manuzon M, Lehman M, et al. Food commensal microbes as a potentially important avenue in transmitting antibiotic resistance genes. FEMS Microbiology Letters. 2006;254(2):226–231. doi: 10.1111/j.1574-6968.2005.00030.x. [DOI] [PubMed] [Google Scholar]
- 9.Li X, Wang HH. Tetracycline resistance associated with commensal bacteria from representative ready-to-consume deli and restaurant foods. Journal of Food Protection. 2010;73(10):1841–1848. doi: 10.4315/0362-028x-73.10.1841. [DOI] [PubMed] [Google Scholar]
- 10.Perreten V, Schwarz F, Cresta L, Boeglin M, Dasen G, Teuber M. Antibiotic resistance spread in food. Nature. 1997;389(6653):801–802. doi: 10.1038/39767. [DOI] [PubMed] [Google Scholar]
- 11.Scott KP, Melville CM, Barbosa TM, Flint HJ. Occurrence of the new tetracycline resistance gene tet (W) in bacteria from the human gut. Antimicrobial Agents and Chemotherapy. 2000;44(3):775–777. doi: 10.1128/aac.44.3.775-777.2000. [DOI] [PMC free article] [PubMed] [Google Scholar]
- 12.Ammor MS, Flórez AB, van Hoek AHAM, et al. Molecular characterization of intrinsic and acquired antibiotic resistance in lactic acid bacteria and bifidobacteria. Journal of Molecular Microbiology and Biotechnology. 2008;14:6–15. doi: 10.1159/000106077. [DOI] [PubMed] [Google Scholar]
- 13.Smith MS, Yang RK, Knapp CW, et al. Quantification of tetracycline resistance genes in feedlot lagoons by real-time PCR. Applied and Environmental Microbiology. 2004;70(12):7372–7377. doi: 10.1128/AEM.70.12.7372-7377.2004. [DOI] [PMC free article] [PubMed] [Google Scholar]
- 14.Manuzon MY, Hanna SE, Luo H, Yu Z, Harper WJ, Wang HH. Quantitative assessment of the tetracycline resistance gene pool in cheese samples by real-time TaqMan PCR. Applied and Environmental Microbiology. 2007;73(5):1676–1677. doi: 10.1128/AEM.01994-06. [DOI] [PMC free article] [PubMed] [Google Scholar]
- 15.Aminov RI, Garrigues-Jeanjean N, Mackie RI. Molecular ecology of tetracycline resistance: development and validation of primers for detection of tetracycline resistance genes encoding ribosomal protection proteins. Applied and Environmental Microbiology. 2001;67(1):22–32. doi: 10.1128/AEM.67.1.22-32.2001. [DOI] [PMC free article] [PubMed] [Google Scholar]
- 16.Chee-Sanford JC, Aminov RI, Krapac IJ, Garrigues-Jeanjean N, Mackie RI. Occurrence and diversity of tetracycline resistance genes in lagoons and groundwater underlying two swine production facilities. Applied and Environmental Microbiology. 2001;67(4):1494–1502. doi: 10.1128/AEM.67.4.1494-1502.2001. [DOI] [PMC free article] [PubMed] [Google Scholar]
- 17.Yu Z, Michel FC, Jr., Hansen G, Wittum T, Morrison M. Development and application of real-time PCR assays for quantification of genes encoding tetracycline resistance. Applied and Environmental Microbiology. 2005;71(11):6926–6933. doi: 10.1128/AEM.71.11.6926-6933.2005. [DOI] [PMC free article] [PubMed] [Google Scholar]
- 18.Diaz-Torres ML, McNab R, Spratt DA, et al. Novel tetracycline resistance determinant from the oral metagenome. Antimicrobial Agents and Chemotherapy. 2003;47(4):1430–1432. doi: 10.1128/AAC.47.4.1430-1432.2003. [DOI] [PMC free article] [PubMed] [Google Scholar]
- 19.Seville LA, Patterson AJ, Scott KP, et al. Distribution of tetracycline and erythromycin resistance genes among human oral and fecal metagenomic DNA. Microbial Drug Resistance. 2009;15(3):159–166. doi: 10.1089/mdr.2009.0916. [DOI] [PubMed] [Google Scholar]
- 20.Sommer MOA, Dantas G, Church GM. Functional characterization of the antibiotic resistance reservoir in the human microflora. Science. 2009;325(5944):1128–1131. doi: 10.1126/science.1176950. [DOI] [PMC free article] [PubMed] [Google Scholar]
- 21.Patterson AJ, Colangeli R, Spigaglia P, Scott KP. Distribution of specific tetracycline and erythromycin resistance genes in environmental samples assessed by macroarray detection. Environmental Microbiology. 2007;9(3):703–715. doi: 10.1111/j.1462-2920.2006.01190.x. [DOI] [PubMed] [Google Scholar]
- 22.Delgado S, Fracchetti F, Mayo B, Torriani S. Development and validation of a multiplex PCR-based DNA microarray hybridisation method for detecting bacterial antibiotic resistance genes in cheese. International Dairy Journal. 2011;21(3):149–157. [Google Scholar]
- 23.Forsberg KJ, Reyes A, Wang B, Selleck EM, Sommer MOA, Dantas G. The shared antibiotic resistome of soil bacteria and human pathogens. Science. 2012;337(6098):1107–1111. doi: 10.1126/science.1220761. [DOI] [PMC free article] [PubMed] [Google Scholar]
- 24.Mullany P, Allan E, Warburton PJ. Tetracycline resistance genes and mobile genetic elements from the oral metagenome. Clinical Microbiology and Infection. 2012;18(4):58–61. doi: 10.1111/j.1469-0691.2012.03858.x. [DOI] [PubMed] [Google Scholar]
- 25.Barbosa TM, Scott KP, Flint HJ. Evidence for recent intergeneric transfer of a new tetracycline resistance gene, tet(W), isolated from Butyrivibrio fibrisolvens, and the occurrence of tet(O) in ruminai bacteria. Environmental Microbiology. 1999;1(1):53–64. doi: 10.1046/j.1462-2920.1999.00004.x. [DOI] [PubMed] [Google Scholar]
- 26.Gevers D, Huys G, Swings J. In vitro conjugal transfer of tetracycline resistance from Lactobacillus isolates to other gram-positive bacteria. FEMS Microbiology Letters. 2003;225(1):125–130. doi: 10.1016/S0378-1097(03)00505-6. [DOI] [PubMed] [Google Scholar]
- 27.Roberts MC, Chung WO, Roe D, et al. Erythromycin-resistant Neisseria gonorrhoeae and oral commensal Neisseria spp. carry known rRNA methylase genes. Antimicrobial Agents and Chemotherapy. 1999;43(6):1367–1372. doi: 10.1128/aac.43.6.1367. [DOI] [PMC free article] [PubMed] [Google Scholar]
- 28.Denman SE, McSweeney CS. Development of a real-time PCR assay for monitoring anaerobic fungal and cellulolytic bacterial populations within the rumen. FEMS Microbiology Ecology. 2006;58(3):572–582. doi: 10.1111/j.1574-6941.2006.00190.x. [DOI] [PubMed] [Google Scholar]
- 29.Flórez AB, Delgado S, Mayo B. Antimicrobial susceptibility of lactic acid bacteria isolated from a cheese environment. Canadian Journal of Microbiology. 2005;51(1):51–58. doi: 10.1139/w04-114. [DOI] [PubMed] [Google Scholar]
- 30.Flórez AB, Mayo B. Microbial diversity and succession during the manufacture and ripening of traditional, Spanish, blue-veined Cabrales cheese, as determined by PCR-DGGE. International Journal of Food Microbiology. 2006;110(2):165–171. doi: 10.1016/j.ijfoodmicro.2006.04.016. [DOI] [PubMed] [Google Scholar]
- 31.Flórez AB, Ammor MS, Álvarez-Martín P, Margolles A, Mayo B. Molecular analysis of tet(W) gene-mediated tetracycline resistance in dominant intestinal Bifidobacterium species from healthy humans. Applied and Environmental Microbiology. 2006;72(11):7377–7379. doi: 10.1128/AEM.00486-06. [DOI] [PMC free article] [PubMed] [Google Scholar]
- 32.Salyers AA, Gupta A, Wang Y. Human intestinal bacteria as reservoirs for antibiotic resistance genes. Trends in Microbiology. 2004;12(9):412–416. doi: 10.1016/j.tim.2004.07.004. [DOI] [PubMed] [Google Scholar]
- 33.Devirgiliis C, Caravelli A, Coppola D, Barile S, Perozzi G. Antibiotic resistance and microbial composition along the manufacturing process of Mozzarella di Bufala Campana. International Journal of Food Microbiology. 2008;128(2):378–384. doi: 10.1016/j.ijfoodmicro.2008.09.021. [DOI] [PubMed] [Google Scholar]
- 34.Cain CL. Antimicrobial resistance in staphylococci in small animals. Veterinary Clinics of North America: Small Animal Practice. 2013;43(1):19–40. doi: 10.1016/j.cvsm.2012.09.003. [DOI] [PubMed] [Google Scholar]
- 35.Zhao C, Sun H, Wang H, et al. Antimicrobial resistance trends among 5608 clinical Gram-positive isolates in China: results from the Gram-Positive Cocci Resistance Surveillance program (2005–2010) Diagnostic Microbiology and Infectious Disease. 2012;73(2):174–181. doi: 10.1016/j.diagmicrobio.2012.03.003. [DOI] [PubMed] [Google Scholar]
- 36.McGowan-Spicer LL, Fedorka-Cray PJ, Frye JG, Meinersmann RJ, Barrett JB, Jackson CR. Antimicrobial resistance and virulence of Enterococcus faecalis isolated from retail food. Journal of Food Protection. 2008;71(4):760–769. doi: 10.4315/0362-028x-71.4.760. [DOI] [PubMed] [Google Scholar]
- 37.Li X, Li Y, Alvarez V, Harper WJ, Wang HH. Effective antibiotic resistance mitigation during cheese fermentation. Applied and Environmental Microbiology. 2011;77(20):7171–7175. doi: 10.1128/AEM.05069-11. [DOI] [PMC free article] [PubMed] [Google Scholar]
- 38.Wang HH, Schaffner DW. Antibiotic resistance: how much do we know and where do we go from here? Applied and Environmental Microbiology. 2011;77(20):7093–7095. doi: 10.1128/AEM.06565-11. [DOI] [PMC free article] [PubMed] [Google Scholar]
- 39.Chen J, Yu Z, Michel FC, Jr., Wittum T, Morrison M. Development and application of real-time PCR assays for quantification of erm genes conferring resistance to macrolides-lincosamides-streptogramin B in livestock manure and manure management systems. Applied and Environmental Microbiology. 2007;73(14):4407–4416. doi: 10.1128/AEM.02799-06. [DOI] [PMC free article] [PubMed] [Google Scholar]
- 40.Kim S-M, Kim HC, Lee S-WS. Characterization of antibiotic resistance determinants in oral biofilms. Journal of Microbiology. 2011;49(4):595–602. doi: 10.1007/s12275-011-0519-1. [DOI] [PubMed] [Google Scholar]
- 41.Zhang L, Kinkelaar D, Huang Y, Li Y, Li X, Wang HH. Acquired antibiotic resistance: are we born with it? Applied and Environmental Microbiology. 2011;77(20):7134–7141. doi: 10.1128/AEM.05087-11. [DOI] [PMC free article] [PubMed] [Google Scholar]
- 42.Guarddon M, Miranda JM, Rodríguez JA, Vázquez BI, Cepeda A, Franco CM. Real-time polymerase chain reaction for the quantitative detection of tetA and tetB bacterial tetracycline resistance genes in food. International Journal of Food Microbiology. 2011;146(3):284–289. doi: 10.1016/j.ijfoodmicro.2011.02.026. [DOI] [PubMed] [Google Scholar]
- 43.Feld L, Schjørring S, Hammer K, et al. Selective pressure affects transfer and establishment of a Lactobacillus plantarum resistance plasmid in the gastrointestinal environment. Journal of Antimicrobial Chemotherapy. 2008;61(4):845–852. doi: 10.1093/jac/dkn033. [DOI] [PubMed] [Google Scholar]
- 44.Jacobsen L, Wilcks A, Hammer K, Huys G, Gevers D, Andersen SR. Horizontal transfer of tet(M) and erm(B) resistance plasmids from food strains of Lactobacillus plantarum to Enterococcus faecalis JH2-2 in the gastrointestinal tract of gnotobiotic rats. FEMS Microbiology and Ecology. 2007;59(1):158–166. doi: 10.1111/j.1574-6941.2006.00212.x. [DOI] [PubMed] [Google Scholar]
Associated Data
This section collects any data citations, data availability statements, or supplementary materials included in this article.
Supplementary Materials
Supplementary Table 1 summarizes updated tetracycline and erythromycin resistance genes which were compiled for designing primers for the qPCR analyses. Nucleotide sequences were downloaded from the GenBank database and aligned with one another using Mega 5 Software.