

Abstract
In this paper, we propose a novel algorithm, based on stroke components and descriptive Gabor filters, to detect text regions in natural scene images. Text characters and strings are constructed by stroke components as basic units. Gabor filters are used to describe and analyze the stroke components in text characters or strings. We define a suitability measurement to analyze the confidence of Gabor filters in describing stroke component and the suitability of Gabor filters on an image window. From the training set, we compute a set of Gabor filters that can describe principle stroke components of text by their parameters. Then a K -means algorithm is applied to cluster the descriptive Gabor filters. The clustering centers are defined as Stroke Gabor Words (SGWs) to provide a universal description of stroke components. By suitability evaluation on positive and negative training samples respectively, each SGW generates a pair of characteristic distributions of suitability measurements. On a testing natural scene image, heuristic layout analysis is applied first to extract candidate image windows. Then we compute the principle SGWs for each image window to describe its principle stroke components. Characteristic distributions generated by principle SGWs are used to classify text or nontext windows. Experimental results on benchmark datasets demonstrate that our algorithm can handle complex backgrounds and variant text patterns (font, color, scale, etc.).
Keywords: Gabor Filter, Stroke Component, Suitability Measurement, Stroke Gabor Words, SGW Characteristic Distributions
I. Introduction
Camera captured text information in natural scene images can serve as indicative marks in many image-based applications such as assistive navigation, auxiliary reading, image retrieval, scene understanding, etc. Different from the scanned document images [1, 11], extracting text from natural scene images is a challenging problem because of complex backgrounds and large variations of text patterns such as font, color, scale, and orientation.
Many optical-character-recognition (OCR) systems, either open source or commercial software, have been developed to recognize text by taking character corners or junctions as feature points of learning and matching on scanned documents. But these OCR systems cannot automatically filter out variant background outliers in natural scene images. When a raw natural scene image is input into an OCR system, the text recognition rate is often very low. Therefore, to extract text from natural scene images, text detection is an essential step to compute the image sub-regions containing text characters or strings.
Many rule-based algorithms have been proposed for text detection [6, 12, 18]. They extracted text characters and strings by using gradient-based and color-based local features, including minimum size, aspect ratio, edge point density, gradient distribution, color uniformity and stroke width consistency. But these features are sensitive to variant text patterns and background outliers that resemble text characters. Many researchers applied a machine learning model to solve the problems of text detection. Chen et al. [3] developed an Adaboost learning framework by using selected Haar features, joint histogram of intensity and intensity gradient, and distribution of edge points as features to train classifiers. Pan et al. [16] extracted segments of character boundaries as features and employed a K-SVD based learning model to detect text. Hu et al. [7] presented an adaptive Frechet Kernel based support vector machine (SVM) for text detection. Kumar et al. [9] established a set of globally matched wavelet filters as feature descriptors and used SVM and Fisher classifier to classify image windows as text or non-text. Generally, the patterns of tangible objects, such as face, human body and car, are stable for learning-based object detection. The dissimilarity between different training samples and testing samples is small enough or can be lowered by alignment and normalization. However these benefits are not applicable to text in natural scene images.
As basic element of text character and text string, stroke provides robust features for text detection in natural scene images. Text can be modeled as a combination of stroke components with a variety of orientations, and features of text can be extracted from combinations and distributions of the stroke components. In this paper, a novel algorithm is proposed to detect text regions by using Gabor filter responses to model the stroke components of text. It is able to handle complex backgrounds and variant text patterns. The contributions of this paper are: (1) A suitability measurement of Gabor filter to measure its confidence in stroke component description and its suitability for an image window. (2) Stroke Gabor Words for universal descriptions of stroke components. (3) A classification algorithm based on the characteristic distribution of suitability measurements generated by principle SGWs. The flowchart of our algorithm is presented in Fig. 1. In this paper, we use image window, a rectangle image sub-region with fixed aspect ratio, as a basic processing cell.
Figure 1.
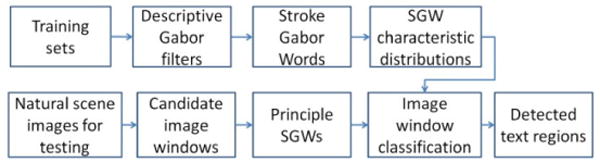
The flowchart of our algorithm.
II. Descritpive Gabor Filters
A. Gabor filter Descriptions of stroke components
We use Gabor filters to describe the stroke components in text characters or strings. Gabor filter was widely used for texture analysis and image representation [10, 20]. Gabor filter was also employed for segmentation in the document image [8, 17, 19]. In [4], Gabor filter is applied to obtain local features for text recognition after text detection and affine rectification. In [17], Gabor filter is used for script identification. A 2-D Gabor filter is a Gaussian kernel modulated by a sinusoidal carrier wave, as in (1) and (2). It gives responses to structure of line segment in scene images.
| (1) |
where
| (2) |
A Gabor filter bank is built in accordance with the 5 parameters < λ, θ, ψ, σ, γ >. Given an image window w(x, y), Gabor filter response r is obtained by convolution with a Gabor filter g from the filter bank. A Gabor filter g can be used to describe a stroke component as long as it generates the maximum energy of response among all the Gabor filters in the bank.
B. Suitability Measurement
The stroke component can be approximately reconstructed by its descriptive Gabor filter, but there exists errors between Gabor filter description and actual stroke component in image. To model the confidence of Gabor filters in describing stroke component, we define a suitability measurement based on binary Gabor filter response map BGR(w) and binary stroke map BSM(w). The Gabor filter response map BGR(w) is obtained by inserting an additional parameter t (0 ≤ t ≤ 1) into the Gabor filter to binarize the Gabor filter response map r, by (3).
| (3) |
where rmax represents the maximum value on the Gabor filter response map. Thus a Gabor filter g is denoted by a vector of the 6 parameters 〈λ, θ, ψ, σ, γ, t〉 (see Fig. 2(c-d)). The stroke map BSM(w)is obtained by labeling the pixels located in the torso of strokes. According to the definition in [6], stroke is a set of pixels in connecting paths of two edge pixels with approximately equal gradient magnitude and opposite gradient directions. On the basis of edge map and gradient map, we construct probe rays at each edge pixel along the gradient direction to find out the satisfied connecting paths. Then stroke map is obtained by assigning foreground value to pixels in these paths, as shown in Figure 2(b).
Figure 2.
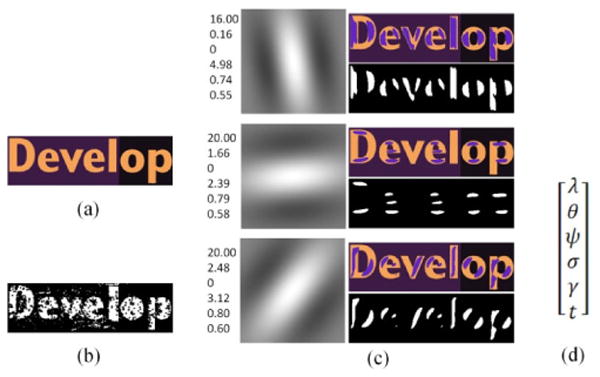
(a) Original image; (b) binary stroke map; (c) three Gabor filters marked with the parameter vectors and the corresponding binary Gabor filter response maps to display stroke components; (d) ordering of Gabor filter parameters listed in (c).
The suitability measurement D is defined as the pattern correlation between BGR(w; g) and BSW(w) by (4).
| (4) |
where the |·| represents the number of pixels with value 1 in the binary map. D(w; g) is in the range [0,1].
On a stroke component, D models the confidence of Gabor filters in stroke description. However, a text window usually includes a number of different stroke components. D(w; g) is used to model suitability of Gabor filter g for image window w. A large D(w; g) will be obtained as long as Gabor filter g has high confidence in describing a stroke component with high frequency of occurrence in image window w. This Gabor filter is said to be suitable for w, and this stroke is defined as principle stroke component of w. Text detection can be transformed into detection of principle stroke components.
III. Stroke Gabor Words
A. Training Set
From natural scene images with text regions manually labeled, we generate positive training samples by slicing each ground truth region vertically into overlapped windows with width-to-height ratio 2:1, as shown in Fig. 3(a). Each sample contains text in regular print patterns and they are normalized into fixed size, height 48 and width 96 pixels. From the same natural scene images, we generate negative training samples by the bounding boxes of non-text object boundaries. In addition, we take 1402 images covering multiple background scenes where text information might exist. But they do not include any text information. Negative samples are generated by randomly cutting out image windows with height 48 and width 96 pixels. The training set contains 2711 positive samples and 9208 negative samples in total. To ensure that maximum Gabor responses are generated at stroke components, all positive samples of this training set have higher stroke intensity than background intensity.
Figure 3.
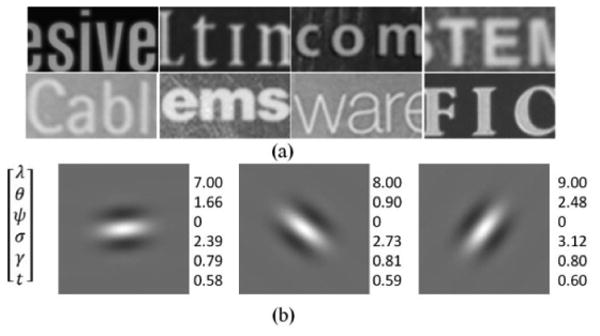
(a) Examples of text windows from positive training samples; (b) examples of SGWs with parameter lists on the right.
B. Stroke Gabor Words
We build a set of Gabor filters for universal description of stroke components from the training set. At first, the descriptive Gabor filters of principle stroke components are computed for each training sample wm. Principle stroke components serve as main bodies of text characters in an image window, so they are described by Gabor filters whose responses are compatible with stroke map of this window (see Fig. 2(c)). From the Gabor filter bank, we find out a set of Gabor filters generating maximum values of suitability measurement. In (5), the most suitable Gabor filter g* describes the most frequent principle stroke component in window wm. Then we build an ordered list of Gabor filters from the text window according to the suitability measurements. A threshold Tg is set to calculate the descriptive Gabor filters of principle stroke components that construct text in wm by (6).
| (5) |
| (6) |
We combine the descriptive Gabor filters from all positive samples, and weighted K -means is applied to cluster the parameter vectors of descriptive Gabor filters. The clustering centers are defined as Stroke Gabor Words (SGWs) denoted by S. Fig. 3(b) presents some example SGWs. The SGWs are Gabor filters serving as stroke basis for universal description of principle stroke components in the positive training samples.
Based on the suitability measurements, an image window can be mapped to an ordered list of SGWs. We can find out a subset of SGWs that describes the stroke components in the image window. They are defined as principle SGWs of image window wt, which have larger suitable measurements than the other SGWs, and we calculate them by (7) and (8).
| (7) |
| (8) |
where St is the set of principle SGWs for wt and s* is the most suitable SGW for wt. The set of principle SGWs compose a subset of the K SGWs. In our experiments, we set Tg = 0.95, K = 25, and Tdc = 0.975 to achieve the best performance. The principle SGWs and corresponding suitability measurements are features of an image window, which are used to classify it as either a text or non-text window.
C. Classification Algorithm Based on Principle SGWs
Text region detection requires localization to obtain preliminary image windows and classification to determine text windows and non-text windows. Heuristic layout analysis is performed to partition the scene image into a set of candidate image windows. It is based on the magnitude gradient difference in Laplacian map [18] and the adjacent character grouping to find out all possible fragments of text strings, which are three or more edge boundaries with approximately equal heights, distances and horizontal alignment [21].
Then we propose a novel classification algorithm based on distribution of suitability measurements of each SGW in training set to classify the candidate image windows as either text or non-text windows. Each SGW is able to give a vote of image window classification according to statistics of its suitability measurements on training samples. On the positive samples, most values of SGW suitability measurements are distributed in the range (0.55, 0.7). Inspired by the Rayleigh nature of Gabor filter outputs in the texture analysis [2], we employ a mirror reversed Rayleigh distribution to model the statistical results of suitability measurements from positive samples.
| (9) |
where NP is the size of positive training samples and σP is a parameter whose maximum likelihood is . On the negative samples, suitability measurements are irregularly distributed in the range [0, 1] because the negative training samples contains multiple patterns without any constraints. Thus we use the Gaussian distribution to model the statistical results of suitability measurements from negative samples.
| (10) |
where μN and σN are mean and variance which can be estimated by maximum likelihood. As shown in Fig. 4, Ps(D) and Ns(D) are characteristic distributions of the SGW. They indicate the probability that an image window will be classified as text window or non-text window by SGW s.
Figure 4.
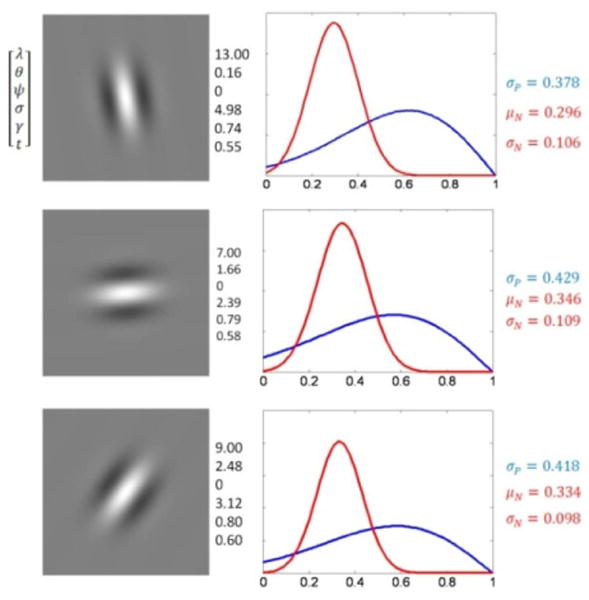
Three SGWs and corresponding characteristic distributions. The mirror reversed Rayleigh distribution on positive training samples is marked in blue and the Gaussian distribution on negative training samples is marked in red.
If an image window wt contains text information, its principle SGWs give positive votes. The corresponding suitability measurements should be mapped to high probability in the mirror reversed Rayleigh distributions and to low probability in the Gaussian distributions. If Ps(D(wt; si)) ≥ Ps(μP − 0.3σP) where μP = 1 − 1.253σP or Ns(D(wt; si)) ≤ Ns(μN + σN), the principle SGW si gives a positive vote value 1, otherwise it gives a negative vote value -1. A weighted sum of the votes of all principle SGWs is calculated to make image window classification by (11).
| (11) |
where Vi denotes the vote values and denotes the weights.
Background outliers such as bricks, window grids or some stripe texture are probably classified as text regions because they also generate similar SGW suitability measurements as text characters. To filter out the false positive detection, we employ the number of dominant colors and foreground connected components in an image window to make further classification. Color reduction based on [15] is performed to group the pixels with similar colors together, and the color corresponding to the most pixels is set as background color. In general, a true positive text window contains exactly two colors including background and foreground characters, and each character forms a connected component. In our algorithm, we define that text window after color reduction contains no less than 2 and no more than 4 colors, and the number of foreground connected components should be greater than 1 and smaller than 7. When a group of neighboring image windows had been classified as text windows, they would be merged into text regions as results of text detection.
IV. Experiments
A. Datasets
We evaluate the proposed algorithm on two datasets. The first one is ICDAR 2003 Robust Reading Dataset. It contains 509 images in total, in which the first 258 images are used for training and the rest 251 images are used for testing. The image sizes range from 640×480 to 1600×1200. There are 2258 ground truth text regions in total. The second dataset is provided by [6]. There are 307 images containing 1981 ground truth text regions in total. The image sizes range from 1024×764 to 1024×1360. The natural scene images in this dataset present a more challenging background. The height of 901 ground truth text regions is less than 20 pixels.
B. Results and Discussions
We evaluate the performance of our algorithm by comparing the detected text regions with the ground truth text regions. We define “precision” as the ratio of area of the true positive extracted text regions to area of the detected regions, and “recall” as the ratio of area of the true positive extracted text regions to area of the ground truth regions. Here area means the number of pixels in the image region. “f-measure” is defined as the combination of precision and the recall by the harmonic mean.
On the Robust Reading Dataset, the testing images are used to evaluate the performance of our algorithm. Since adjacent character grouping in the process of layout analysis cannot cover text strings with less than three character members, we eliminate images whose ground truth text regions contain less than three text characters. Thus 236 testing images are chosen for performance evaluation. To keep consistent with higher stroke intensity than background in training samples, two rounds of text detections are performed for each testing image based on gray image and inverse gray image respectively. The better result is used to evaluate algorithm performance. The evaluation results are calculated from average measures of all testing images, precision 0.64, recall 0.76, and f-measure 0.68. By comparison with the state-of-the-art algorithms, our method achieves the best performance of recall and f-measure in this experiment. Some examples of detected text regions are shown in Fig. 5.
Figure 5.
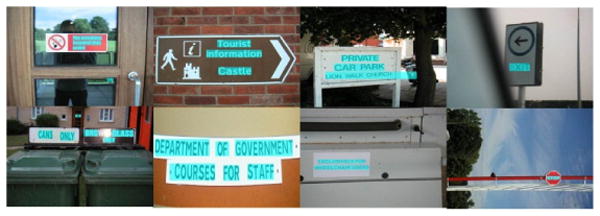
Some example results of text string detection on the Robust Reading Dataset. The detected regions are marked in cyan.
On the other dataset, text windows obtained from the ground truth regions of the first 150 images are added into the training set as positive samples. The text detection is then performed on the whole 307 images of this dataset. By using the same measures, we obtain precision 0.49, recall 0.60, and f-measure 0.42. Our results are close to precision 0.54, recall 0.42, and f-measure 0.47 presented in [6]. To improve the precision, a more robust model of SGW evaluations on negative samples should be developed to handle the complex background outliers that resemble text structure in the future, rather than a naive normal distribution. Fig. 6 presents some examples of detected text regions.
Figure 6.
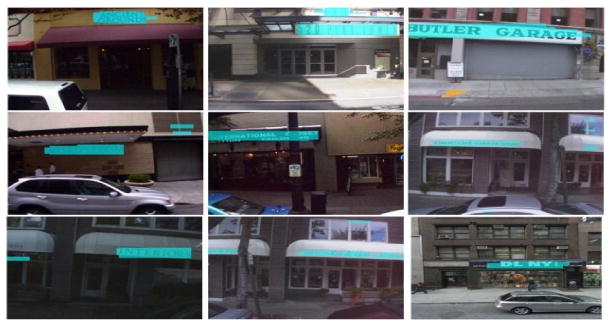
Some example results of text detection on the Dataset provided by [6]. The detected regions are marked in cyan.
C. Conclusion and future work
We have presented a novel algorithm to detect text regions in natural scene images. First, we use Gabor filter to describe stroke component and define a suitability measurement to model the confidence of Gabor filter description of strokes. Second, we carried out the statistical analysis on the stroke components of text from training sets to obtain SGWs, which are used as the universal description of principle stroke components. Third, characteristic distributions are established for each SGW by using the Rayleigh model to describe suitability statistics on positive training samples and the Gaussian model to describe suitability statistics on negative training samples. Image window classification is performed based on characteristic distributions of the principle SGWs. The experimental results demonstrated that our algorithm performed well on backgrounds and variant text patterns, and outperforms the state of the art algorithms for text extraction from natural scene images. Our SGW model demonstrates the statistical stationarity of the stroke components of text. In the future, we will develop more effective suitability measurements and more robust models to describe the SGW suitability statistics on the negative training samples. Furthermore, we will extend our algorithm to detect text with non-horizontal orientations or on deformed surfaces.
Acknowledgments
This work was supported in part by NIH Grant 1R21EY-020990, NSF Grant IIS-0957016, and ARO Grant W911NF-09-1-0565.
Contributor Information
Chucai Yi, Dept. of Computer Science, The Graduate Center, City Univ. of New York, New York, U.S.A., CYi@gc.cuny.edu.
Yingli Tian, Dept. of Electrical Engineering, The City College and Graduate Center, City Univ. of New York, New York, U.S.A., ytian@ccny.cuny.edu.
References
- 1.Banerjee J, Namboodiri AM, Jawahar CV. Contextual restoration of severely degraded document images. Proceedings of IEEE CVPR. 2009:517–524. [Google Scholar]
- 2.Bhagavathy S, Tesic J, Manjunath BS. On the Rayleigh nature of Gabor filter outputs. ICIP. 2003 [Google Scholar]
- 3.Chen X, Yuille AL. Detecting and reading text in natural scenes. CVPR. 2004;2:II-366–II-373. [Google Scholar]
- 4.Chen X, Yang J, Zhang J, Waibel A. Automatic detection and recognition of signs from natural scenes. IEEE Transactions on image processing. 2004;13(1):87–99. doi: 10.1109/tip.2003.819223. [DOI] [PubMed] [Google Scholar]
- 5.Daugman JG. Two-dimensional spectral analysis of cortical receptive field profiles. Vision Res. 1980;20(10):847–56. doi: 10.1016/0042-6989(80)90065-6. [DOI] [PubMed] [Google Scholar]
- 6.Epshtein B, Ofek E, Wexler Y. Detecting text in natural scenes with stroke width transform. CVPR. 2010:2963–2970. [Google Scholar]
- 7.Hu S, Chen M. Adaptive Frechet kernel based support vector machine for text detection. ICASSP'05. 2005;5:365–368. [Google Scholar]
- 8.Jain AK, Bhattacharjee S. Text segmentation using Gabor filters for automatic document processing. Machine Vision and Applications. 1992;5(3):169–184. [Google Scholar]
- 9.Kumar S, Gupta R, Khanna N, Chaudhury S, Joshi SD. Text Extraction and Document Image Segmentation Using Matched Wavelets and mrf Model. IEEE Trans on Image Processing. 2007;16(8):2117–2128. doi: 10.1109/tip.2007.900098. [DOI] [PubMed] [Google Scholar]
- 10.Lee TS. Image representation using 2d Gabor wavelets. IEEE Transactions on PAMI. 1996;18(10) [Google Scholar]
- 11.Liang J, DeMenthon D, Doermann D. Geometric Rectification of Camera-captured Document Images. IEEE Transactions on PAMI. 2008;30(4):591–605. doi: 10.1109/TPAMI.2007.70724. [DOI] [PubMed] [Google Scholar]
- 12.Liu Q, Jung C, Moon Y. Text Segmentation based on Stroke Filter. Proceedings of International Conference on Multimedia. 2006:129–132. [Google Scholar]
- 13.Lucas SM, Panaretos A, Sosa L, Tang A, Wong S, Young R. ICDAR 2003 Robust Reading Competitions. ICDAR. 2003 [Google Scholar]
- 14.Lucas SM. ICDAR 2005 text locating competition results. Proceedings of the ICDAR. 2005;1:80–84. [Google Scholar]
- 15.Nikolaou N, Papamarkos N. Color Reduction for Complex Document Images. International Journal of Imaging Systems and Technology. 2009;19:14–26. [Google Scholar]
- 16.Pan W, Bui TD, Suen CY. Text detection from scene images using sparse representation. ICPR. 2008 [Google Scholar]
- 17.Pan W, Suen C, Bui T. Script Identification Using Steerable Gabor Filters. Proc of ICDAR. 2005 [Google Scholar]
- 18.Phan T, Shivakumara P, Tan CL. A Laplacian Method for Video Text Detection. Proc of ICDAR. 2009:66–70. [Google Scholar]
- 19.Qiao YL, Li M, Lu ZM, Sun SH. Gabor filter based text extraction from digital document images. IIH-MSP'06. 2006:297–300. [Google Scholar]
- 20.Sandler R, Lindenbaum M. Optimizing Gabor Filter Design for Texture Edge Detection and Classification. Int Journal Computer Vision. 2009;84:308–324. [Google Scholar]
- 21.Yi C, Tian Y. Text string detection from natural scene s by structure-based partition and grouping. IEEE Transactions on Image Processing. 2011 doi: 10.1109/TIP.2011.2126586. [DOI] [PMC free article] [PubMed] [Google Scholar]