Introduction
Accurate knowledge of the specific absorption rate (SAR) during an MRI scan is vitally important for patient safety (1). Precise measurement of the total power deposited in the body enables correct SAR prediction and monitoring. The existence of many cases of scanner-associated RF burns reported to the FDA (2), and the irreproducibility of scanner-reported SAR for implanted devices (3), suggests that accurate scanner-independent measures of RF power deposition/exposure during MRI are needed (4).
Monitoring power delivered to the body by the scanner is complicated because of losses in the RF transmission chain elements including cables, switches, quadrature-hybrid (Q-Hybrid) plus coil losses. Another challenge is that MRI RF signals have a high dynamic range of peak vs average power, as well as a low duty cycle, that hamper commercial power meter operation and consequent power measurements.
In this study we characterize losses in an RF power chain for a 1H body coil in a 3T clinical scanner. RF power in the transmission chain was measured for four volunteers of different body mass indices (BMI) and weights.
Methods and results
A 4395A Hewlett Packard network analyzer was used to measure attenuation at each stage of the RF chain of a Philips 3T Achieva MRI scanner as shown in Figure 1. Measurement of these components shows that only about 59% of the power should be observed at the outputs of the Q-Hybrid. Losses in the body coil, balun and remaining cables (D, E) were determined from power measurements.
Figure 1.

Schematic of the RF power delivery chain on a Philips scanner. Shown above are measured cable attenuation factors (A, B, C), the filter box penetrating the scanner's Faraday cage, the transmit switch (TR-SW) and the Q-Hybrid.
50dB dual directional couplers were used to measure forward (F) and reverse (R) power at the output of the amplifier and at the outputs of the Q-hybrid which feed the body coil. A power profiling meter (Ladybug Technologies LLC, LB480A) was used to sample the pulse profiles at 10μs resolution. Pulse profiles were stored for average power calculations.
For each subject, the scanner first optimizes its power level using a reference B1 sensed by a pickup coil located within the scanner housing. The B1 is finally adjusted to the required flip angle by cycling through several MR signal acquisitions. For our measurements, the amplifier driving parameters were stored for each subject to yield the same power for all scans which used the same pulse shapes and duty cycles. Body coil losses were determined from the power required to scan a 1L bottle of mineral oil (no losses) with a current in the body coil adjusted to produce a desired B1 as detected by the pickup coil.
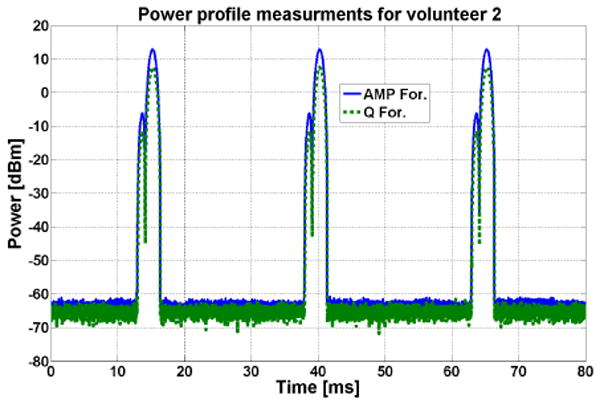
Figure 2 shows the power profile of RF pulses measured at the directional coupler (attenuated by 50dB). Results for the power deposited in 4 volunteers are summarized in Table 1. The measured delivered power at the Q-Hybrid output is 57±2%, in agreement with the attenuation measurements. Including body coil loss, the actual power deposited (PD) in the body is <50% of the supplied power. The actual PD varied between 46% and 83% (final column) of the scanner's estimated PD (weight x whole-body SAR).
Figure 2.

An example of the power profile for Vol2. A field echo sequence is used with TR = 25ms.
Table 1.
Average RF Power and Power Deposition (PD). F=forward. R=reverse. RF Amp (W) is power reported by scanner.
| BMI | RF AMP (W) | RP Amp Meas (W) | I Channel F-R (W) | Q Channel F-R (W) | Power to coil | Power Lost in coil | Scanner predicted PD | Meas PD (W) | Imaging subject PD fraction | |
|---|---|---|---|---|---|---|---|---|---|---|
| 1Lbottle | ---- | 23.5 | 22.3 | 6.2-3.0 | 6.5-2.7 | 56.9% | 100.0% | ---- | ---- | ---- |
| Vol 1 | 24.3 | 46.5 | 43.8 | 11.2-0.2 | 12.0-3.2 | 52.9% | 31.7% | 29.2 | 13.5 | 46% |
| Vol 2 | 40.1 | 76.5 | 72.4 | 21.1-0.4 | 20.9-0.6 | 58.0% | 18.1% | 40.5 | 33.6 | 83% |
| Vol 3 | 22.7 | 35.5 | 33.0 | 9.9-0.3 | 9.6-1.6 | 59.1% | 35.2% | 21.6 | 11.4 | 53% |
| Vol 4 | 23.9 | 37.5 | 36.9 | 10.3-0.2 | 10.2-2.1 | 55.6% | 35.6% | 21.5 | 11.7 | 55% |
Discussion
Determining the true delivered power in the body is a challenge. Because of cable, RF coil and other losses, the power reaching subjects in this scanner was less than 50% of supplied transmitter power. Perhaps to err on the safe side, the scanner's estimated whole-body SAR significantly overstates the actual RF power. This means that scanner estimated SAR is not an accurate indicator of power exposure in MRI. We are currently developing a system to automate accurate power measurements on the scanner.
Acknowledgments
Support: NIH grant R01 EB007829.
References
- 1.Bottomley PA, et al. Med Phys. 1981;8:510–512. doi: 10.1118/1.595000. [DOI] [PubMed] [Google Scholar]
- 2.http://www.accessdata.fda.gov/scripts/cdrh/cfdocs/cfMAUDE/search.CFM.
- 3.Baker KB, et al. JMRI. 2006;24:1236–1242. doi: 10.1002/jmri.20769. [DOI] [PubMed] [Google Scholar]
- 4.Stralka JP, et al. JMRI. 2007;26:1296–1302. doi: 10.1002/jmri.21141. [DOI] [PMC free article] [PubMed] [Google Scholar]


