

Abstract
Dietary supplements are a multi-billion dollar business, with yearly profit increases. Allegedly safe, these supplements are marketed to a variety of niches, encompassing claims from immune support to weight loss. Six sports nutrition supplements were acquired that were labeled to contain the furanocoumarin(s) bergamottin and/or 6′,7′-dihydroxybergamottin (DHB), both of which are potent irreversible inhibitors of the prominent drug metabolizing enzyme cytochrome P450 3A (CYP3A). Both furanocoumarins are typically present in grapefruit juice, which has been shown to inhibit intestinal CYP3A, perpetrating an increase in the systemic exposure of certain concomitant ‘victim’ drugs. The acquired supplements were analyzed using ultra-performance liquid chromatography coupled to both a photodiode array (PDA) detector and a triple quadrupole mass spectrometer (MS). Contrary to the product labeling, four of the supplements contained no detectable quantities of either furanocoumarin (LOD 0.060 μg/capsule), while two of the supplements contained minimal amounts (one contained 12.13 (± 0.23) μg bergamottin and 65.51 (± 0.64) μg DHB per capsule; the other contained 2.705 (± 0.069) μg bergamottin per capsule and no detectable quantities of DHB). A CYP3A inhibition bioassay was used to assess whether the actual content of the furanocoumarins correlated with CYP3A inhibitory activity. Despite the low amounts of bergamottin and DHB, CYP3A inhibition by the supplements was greater than could be accounted for by the two furanocoumarins. The additional activity suggests the presence of other potent or highly abundant CYP3A inhibitors.
Keywords: dietary supplement, furanocoumarin, quantitation, bergamottin, dihydroxybergamottin, grapefruit juice
1. Introduction
Dietary supplements are a thriving industry in the United States, surpassing $30 billion in sales in 2011 [1] and encompassing various facets of the market. They can include single- or multi-vitamins, minerals, herbs and botanicals [2], weight-loss aids, and sports nutrition products. Of these, sports nutrition supplements represented 12% of the total sales [1, 3]. Some of these supplements are labeled to contain bergamottin and/or 6′,7′-dihydroxybergamottin (DHB) (Fig. 1), two furanocoumarins found in grapefruit juice that have been shown to interfere with cytochrome P450 3A (CYP3A) in the intestine through irreversible inhibition of the enzyme [4-7].
Fig. 1.
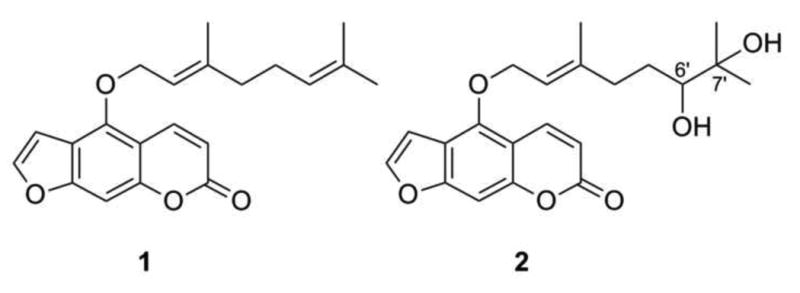
Bergamottin (1) and 6′, 7′-dihydroxybergamottin (DHB; 2)
Intestinal CYP3A contributes significantly to the pre-systemic (‘first-pass’) metabolism of numerous orally-administered drugs, including felodipine, lovastatin, and cyclosporine [6-9]. Inhibition of intestinal CYP3A by furanocoumarins in grapefruit juice can increase the systemic exposure of these ‘victim’ drugs to an extent that leads to side effects ranging from relatively mild (e.g., hypotension and dizziness with some calcium channel blockers) to potentially severe (e.g., nephrotoxicity with some immunosuppressants). CYP3A also is involved in the oxidative metabolism of both endogenous and exogenous androgens, including testosterone [10] and synthetic steroids marketed as body building supplements. For example, two synthetic steroids in the supplements Finaflex 1-Andro and Finaflex 1-Alpha include 3-hydroxy-5α-androst-1-ene-17-one and 3-enanthoxy-5α-androst-1-ene-17-one, respectively. These additives are sold as mixtures labeled to contain bergamottin and/or DHB, allegedly enhancing the effect of the steroids by “mak[ing] the active ingredient more bio-available” (Finaflex 1-Andro). At least one supplement, SciFit DHB 300, was labeled to contain 300 mg of pure DHB in each capsule and was presumably intended to be taken concomitantly with other products of the consumer's choice. Grapefruit juice contains between 2.5 and 36.3 μM bergamottin and 0.2 and 89.0 μM DHB [11-13], equating to between 0.2 to 2.9 mg bergamottin and 0.02 to 7.4 mg DHB per 8-oz (240-mL) serving. Grapefruit juice containing 2.2 mg bergamottin and 2.7 mg DHB per 240-mL serving doubled median area under the curve of felodipine relative to control [6]. Supplements containing bergamottin or DHB at similar amounts may pose a risk for consumers taking concomitant medications that undergo extensive CYP3A-mediated intestinal metabolism [6-9].
Other dietary supplements have been shown to modulate drug metabolism with subsequent unwanted effects, most notably Hypericum perforatum L. (St. John's wort). Opposite to grapefruit juice, St. John's wort induces the expression [14] of intestinal (and hepatic) CYP3A, as well as P-glycoprotein (P-gp), an apically-located transmembrane efflux protein that transports susceptible substrates back into the intestinal lumen or into bile [15]. Induction of CYP3A and P-gp can decrease significantly the systemic exposure and efficacy of diverse drugs, including oral contraceptives, cyclosporine, and methadone [16-19]. The risk of dietary supplement-drug interactions is exacerbated by both the lack of pre- and post-launch scrutiny of supplements [2, 20], as well as chronic underreporting of supplement use by patients [21-24].
To address the possibility of dietary substance-drug interactions perpetrated by supplements containing bergamottin and/or DHB, both quantitative analysis and a CYP3A inhibitory activity bioassay were employed. The quantification method utilized ultra-performance liquid chromatography (UPLC) for rapid (3.0 min) separation of the supplement extracts, coupled to both a photodiode array (PDA) detector and a triple quadrupole mass spectrometer (MS) for quantification. Based on a previously published study [13], this method was refined for rapid analysis and made use of the MS to identify more easily the analyte peaks in the complex extracts. The quantification method was used to evaluate the labeled vs. actual content of bergamottin and DHB in selected supplements. The bioassay was used to assess whether the actual content of the furanocoumarins correlated with CYP3A inhibitory activity.
2. Materials and methods
2.1. Materials and Chemicals
Bergamottin was purchased from ChromaDex (Irvine, CA; purity ≥ 96.9%) and Sigma-Aldrich (St. Louis, MO; purity ≥ 98.0); DHB was purchased from Cayman Chemical (Ann Arbor, MI; purity ≥ 98.0%) and Sigma-Aldrich (purity ≥ 97.2%). Midazolam (purity ≥ 99.9%), 1′-hydroxymidazolam (purity ≥ 98.0%), ketoconazole (purity ≥ 98.0%), alprazolam (purity ≥ 99.0%), and NADPH were purchased from Sigma-Aldrich. Purity of standards is reported as determined by HPLC (TLC in the case of alprazolam) by the manufacturers. A not-from-concentrate grapefruit juice (Simply Grapefruit, Simply Orange Juice Co., Apopka FL; lot AMC3 E 01:13) was purchased from a local grocery store. Methanol (MeOH) was purchased from Pharmco-Aaper (Shelbyville, KY) and Fischer Scientific (Waltham, MA). UPLC-grade water (H2O) and acetonitrile (CH3CN) were purchased from Fisher Scientific. Pooled human intestinal microsomes (HIM) (n = 18 donors) were purchased from Xenotech (Lenexa, KS).
2.2. Supplements Analyzed
Six supplements labeled to contain bergamottin and/or DHB were selected: SciFit DHB 300 (SciFit, Oakmont PA; lot 57454), Trisorbagen (Anabolic Xtreme, Tempe AZ; lot 202609), Xceler8 DHB (VitaSport, Chino Hills CA; lot US 37700), AttentionLink (Hi-Tech Pharmaceuticals, Inc., Norcross GA; lot 08132039), Finaflex 1-Alpha (Redefine Nutrition, Alpharetta GA; lot 824912013), and Finaflex 1-Andro (Redefine Nutrition, Alpharetta GA; lot 0500313). Five capsules from each product were analyzed quantitatively. With the exception of AttentionLink, all capsules were opened and their contents weighed. Because the AttentionLink capsules contained a viscous material encased in a microcrystalline cellulose outer layer, they were weighed in their entirety (Supplementary Information, Table S1).
2.3. Extraction of Supplements and Grapefruit Juice
The contents of the capsules (and in the case of AttentionLink, the entire capsule) were shaken for 5 h at 100 rpm in 3.0 mL of MeOH. Aliquots (600 mL) of the extract were filtered using 1.7 mL polypropylene Spin-X centrifuge tube filters (0.22 μm; Corning, Tewskbury MA) and centrifuged for 10 min at 14 × 103 rpm. This method was modified from a study measuring furanocoumarins in teas, fruits and vegetables that reported MeOH to be the most efficient solvent [25]. Grapefruit juice was extracted as described previously [13] by shaking 240-mL aliquots of juice with three consecutive washes of ethyl acetate (EtOAc).
2.4. Preparation of Standards
Bergamottin and DHB were dissolved in MeOH to create stock solutions of 1.6 mM each. Two calibration curves containing both standards were prepared from these stock solutions. One standard curve (PDA curve) used six concentrations ranging from 5.00 μM to 160.0 μM for both bergamottin and DHB; the second standard curve (MS curve) used five concentrations ranging from 0.313 μM to 5.00 μM for both bergamottin and DHB.
2.5. UPLC-PDA-MS Analysis
UPLC separations of the standards solutions, supplement extracts, and grapefruit juice extract were performed using a Waters Acquity UPLC system (Milford, MA) equipped with an autosampler, photodiode array (PDA) detector, column manager, and binary solvent manager. An HSS C18 column (50 mm × 2.1 mm i.d., 1.8 μm, Waters, Milford, MA) was used for all chromatographic separations, held at a constant temperature of 40 °C. The gradient system consisted of 0.1% formic acid in CH3CN (A) and 0.1% formic acid in H2O (B), at a flow rate of 0.6 mL/min. The gradient used 30-60% A at 0-1.2 min, 60-100% A at 1.2-2.0 min, and 100% A at 2.0-3.0 min. Both standards and samples were injected in triplicate, at a volume of 2.0 μL.
The UPLC system was coupled to a Thermo Scientific TSQ Quantum Access triple quadrupole mass spectrometer (Waltham MA) with a heated electrospray ionization (HESI) source. Analyses were conducted in positive mode, with spray voltage 3800 V, vaporizer and capillary temperatures 300 °C and 350 °C, respectively, and sheath gas and auxiliary gas 45 and 35 (arbitrary units), respectively. Tube lens offset and skimmer offset were 89 and 0, respectively. The mass spectrometer was calibrated externally using polytyrosine. Data were collected from the mass spectrometer using full scan mode, using a scan time of 0.3 s, and mass range of 150-500 m/z; data were collected at 250 nm on the PDA. All data were analyzed using Xcalibur V2.2 software.
2.6. Method Validation
Linearity of the calibration curves was assessed by least-squares analysis. Precision and accuracy were determined by calculating the relative standard deviation (RSD) and relative error (RE), defined as the percent difference between the mean observed concentration and the nominal concentration of three replicate analyses of the standards. All analyses of the extracts were performed in triplicate on a single day. Interday RSD and RE were determined by analyzing the standard solutions in triplicate on three separate days. The limit of detection (LOD) and limit of quantification (LOQ) were defined as 3.3s/m and 10s/m, respectively (where s is the standard deviation of the response and m is the slope of the calibration curve), as per the guidelines set forth by the International Conference on Harmonisation (ICH) [26].
Matrix effect was evaluated by comparing the relative responses of analyte spiked into a MeOH blank and the supplement extracts [27]. A 2.5-μL aliquot of a 20 mM bergamottin and DHB solution was added to 497.5 μL of MeOH and supplement extract; a 2.5-μL aliquot of MeOH was added to 497.5 μL of the same supplement extracts to provide a comparison to the non-spiked supplements. The analyte peak areas of the spiked supplements (S) minus the peak areas of the non-spiked supplements (U) were compared to the average peak area of the spiked MeOH (M) and expressed as a percent recovery: (S-U)/M*100. Extraction efficiency was evaluated by adding 30 μg of bergamottin and DHB to four capsules of each supplement. The supplements were extracted as described in Section 2.3, and quantification was performed as described in Section 2.5. The average amount measured in non-spiked capsules was subtracted from the amount measured in spiked capsules, and the remainder was used to calculate percent recovery.
2.7. CYP3A Inhibition Assay
A 500-μL aliquot of each supplement extract, and a 50-μL aliquot of grapefruit juice extract were dried under air. A reconstitution and dilution scheme was devised using the product with the highest measured amount of DHB (SciFit DHB 300). The dried extract of SciFit DHB 300 was reconstituted with MeOH (130 μL), which was diluted 1:10 in MeOH. Each of these methanolic solutions was diluted further into incubation mixtures (see below) to yield final DHB concentrations of 1 and 0.1 μM; the higher concentration approximates the Ki of DHB towards CYP3A using HIM and midazolam as the probe substrate [10]. The remaining dried supplement extracts were reconstituted and diluted in the same manner as SciFit DHB 300. The dried grapefruit juice extract was reconstituted with MeOH (50 μL), then diluted 1:10 in MeOH to yield final DHB concentrations of 1 and 0.1 μM in the incubation mixtures.
Incubation mixtures, prepared in 96-well plates, consisted of midazolam (4 μM), HIM (0.05 mg/mL protein), inhibitor (diluted extract, bergamottin, DHB, ketoconazole) or vehicle control, and potassium phosphate buffer (100 mM, pH 7.4). The final concentrations of pure bergamottin and DHB and ketoconazole were 1 and 0.1 μM; the final concentration of MeOH (v/v) was 1.0%. After equilibrating the mixtures for 5 min at 37°C, reactions were initiated with nicotinamide adenine dinucleotide phosphate (1 mM final concentration), yielding a final volume of 200 μL. Reactions were terminated after 4 min by removing a 100-μL aliquot and adding to 300 μL of ice-cold CH3CN containing internal standard (300 μg/mL alprazolam). Samples were vortexed (∼30 s) and centrifuged (3000 g × 10 min at 4 °C), after which 100 μL of supernatant were removed and analyzed for 1′-hydroxymidazolam by LC-MS-MS on an API 6500 QTrap operated in MRM mode and equipped with an electrospray ionization source. Calibration standards were matrix-matched and were linear from 3.9 to 2000 nM. The QTrap was coupled to a Shimadzu Nextera UHPLC system (Kyoto, Japan). Chromatographic separation of midazolam, 1′-hydroxymidazolam, and alprazolam was achieved with a Thermo Scientific Aquasil C18 (2.1 × 50 mm, 3 μm) HPLC column (Waltham, MA) using a gradient method following a 7-μL injection of each supernatant. The gradient system consisted of 0.1% formic acid in CH3CN (A) and 0.1% formic acid in H2O (B), at a flow rate of 0.75 mL/min. The gradient used 5% A at 0-0.4 min, 5-95% A at 0.4-1.5 min, 95% A at 1.5-2.1 min, 95-5% A at 2.1-2.11 min, and 5% A at 2.11-3.0 min. Sample and column temperatures were 4°C and 40°C, respectively. Quality controls (QCs) of 10, 100, and 1500 nM were used to assess accuracy. All standards and QCs were accurate to within 20% of the nominal value; QC precision was <15% RE.
3. Results and discussion
3.1. Method Validation
The PDA calibration curve (5.00 μM to 160.0 μM) showed excellent linearity in UV response (bergamottin R2 = 0.9995, DHB R2 = 0.9996); however, the MS response exhibited a limited linear dynamic range (0.156 μM to 5.00 μM). Because of the latter, the UV detection was used to analyze supplements with analytes corresponding to the higher concentration range. The second curve (0.156 μM to 5.00 μM) was linear in both the UV (bergamottin R2 = 0.9966, DHB R2 = 0.9993) and MS (bergamottin R2 = 0.9968, DHB R2 = 0.9977) response; due to the superior resolving power of MS, afforded by the ability to select for specific m/z, the MS signals were used to quantify supplements with analyte concentrations in this range. The LODs were 0.10 (bergamottin) and 0.073 μM (DHB) for the PDA curve and 0.054 μM (bergamottin and DHB) for the MS curve. The LOQs were 1.8 μM (bergamottin) and 0.22 μM (DHB) for the PDA curve and 0.16 μM (bergamottin and DHB) for the MS curve. Parameters for the standard curves are summarized in Table 1. When converted to μg/capsule, the LODs were 0.12 μg (bergamottin) and 0.074 μg (DHB) for the PDA curve and 0.060 μg (bergamottin and DHB) for the MS curve, while the LOQs were 2.0 μg (bergamottin) and 0.22 μg (DHB) for the PDA curve and 0.18 μg (bergamottin and DHB) for the MS curve.
Table 1.
Parameters of calibration curves.
| Analyte | retention time, min (± SD) | Slope (± SD) | r2 | LOD (μM) | LOQ (μM) | |
|---|---|---|---|---|---|---|
| PDA Curve | Bergamottin (1) | 2.21 (± 0.01) | 4.087 × 10³ (± 24) | 0.9995 | 0.10 | 1.8 |
| (5.00 μM to 160.0 μM) | DHB (2) | 1.24 (± 0.01) | 2.451 × 10³ (± 9) | 0.9996 | 0.073 | 0.22 |
| MS Curve | Bergamottin (1) | 2.29 (± 0.01) | 2.101 × 10⁶ (± 2.7 × 10⁴) | 0.9968 | 0.054 | 0.16 |
| (0.313 μM to 5.00 μM) | DHB (2) | 1.30 (± 0.01) | 2.729 × 10⁶ (± 4.5 × 10⁴) | 0.9977 | 0.054 | 0.16 |
Intraday precision in the PDA curve was below 1.0% for both analytes (Table 2) except at one concentration (10 μM), which had an RSD of 8.0%. Interday precision for the same standard curve ranged from 1.2 to 5.9%. The RE for both analytes, both intra and interday, was below 5.8%. The measurements from the MS curve (Table 3) had slightly higher RSDs (ranging from 1.2 to 5.4% intraday and 1.4 to 7.0% interday); whether this decrease in precision was inherent to the MS detector or a consequence of the lower concentrations in the standard curve is unknown. The RE for both analytes was, in general, below 5.4%, with a maximum RE of 8.0% for bergamottin and 6.7% for DHB.
Table 2.
Intraday and interday precision and accuracy of the PDA calibration curve.
| Analytes | Concentration of Standard Solution Injected (μM) | Intraday | Interday | ||
|---|---|---|---|---|---|
|
|
|
||||
| RSD (%) | RE (%) | RSD (%) | RE (%) | ||
| Bergamottin (1) | 160 | 0.52 | 5.8 | 3.0 | 4.3 |
| 80.0 | 0.40 | 3.8 | 2.3 | 1.1 | |
| 40.0 | 0.58 | 0.69 | 2.3 | 2.1 | |
| 20.0 | 0.47 | 1.9 | 1.9 | 4.0 | |
| 10.0 | 0.20 | 3.7 | 3.8 | 1.7 | |
| 5.00 | 3.6 | 1.2 | 3.7 | 2.5 | |
| DHB (2) | 160 | 0.47 | 0.64 | 0.44 | 0.81 |
| 80.0 | 0.37 | 1.3 | 1.2 | 2.1 | |
| 40.0 | 0.32 | 3.8 | 5.3 | 3.1 | |
| 20.0 | 1.9 | 4.8 | 4.4 | 3.7 | |
| 10.0 | 8.0 | 3.4 | 5.9 | 0.65 | |
| 5.00 | 0.45 | 1.0 | 1.4 | 1.9 | |
Table 3.
Intraday and interday precision and accuracy of the MS calibration curve.
| Analyte | Concentration of Standard Solution Injected (μM) | Intraday | Interday | ||
|---|---|---|---|---|---|
|
|
|
||||
| RSD (%) | RE (%) | RSD (%) | RE (%) | ||
| Bergamottin (1) | 5.00 | 4.4 | 1.2 | 4.3 | 2.8 |
| 2.50 | 3.0 | 2.4 | 3.7 | 2.2 | |
| 1.25 | 4.6 | 5.2 | 4.5 | 5.4 | |
| 0.625 | 4.9 | 8.0 | 7.0 | 2.7 | |
| 0.313 | 5.4 | 3.2 | 5.4 | 0.35 | |
| DHB (2) | 5.00 | 1.7 | 1.6 | 1.4 | 1.3 |
| 2.50 | 1.2 | 4.6 | 2.1 | 3.8 | |
| 1.25 | 1.8 | 6.7 | 3.4 | 4.3 | |
| 0.625 | 4.6 | 1.6 | 3.8 | 4.3 | |
| 0.313 | 2.7 | 2.9 | 4.9 | 3.1 | |
Except for Xceler8 DHB, matrix effects (expressed as percent recovery) were within 15% (Table 4). Because of the substantial matrix effect of Xceler8 DHB, further analysis of this supplement, including quantification and in vitro testing, is not reported. Extraction efficiency was above 84.8% (± 1.1) for all supplements tested except for AttentionLink, which demonstrated 77.7% (± 3.7) recovery of bergamottin (Table 5).
Table 4.
Matrix effects expressed as mean recoveries of spiked analyte in supplement extracts.
| % Recovery (± SD) | ||
|---|---|---|
|
|
||
| Bergamottin (1) | DHB (2) | |
|
|
|
|
| SciFit DHB 300 | 97.1 (± 4.9) | 102.2 (±9.2) |
| Trisorbagen | 100.2 (± 4.9) | 99.3 (± 8.1) |
| Xceler8 DHB | 9.2 (± 1.9) | 9.54 (± 0.80) |
| AttentionLink | 85.9 (± 6.7) | 102.0 (± 3.0) |
| Finaflex 1-Alpha | 100.5 (± 1.9) | 104.1 (± 5.3) |
| Finaflex 1-Andro | 88.2 (± 5.9) | 87.5 (± 5.4) |
Table 5.
Extraction efficiency expressed as mean recoveries of spiked analyte in supplement extracts.
| % Recovery (± SD) | ||
|---|---|---|
|
|
||
| Bergamottin | DHB | |
|
|
|
|
| SciFit DHB 300a | 101. (± 12.) | 100.1 (± 7.0) |
| Trisorbagen | 90.4 (± 1.1) | 84.8 (± 1.1) |
| AttentionLink | 77.2 (± 3.7) | 99.7 (± 4.3) |
| Finaflex 1-Alpha | 93.49 (± 0.80) | 98.0 (± 3.2) |
| Finaflex 1-Andro | 98.6 (± 5.1) | 86.7 (± 3.1) |
The percent recovery for SciFit DHB 300 was calculated as the amount measured in a spiked capsule minus the average amount of analyte measured in non-spiked capsules (12.13 (± 0.23) μg bergamottin and 65.51 (± 0.64) μg DHB).
Xceler8 DHB is not included in this table due to significant matrix effects (Table 4).
3.2. Quantification of Bergamottin and DHB in Dietary Supplements and Grapefruit Juice
Of the six supplements analyzed, only two had detectable amounts of bergamottin and DHB (Table S2, Supplementary Information). The SciFit DHB 300 capsules, the label for which claimed 300 mg pure DHB, contained an average of 12.13 (± 0.23) μg bergamottin and 65.51 (± 0.64) μg DHB per capsule. Bergamottin was detected in Xceler8 DHB, but due to substantial matrix effects (Section 3.1, Table 4), quantification is not reported. Complete per-capsule data are available in Supplementary Information, Table S1. In contrast to the supplements, both bergamottin and DHB were detected readily in grapefruit juice; concentrations were 4.485 (± 0.031) and 8.327 (± 0.047) μM, respectively (0.449 and 0.743 mg per 240-mL serving).
3.3. CYP3A Inhibition Assay
Vehicle control reaction velocities of 416 ± 29 pmol/min/mg protein demonstrated acceptable CYP3A activity in the HIM lot. The CYP3A inhibitor, ketoconazole, abolished 1′-hydroxymidazolam formation at 1 μM and inhibited activity by ∼80% at 0.1 μM (Fig. 2). Bergamottin showed no inhibition at the concentrations tested. This lack of effect by bergamottin was expected at these concentrations based on an apparent Ki >10 μM with HIM [10]. DHB at 0.1 and 1 μM inhibited activity by 5 and 42%, respectively. Except for bergamottin, concentration dependency was observed for each treatment (p<0.05; 2-way ANOVA with Bonferroni adjustment). Because the extract dilutions were based on the measured DHB content in the SciFit DHB 300 supplement, this supplement was expected to behave most like authentic DHB. However, this supplement was considerably more potent than DHB (Fig. 2). The CYP3A inhibitory activity of SciFit was similar to that of the grapefruit juice extract, which, like SciFit, was diluted such that the final concentrations of DHB were 0.1 and 1 μM. In addition to SciFit, two supplements (Trisorbagen and AttentionLink) demonstrated potent inhibition of CYP3A activity despite the fact that neither bergamottin nor DHB were detected. Finaflex 1-Alpha appeared to stimulate CYP3A activity at the lower concentration, which has been observed with low concentrations of bergamottin (< 2.5 μM) in incubations with HIM and midazolam [28].
Fig. 2.
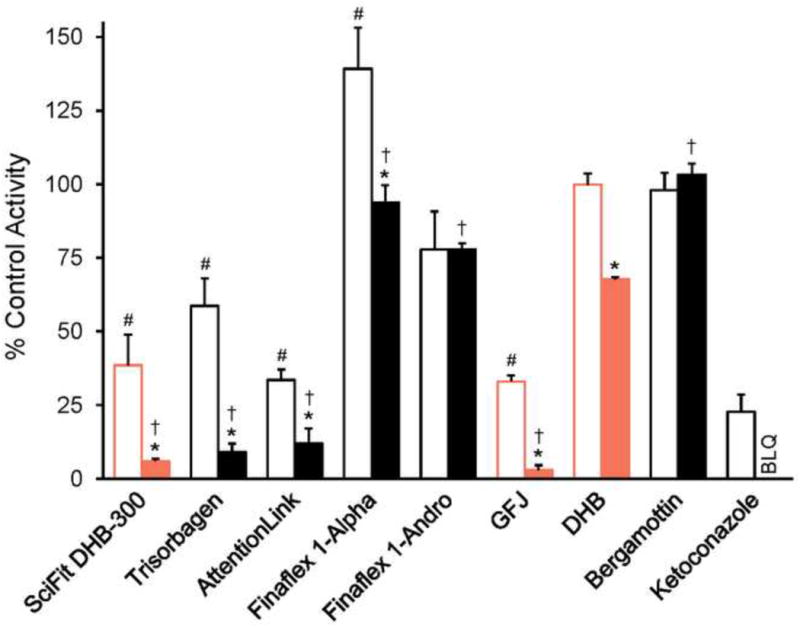
Comparison of the effects of supplements labeled to contain 6′,7′-dihydroxybergamottin (DHB) with known CYP3A inhibitors on CYP3A activity in human intestinal microsomes. Pure DHB and bergamottin, as well as the known CYP3A inhibitor ketoconazole, were tested at 0.1 μM (open bars) or 1 μM (solid bars). The methanolic extract of SciFit was tested such that the final concentration of DHB was 0.1 or 1 μM. All other supplement extracts were tested at the same dilutions as SciFit (10× and 1×; open bars and closed bars, respectively). The grapefruit juice extract (GFJ) was tested such that the final concentration of DHB was 0.1 or 1 μM. The concentrations of DHB in the incubations containing SciFit, GFJ, and purified DHB were the same (0.1 and 1 μM; open and filled orange bars, respectively). Bars and error bars denote the means and SDs, respectively, of triplicate incubations. Inhibition by ketoconazole at 1 μM was below the limit of quantification (BLQ). *p < 0.05 versus the 1× dilution; #p < 0.05 versus pure DHB at 0.1 μM; †p < 0.05 versus pure DHB at 1 μM. Statistical comparisons were made via two-way ANOVA with a Bonferroni adjustment.
4. Conclusions
All of the supplements analyzed were labeled to contain bergamottin and/or DHB, but only one contained detectable quantities of these analytes, and, even then, in much lower amounts than the label claimed. While these results reflected poorly on label accuracy, the low quantities were initially reassuring in consideration of possible supplement-drug interactions, particularly when one product was labeled to contain 300 mg DHB per capsule. The quantity of DHB measured in one SciFit capsule (0.065 mg) was considerably less than that measured in a glass (240 mL) of grapefruit juice (0.6 to 3.8 mg) used in clinical studies reporting a significant increase in victim drug systemic exposure when co-administered with the juice [6, 29-32]. A consumer would have to take at least 10 capsules of SciFit to achieve a dose of DHB equivalent to lowest amount of DHB in a glass of grapefruit juice reported to cause a clinical interaction [32]. Despite the expectation that the supplements would lack CYP3A inhibitory activity, several of the extracts were more potent than pure DHB, indicating additional CYP3A inhibitors present in the supplements. This additional inhibitory activity may have been due to other furanocoumarins, including multimers, and/or other classes of CYP3A inhibitors. Trisorbagen, for example, was labeled to contain a standardized piperine composition, though it did not report actual quantities; piperine has been demonstrated previously to inhibit CYP3A activity in human liver microsomes (Ki ∼40 μM) [33] and may have contributed in the current study. Whether such inhibitory activity translates to the clinical setting remains to be determined. Further analysis of the supplements would provide additional insight by identifying the constituents responsible for the unexpected inhibitory potency.
Supplementary Material
Highlights.
A rapid validated method for the quantitation of two furanocoumarins was developed.
Bergamottin and 6′,7′-dihydroxybergamottin were quantified in dietary supplements.
Despite labeling claims, furanocoumarins were undetected in most supplements.
Supplements exhibited in vitro CYP3A inhibition despite low furanocoumarin content.
Acknowledgments
This research was supported by the National Institutes of Health/National Institute of General Medical Sciences via grant R01 GM077482. The authors thank to Dr. B.M. Ehrmann and Mr. T.N. Graf for their assistance with the triple quadrupole mass spectrometer and its software.
Appendix A. Supplementary Data
Supplementary data associated with this article can be found, in the online version, at (insert doi upon publication).
Footnotes
Publisher's Disclaimer: This is a PDF file of an unedited manuscript that has been accepted for publication. As a service to our customers we are providing this early version of the manuscript. The manuscript will undergo copyediting, typesetting, and review of the resulting proof before it is published in its final citable form. Please note that during the production process errors may be discovered which could affect the content, and all legal disclaimers that apply to the journal pertain.
References
- 1.NBJ's Supplement Business Report. Nutrition Business Journal. 2012:23. [Google Scholar]
- 2.Paibir S, Rahavendran SV. Encyclopedia of Drug Metabolism and Interactions. Vol. 2. John Wiley & Sons, Inc; 2012. ADME of herbal dietary supplements; pp. 793–840. [Google Scholar]
- 3.Sports Nutrition & Weight Loss Report. Nutrition Business Journal. 2012:13. [Google Scholar]
- 4.Bailey DG, Malcolm J, Arnold O, Spence JD. Grapefruit juice-drug interactions. Br J Clin Pharmacol. 1998;46:101–110. doi: 10.1046/j.1365-2125.1998.00764.x. [DOI] [PMC free article] [PubMed] [Google Scholar]
- 5.Paine MF, Oberlies NH. Clinical relevance of the small intestine as an organ of drug elimination: drug-fruit juice interactions. Expert Opin Drug Metab Toxicol. 2007;3:67–80. doi: 10.1517/17425255.3.1.67. [DOI] [PubMed] [Google Scholar]
- 6.Paine MF, Widmer WW, Hart HL, Pusek SN, Beavers KL, Criss AB, Brown SS, Thomas BF, Watkins PB. A furanocoumarin-free grapefruit juice establishes furanocoumarins as the mediators of the grapefruit juice-felodipine interaction. Am J Clin Nutr. 2006;83:1097–1105. doi: 10.1093/ajcn/83.5.1097. [DOI] [PubMed] [Google Scholar]
- 7.Hanley MJ, Cancalon P, Widmer WW, Greenblatt DJ. The effect of grapefruit juice on drug disposition. Expert Opin Drug Metab Toxicol. 2011;7:267–286. doi: 10.1517/17425255.2011.553189. [DOI] [PMC free article] [PubMed] [Google Scholar]
- 8.Seden K, Dickinson L, Khoo S, Back D. Grapefruit-drug interactions. Drugs. 2010;70:2373–2407. doi: 10.2165/11585250-000000000-00000. [DOI] [PubMed] [Google Scholar]
- 9.Won CS, Oberlies NH, Paine MF. Mechanisms underlying food–drug interactions: Inhibition of intestinal metabolism and transport. Pharmacol Ther. 2012;136:186–201. doi: 10.1016/j.pharmthera.2012.08.001. [DOI] [PMC free article] [PubMed] [Google Scholar]
- 10.Paine MF, Criss AB, Watkins PB. Two major grapefruit juice components differ in intestinal CYP3A4 inhibition kinetic and binding properties. Drug Metab Dispos. 2004;32:1146–1153. doi: 10.1124/dmd.104.000547. [DOI] [PubMed] [Google Scholar]
- 11.De Castro WV, Mertens-Talcott S, Rubner A, Butterweck V, Derendorf H. Variation of flavonoids and furanocoumarins in grapefruit juices: a potential source of variability in grapefruit juice-drug interaction studies. J Agr Food Chem. 2006;54:249–255. doi: 10.1021/jf0516944. [DOI] [PubMed] [Google Scholar]
- 12.Widmer W, Huan C. Variation in furanocoumarin content and new furanocoumarin dimers in commercial grapefruit (Citrus paradisi Macf.) juices. J Food Sci. 2005;70:C307–C312. [Google Scholar]
- 13.VanderMolen KM, Cech NB, Paine MF, Oberlies NH. Rapid quantitation of furanocoumarins and flavonoids in grapefruit juice using ultra-performance liquid chromatography. Phytochem Anal. 2013;24:654–660. doi: 10.1002/pca.2449. [DOI] [PMC free article] [PubMed] [Google Scholar]
- 14.Durr D, Stieger B, Kullak-Ublick GA, Rentsch KM, Steinert HC, Meier PJ, Fattinger K. St John's Wort induces intestinal P-glycoprotein/MDR1 and intestinal and hepatic CYP3A4. Clin Pharmacol Ther. 2000;68:598–604. doi: 10.1067/mcp.2000.112240. [DOI] [PubMed] [Google Scholar]
- 15.Wacher VJ, Wu CY, Benet LZ. Overlapping substrate specificities and tissue distribution of cytochrome P450 3A and P-glycoprotein: implications for drug delivery and activity in cancer chemotherapy. Mol Carcinog. 1995;13:129–134. doi: 10.1002/mc.2940130302. [DOI] [PubMed] [Google Scholar]
- 16.Dell'Aica I, Caniato R, Biggin S, Garbisa S. Matrix proteases, green tea, and St. John's wort: biomedical research catches up with folk medicine. Clin Chim Acta. 2007;381:69–77. doi: 10.1016/j.cca.2007.02.022. [DOI] [PubMed] [Google Scholar]
- 17.Madabushi R, Frank B, Drewelow B, Derendorf H, Butterweck V. Hyperforin in St. John's wort drug interactions. Eur J Clin Pharmacol. 2006;62:225–233. doi: 10.1007/s00228-006-0096-0. [DOI] [PubMed] [Google Scholar]
- 18.Schwarz UI, Hanso H, Oertel R, Miehlke S, Kuhlisch E, Glaeser H, Hitzl M, Dresser GK, Kim RB, Kirch W. Induction of intestinal P-glycoprotein by St John's wort reduces the oral bioavailability of talinolol. Clin Pharmacol Ther. 2007;81:669–678. doi: 10.1038/sj.clpt.6100191. [DOI] [PubMed] [Google Scholar]
- 19.Mai I, Bauer S, Perloff ES, Johne A, Uehleke B, Frank B, Budde K, Roots I. Hyperforin content determines the magnitude of the St John's wort-cyclosporine drug interaction. Clin Pharmacol Ther. 2004;76:330–340. doi: 10.1016/j.clpt.2004.07.004. [DOI] [PubMed] [Google Scholar]
- 20.De Smet PAGM. Herbal medicine in Europe - relaxing regulatory standards. N Engl J Med. 2005;352:1176–1178. doi: 10.1056/NEJMp048083. [DOI] [PubMed] [Google Scholar]
- 21.Woo JJY. Adverse event monitoring and multivitamin-multimineral dietary supplements. Am J Clin Nutr. 2007;85:323S–324S. doi: 10.1093/ajcn/85.1.323S. [DOI] [PubMed] [Google Scholar]
- 22.Herbert V. Underreporting of dietary supplements to health-care providers does great harm. Mayo Clin Proc. 1999;74:531–532. doi: 10.4065/74.5.531. [DOI] [PubMed] [Google Scholar]
- 23.Hensrud DD, Engle DD, Scheitel SM. Underreporting the use of dietary supplements and nonprescription medications among patients undergoing a periodic health examination. Mayo Clin Proc. 1999;74:443–447. doi: 10.4065/74.5.443. [DOI] [PubMed] [Google Scholar]
- 24.Klepser TB, Doucette WR, Horton MR, Buys LM, Ernst ME, Ford JK, Hoehns JD, Kautzman HA, Logemann CD, Swegle JM, Ritho M, Klepser ME. Assessment of patients' perceptions and beliefs regarding herbal therapies. Pharmacotherapy. 2000;20:83–87. doi: 10.1592/phco.20.1.83.34658. [DOI] [PubMed] [Google Scholar]
- 25.Peroutka R, Schulzova V, Botek P, Hajslova J. Analysis of furanocoumarins in vegetables (Apiaceae) and citrus fruits (Rutaceae) J Sci Food Agr. 2007;87:2152–2163. [Google Scholar]
- 26.ICH, International conference on harmonisation. Q2B: Validation of analytical procedures. US FDA Federal Register. 1997;62:27463–27467. [Google Scholar]
- 27.Rogatsky E, Stein D. Evaluation of matrix effect and chromatography efficiency: New parameters for validation of method development. J Am Soc Mass Spectrom. 2005;16:1757–1759. doi: 10.1016/j.jasms.2005.07.012. [DOI] [PubMed] [Google Scholar]
- 28.Paine MF, Criss AB, Watkins PB. Two major grapefruit juice components differ in time to onset of intestinal CYP3A4 inhibition. J Pharmacol Exp Ther. 2005;312:1151–1160. doi: 10.1124/jpet.104.076836. [DOI] [PubMed] [Google Scholar]
- 29.Malhotra S, Bailey DG, Paine MF, Watkins PB. Clin Pharmacol Ther. Vol. 69. St Louis, MO, U. S.: 2001. Seville orange juice-felodipine interaction: comparison with dilute grapefruit juice and involvement of furocoumarins; pp. 14–23. [DOI] [PubMed] [Google Scholar]
- 30.Strauch K, Lutz U, Bittner N, Lutz WK. Dose–response relationship for the pharmacokinetic interaction of grapefruit juice with dextromethorphan investigated by human urinary metabolite profiles. Food and Chemical Toxicology. 2009;47:1928–1935. doi: 10.1016/j.fct.2009.05.004. [DOI] [PubMed] [Google Scholar]
- 31.Kakar SM, Paine MF, Stewart PW, Watkins PB. Clin Pharmacol Ther. Vol. 75. St Louis, MO, U. S.: 2004. 6′7′-dihydroxybergamottin contributes to the grapefruit juice effect; pp. 569–579. [DOI] [PubMed] [Google Scholar]
- 32.Greenblatt DJ, von MLL, Harmatz JS, Chen G, Weemhoff JL, Jen C, Kelley CJ, LeDuc BW, Zinny MA. Clin Pharmacol Ther. Vol. 74. St Louis, MO, U. S.: 2003. Time course of recovery of cytochrome p450 3A function after single doses of grapefruit juice; pp. 121–129. [DOI] [PubMed] [Google Scholar]
- 33.Volak LP, Ghirmai S, Cashman JR, Court MH. Curcuminoids inhibit multiple human cytochromes P450, UDP-glucuronosyltransferase, and sulfotransferase enzymes, whereas piperine is a relatively selective CYP3A4 inhibitor. Drug Metab Dispos. 2008;36:1594–1605. doi: 10.1124/dmd.108.020552. [DOI] [PMC free article] [PubMed] [Google Scholar]
Associated Data
This section collects any data citations, data availability statements, or supplementary materials included in this article.