

Abstract
Background
African Americans (AA) are not well-represented in cancer clinical trials despite having significantly higher cancer mortality rates than their European-American (EA) counterparts.
Objectives
The purpose of this study was to evaluate a program to improve perceptions of cancer clinical trials among AA.
Methods
The program was conducted in a convenience sample of 195 participants (75.4% AA) who lived in counties with high racial disparities in cancer mortality rates and who were recruited by community partners. The 30-minute program, part of a larger 3.5-hour cancer education program, was developed by the National Institutes of Health (NIH)/ National Cancer Institute (NCI). It was modified to include additional pictures of AA, AA-specific cancer mortality data, and information about the Tuskegee Syphilis Study and the resulting improved participant protection measures.
Measures
The seven-item Attitudes to Randomized Trial Questionnaire (ARTQ) was used to evaluate changes in trial perceptions from pre- to posttest. Additional survey items assessed general demographic characteristics.
Results
Slightly more than half of the participants had at least a college diploma (54.4%), 45.1% were married/living as married, 53.3% were female, and 45.6% had an annual household income of less than $40,000. For each ARTQ item, most participants who had less favorable perceptions of trials at pretest changed to more positive perceptions at posttest (p < .001).
Conclusions
Providing cancer clinical trial information led to more positive perceptions of cancer clinical trials. In future studies, the program could be used to help potential trial participants make informed decisions about participation; trial enrollment rates could then be evaluated.
Keywords: Clinical trials, African Americans, underrepresentation, perceptions, knowledge
Cancer is a major public health problem in the United States, where large racial differences in cancer mortality are evident. According to the American Cancer Society,1 for the majority of cancer types, AAs have the highest cancer mortality rate and the lowest cancer survival rates of any other racial or ethnic group in the United States.
Underrepresentation of AA in Cancer Clinical Trials
Unfortunately, although they have higher cancer mortality rates relative to their EA counterparts, AA are not well-represented in cancer clinical trials.2,3 Clinical trials are needed to examine the impact of inequalities in income, education, barriers to high-quality health care, and racial discrimination on racial, ethnic, and ancestry differences in cancer mortality.1 These trials provide opportunities to test new screening techniques, therapies, and biomarkers that could reduce cancer disparities.
A major problem lies in the fact that despite bearing an unequal cancer burden, AA and Latinos continue to be underrepresented in clinical trials.4-6 Although trial participation is of major importance for all people with cancer, it is of particular importance for AA. Proper sampling of a heterogeneous population to ensure sample representativeness is a key component of valid epidemiologic and clinical research. Without adequate numbers of AA in clinical trials, the generalizability of study results to members of this population is in question.7
Insufficient representation of racially and ethnically diverse groups in clinical trials results in inequitable distribution of the risks and benefits of research participation and reduces generalizability of trial results.6 AA experience a disproportionate cancer mortality burden and therefore they should be included in cancer clinical trials in numbers that are commensurate with their burden of cancer, because the trials could identify ways to reduce the cancer burden in this population.
Impact of Lack of Knowledge on Negative Perceptions of Cancer Clinical Trials and Recruitment
The need to expand the knowledge base of cancer clinical trials among diverse community members is underscored by Ford and associates,8 who reviewed 65 studies focusing on recruitment of racially and ethnically diverse participants to cancer clinical trials. Lack of education regarding cancer clinical trials was the most frequently reported barrier to participation.8 Similarly, Langford and colleagues5 report that lack of knowledge about clinical trials, and subsequent negative perceptions of them, are formidable barriers to the participation of diverse populations in trials.
Thus, lack of knowledge about trials can lead to negative perceptions of them, which in turn has a negative impact on trial participation. Unfortunately, negative perceptions of cancer clinical trials based on lack of knowledge can negatively impact trial recruitment in the very populations that could most benefit from the scientific knowledge gained through their participation. Fallowfield and co-workers9 argue that recruitment difficulties often arise from potential participants’ lack of understanding of terms such as “randomization.” Misperceptions in the randomization process (i.e., for participants with cancer, the minimum level of care received is the best available current treatment rather than placebo) can also lead to suspicion on the part of potential participants about the ethical nature of the research.8-10
Methods
The investigators hypothesized that increasing knowledge about cancer clinical trials would lead to more positive perceptions of trials among study participants. Therefore, a cancer clinical trial education program was conducted among predominantly AA populations in South Carolina, a state with high rates of cancer disparities and a large population of AA who could potentially benefit from participation in cancer clinical trials.
Rationale for the Study Design
The study design was based on a conceptual framework developed by Swanson and Ward.11 The framework includes barriers impacting the participation of minority participations in clinical trials. In the framework, sociocultural barriers are defined as fear and mistrust of federally sponsored research, the investigators conducting the research, and/or the institutions at which the research is conducted.11 Negative feelings may stem from previous encounters or from hearing reports of others’ previous encounters with research studies. Sociocultural barriers to recruitment of AA into clinical trials also include racial and ethnic discrimination, cultural beliefs regarding illness and disease, mistrust of the health care system, and differences in health beliefs and practices.11,12
Figure 1 depicts the conceptual framework. The study outcome was changes in perceptions of cancer clinical trials. It was hypothesized that the data would show post-program increases in more favorable perceptions of trials compared with pre-program perceptions.
Figure 1. Conceptual Framework of the Hypothesized Relationships.
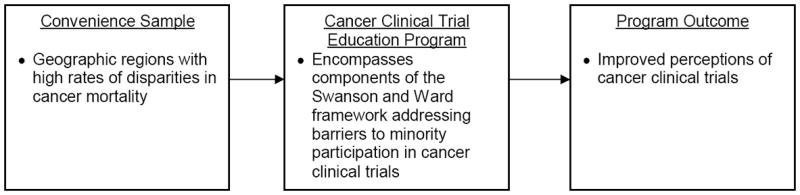
In the Swanson and Ward framework, sociocultural barriers are defined as fear and mistrust of federally sponsored research, the investigators conducting the research, and/or the institutions at which the research is conducted.11 Negative feelings may stem from previous encounters or from hearing reports of others’ previous encounters with research studies. Sociocultural barriers to recruitment of AA into clinical trials also include racial and ethnic discrimination, cultural beliefs regarding illness and disease, mistrust of the health care system, and differences in health beliefs and practices.11,12
In the present study, sociocultural barriers were addressed by employing the following methods. First, the program was conducted in trusted community venues. The investigators also worked with trusted community leaders who endorsed the study and helped to recruit participants to each study session. Using these recruitment methods likely helped to create a sense of trust among study participants, who might not have been familiar with our research program but were familiar with the community members who recruited them. It is likely that the significant increase in positive perceptions of cancer clinical trials was due in large part to the fact that the program was endorsed by trusted community leaders/ organizers and conducted in trusted community venues. It is also likely that the sustainability of the program, as demonstrated by the number of sessions that have been conducted by trained participants, is due in large part to the “ownership” of the program by the community partners.
Additionally, most of the investigative team members are AA and thus reflect the racial background of the majority of the participants. Finally, as part of the program, past clinical trial abuses in the Tuskegee Syphilis study were acknowledged but followed by a description of how protections for study participants (such as the informed consent process, consent forms, and mandated community representation on academic institutional review boards) came about as a result of these past atrocities.
Study Sample and Rationale for Site Selection
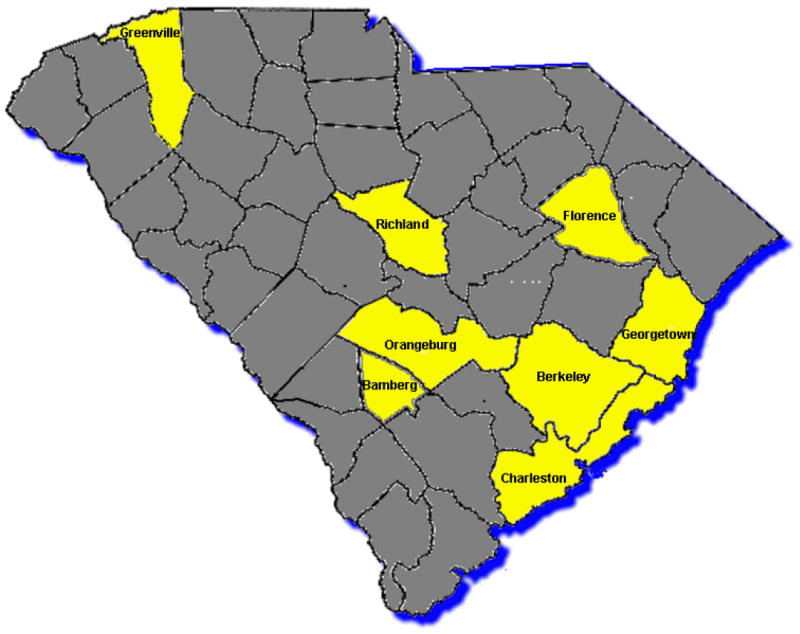
The program was conducted at ten sites in eight different counties representing several different geographic regions of the state (Figure 2). These eight counties (and sites) include Berkley (Ridgeville), Georgetown (Georgetown), Charleston (Charleston and Johns Island), Greenville (Greenville), Orangeburg (both Orangeburg sites), Richland (Columbia), Bamberg (Denmark), and Florence (Florence) counties. The study included a convenience sample of participants in communities with high racial disparities in cancer mortality rates. The counties where the intervention was conducted seem to be clustered in certain areas because of the word-of mouth response to the program. Because it was conducted in certain counties, representatives of neighboring counties have asked for the program to be conducted in their counties as well.
Figure 2. Program Sites in South Carolina.
As shown in Table 1, which describes 2007 cancer mortality rates for AA versus EA, the rates are significantly higher for AA. In South Carolina, the cancer mortality rate for AA is 223.1, compared with 183.2 for EA.
Table 1.
Age-Adjusted Cancer Mortality Rates for the Counties Where the Program Was Conducted*
| Race | County | |||||||
|---|---|---|---|---|---|---|---|---|
| Bamberg | Berkeley | Charleston | Florence | Georgetown | Greenville | Orangeburg | Richland | |
| European American | 186.8 | 186.6 | 175.2 | 189.9 | 186.8 | 173.4 | 159.4 | 177.2 |
| African American | 278.8 | 230.8 | 232.8 | 207.4 | 278.8 | 253.7 | 220.1 | 230.5 |
South Carolina Department of Environmental Control website (http://www.scandhec); accessed 7/10/09; age adjusted rates: 2000 US standard population
Table 2 describes the demographic characteristics of the counties where the cancer education program was conducted. As may be seen, the majority of the counties have median household incomes and per capita incomes below that of the United States or even of South Carolina as a whole. As will be described (see section entitled “Community Engagement Activities Conducted in the Study”), a variety of community engagement strategies were employed to recruit participants in these identified communities.
Table 2.
Demographic Characteristics of the Counties Where the Program was Conducted*
| County Name |
Size | Racial Composition (%) | Hispanic/Latino (%) | Median Household Income ($) |
Per Capita Income ($) | Population Below the Poverty Level (%) |
||||||
|---|---|---|---|---|---|---|---|---|---|---|---|---|
| European American | African American | Native American | Asian | Pacific Islander | Other | ≥2 Races | ||||||
| US (Ref.) | 308.7 million | 72.40 | 12.60 | 0.90 | 4.80 | 0.20 | 6.20 | 2.90 | 16.30 | 50,221 | 27,041 | 14.30 |
| South Carolina (Ref.) | 4.6 million | 66.20 | 27.90 | 0.40 | 1.30 | 0.10 | 1.50 | 1.70 | 5.10 | 42,580 | 23,196 | 17.10 |
| Bamberg | 16,658 | 36.47 | 62.50 | 0.16 | 0.19 | 0.01 | 0.14 | 0.53 | 0.71 | 24,007 | 12,584 | 27.80 |
| Berkeley | 142,651 | 68.00 | 26.63 | 0.52 | 1.87 | 0.08 | 1.20 | 1.70 | 2.76 | 39,908 | 16,879 | 11.80 |
| Charleston | 330,368 | 61.90 | 34.50 | 0.26 | 1.12 | 0.06 | 0.99 | 1.16 | 2.40 | 37,810 | 21,393 | 16.40 |
| Florence | 125,761 | 58.65 | 39.34 | 0.22 | 0.70 | 0.02 | 0.39 | 0.68 | 1.10 | 35,144 | 17,876 | 16.40 |
| Georgetown | 55,797 | 59.69 | 38.61 | 0.14 | 0.23 | 0.03 | 0.81 | 0.49 | 1.65 | 35,312 | 19,805 | 17.10 |
| Greenville | 453,104 | 77.53 | 18.30 | 0.19 | 1.38 | 0.05 | 1.42 | 1.14 | 3.76 | 42,049 | 22,081 | 10.50 |
| Orangeburg | 91,582 | 37.17 | 60.86 | 0.46 | 0.43 | 0.02 | 0.36 | 0.70 | 0.96 | 29,567 | 15,057 | 21.40 |
| Richland | 320,677 | 50.29 | 45.16 | 0.24 | 1.72 | 0.08 | 1.16 | 1.35 | 2.72 | 39,961 | 20,794 | 13.70 |
In South Carolina, racial differences are seen in cancer-related behaviors. These differences could contribute to the disparities in cancer mortality rates that are shown in Table 1. For example, in South Carolina in 2009, 20.6% of EA smoked, versus 21.4% of AA; 64.2% of EA were overweight/ obese, compared with 75.7% of AA; among the non-elderly population in the state, only 47% of AA had employer-sponsored health insurance coverage, compared with 64% of EA; and among the non-elderly population in the state, 46% of EA versus 49% of AA had Medicaid coverage.13 These data show that AA are more likely than EA to have higher rates of risk factors for cancer and at the same time, lower rates of access to care.
Institutional Review Board Approval
The Institutional Review Board at the Medical University of South Carolina approved the study protocol. The pre- and post-test surveys completed by each participant were linked by an identifier that was not connected to his or her name, date of birth, or any other personal identifier. Thus, the investigators had no way of connecting survey responses to individual participants in the sessions.
Description of the Cancer Clinical Trial Education Program
The clinical trial education program was part of a larger 4-hour evidence-based cancer education program in which a 3-hour component focused on general cancer knowledge, a 30-minute component focused specifically on prostate cancer knowledge, and a 30-minute component focused on cancer clinical trials knowledge. The first two components of the cancer education program were developed by the South Carolina Cancer Alliance, an 800-member, statewide, nonprofit organization with membership from the lay community, public health associations, and academia. The third component was developed by the investigators. All three components were developed for community audiences with no expert knowledge about cancer.
The cancer education program was designed to be highly interactive and “hands on” rather than merely didactic. Participants engaged in role play as they practiced sharing the information that they learned with others. They also participated in small group activities to review the information that was presented.
A pretest/posttest design was used. Results related to cancer knowledge outcomes are reported elsewhere and demonstrate that general cancer knowledge and prostate cancer knowledge scores increased significantly after the cancer education program.14 The prior publication was based on an identical sample and study design. However, the focus of the prior publication was on changes in cancer knowledge after the program, whereas the focus of the current paper is on changes in perceptions of clinical trials following the program.
The third component of the program, and the focus of this paper, is a 30-minute interactive presentation that is available on the NIH/NCI website. McCaskill-Stevens and associates15 recommend the use of culturally appropriate educational materials to increase minority clinical trial participation. Therefore, the investigators modified the NIH/NCI clinical trials presentation to include additional pictures of AA and cancer mortality data that are specific to AA in South Carolina (such as the fact that the prostate cancer mortality rate is three times higher among AA than among EA in the state).
Another modification was the addition of information about the Tuskegee Syphilis Study. The cancer clinical trial education program describes which elements of the Tuskegee Syphilis Study violated human rights (e.g., not informing participants that they were in a research study; not sharing information about the modes of transmission of syphilis with infected study members; denying study participants access to penicillin when it was discovered in the 1950s as a treatment for syphilis; not allowing the study participants to withdraw from the study at their discretion) and a description of the human subjects protections that are currently in place as a result of the Tuskegee Syphilis Study.16 The program also includes graphics to illustrate the processes of random selection and randomization. It was designed to present complex information in an understandable manner using simple, lay language.
Thus, the program consisted of a one-time, 4-hour session conducted at each study site by the research team. The 4-hour cancer education training program (including the cancer clinical trial education component) was delivered in its entirety to participants at each study site. The same modality was used in each session and with each group of participants. The structure and content of the 4-hour program were identical across all study sites. The education program is unique in South Carolina in its focus on application in communities with high rates of disparities in cancer mortality among AA.
Train the Trainer Description
The cancer education program (including the clinical trial education component) employed a Train the Trainer design in which each 4-hour session conducted at each site focused on training community members to teach others in their communities about cancer prevention and control, lifestyle interventions, cancer screening, early detection, diagnosis, and treatment options. Each person who participated in the program received a binder that includes copies of all of the materials that were presented during the 4-hour training session. The materials in the binder included the most up-to-date, evidence-based information related to cancer screening, early detection, treatment, and participation in cancer clinical trials. The materials were designed for use by lay users without health education degrees. The presentation materials were in the forms of transparencies, memory sticks, and CDs, which allowed the trained lay people (facilitators) to make use of whichever means are available to them in their communities to disseminate the information. The materials included prewritten talking points for each slide. The trained facilitators were strongly encouraged/asked by the research team to simply read the slides/overheads/handouts when they gave presentations in their own communities and not to add any extra information, to maintain the evidence-based integrity of the information contained in the materials.
Each lay facilitator who was trained during the program signed a contract/agreement to conduct two cancer education training sessions in his/her community in the coming year. The lay facilitators were informed by the research team that the sessions could take place in venues ranging from large group meetings with their religious and civic organizations to small group meetings held around their kitchen tables.
Community Engagement Activities Conducted in the Study
Each locale had a self-identified “champion,” a community leader who took responsibility for recruiting participants to the session. In addition, the investigators gave presentations to community members at sites during events hosted by the community partners, such as men’s fellowship meetings or health ministry meetings. The investigators posted flyers in community venues such as health care centers, churches, libraries, community centers, and local barbershops and beauty salons. Additionally, the investigators made presentations about the sessions at meetings of fraternities, sororities, and civic groups. Public service announcements were made on local radio stations to advertise the upcoming sessions.
Although most of the community leaders who took responsibility for recruiting participants to the program were AA, other participants were not excluded. For example, although the study focused on AA, the racial group with the largest cancer mortality disparities in the state, Native Americans and EA were also included. The following text describes the community engagement activities in detail.
Identification of Community Partners
Partnerships were developed between the research team and representatives of organizations who were interested in the goal of increasing cancer prevention and early detection awareness, and increasing knowledge of cancer clinical trials in their communities. Members of these organizations were willing to become active and equal partners with the research team to achieve this common goal. The community partners represented public, private, faith-based, social, and fraternal organizations. Creating a strong coalition of community partners led directly to the benefit of combining the knowledge and experience of each partner in working together to seek solutions for the major health challenges facing their communities.
Role of the Community Partners in Recruiting Participants for the Program
Partners were placed into two categories: Sponsoring or participating (Table 3). Sponsoring partners typically requested that the program be conducted primarily with members of their organizations. Most of the program participants were then recruited from the partners’ membership bases and networks and the partners provided most or all of the costs associated with conducting the program with the participants whom they identified.
Table 3.
Community Organizations That Have Been Involved in Conducting the Program
| Name of Organization | Type of Partnership (Sponsoring or Participating) |
|---|---|
| Medical University of South Carolina College of Nursing | Sponsoring |
| Medical University of South Carolina Southeastern Virtual Institute for Health Equity and Wellness (SE VIEW) | Sponsoring |
| South Carolina Cancer Alliance | Sponsoring |
| American Cancer Society | Sponsoring |
| Arabian Temple #139 | Participating |
| Athenian Club | Participating |
| Charleston County Stroke Action | Participating |
| Chi Eta Phi Nursing Sorority | Participating |
| Church of Christ at Azalea Drive | Participating |
| Georgetown Outreach Ministry | Participating |
| Girl Scouts of America | Participating |
| Jack & Jill of America, Inc. | Participating |
| Kappa Alpha Psi Fraternity, Inc. | Participating |
| Low Country Chapter Oncology Nurses Association | Participating |
| Nehemiah Chapter #388 Order of Eastern Stars | Participating |
| North Charleston Delta Sigma Theta, Inc. | Participating |
| 100 Black Men of Charleston | Participating |
| St. James-Santee Family Health Center | Participating |
| Sea Island Comprehensive Health Cooperation | Participating |
| Sigma Pi Phi Fraternity, Inc. | Participating |
| Thurgood Marshall Legal Society (Charleston County Black Lawyers Association) | Participating |
| Tri-County Black Nurses Association | Participating |
| Upward Bound College of Charleston | Participating |
| USTOO Prostate Cancer Program | Participating |
| WE Venture, LLC for Men Only Symposium | Participating |
In contrast, participating partners allowed the investigative team to include their organizations’ names on recruitment materials to demonstrate their endorsement of the program, but they did not require that the program be conducted primarily with members of their organizations. The participating partners also provided in-kind support for the program (handouts, rent free classroom space, etc.).The steps for participant recruitment included but were not limited to the following:
Identifying the target population;
Considering other community organizations to jointly participate in the program;
Selecting venues for the program;
Assisting with promoting the program in the community; and
Assisting with the pre-registration process for the program.
To facilitate the work with sponsoring and participating partners, the research team hired a part-time community organizer. She worked with the partners to coordinate the pre-registration process for the cancer education program at each site, develop a distribution process for flyers promoting the program to community groups in conjunction with the partners, and coordinate on-site set-up of the program with the partners. She also visited the partners’ community meetings to represent the academic institution of the investigative team, advertise the program, and strengthen the partnerships.
Thus, partnerships were developed between the research team and representatives of organizations who were interested in the goal of increasing cancer prevention and early detection awareness in their communities and willing to become active and equal partners with the team to achieve this common goal. The community partners represented public, private, faith based, social, and fraternal organizations. Creating a strong coalition of community partners led directly to the benefit of combining the knowledge and experiences of each partners working in seeking solutions for major health challenges facing the various communities.
Participant recruitment at each site began with identifying a community partner to promote the program in each local community. Partner organizations have included faith based organizations, community, civic, social, and fraternal organizations, some of which have national and regional mandates for health-related projects and activities. Once the partners were identified, commitments were secured from them to recruit from their membership base and to leverage their influence in the community to promote the program. The participant enrollment process was based on referral by the community partners. When people from each community called to enroll in the program that was to be held in their community, their names and contact information were obtained. The majority of the people (88.9%) who registered showed up to participate.
Sustaining the Partnerships
The research team created a strong coalition of community partners willing to be active supporters of the goal to increase cancer prevention and early detection awareness in South Carolina. Sustaining the community coalition is very important. The following are community outreach activities to sustain the coalition.
Community Speakers Bureau
As a means of contributing to the resources available to the lay facilitators in their communities, the research team maintains a list of individuals (physicians, faculty, and staff at the medical university where the research team members have faculty/staff appointments) who are willing to speak to community members in different regions of the state about general cancer information, cancer prevention and control, and specific types of cancer. The volunteer speakers disseminate this information at community events such as cancer support group meetings, cancer awareness events, and health fairs.
Health Fair/Community Event Display Set-up
Another resource that the research team provides to community members is provision of informational materials for health fairs and community events. The materials provided by the research team through the cancer center where they are employed include:
Educational brochures (on cancer screening guidelines, information on specific cancer types, and cancer prevention);
Breast and prostate visual and tactile models to palpate cancerous lumps (these models are borrowed by community members and returned to the cancer center);
Information on the screening schedule of the cancer center’s mobile cancer screening unit; and
A sign-up sheet to submit questions related to cancer prevention, screening, diagnosis, and treatment (responses to the questions are provided by clinical staff at the cancer center and are then distributed to the people who submitted the questions).
Measures
At the start of each 4-hour program, each participant was given a set identical instruments, one for the pretest (printed on blue paper) and one for the posttest (printed on green paper). Each set of instruments contained the same numeric code (e.g., 37) to allow the study statisticians to conduct significance tests of changes in scores from pretest to posttest. The instruments were administered to study participants at the start of the 4-hour program and at the end of the program. The instruments, described below, were read aloud to the participants, who responded to the items on the instruments. Thus, responses to demographic items were based on participant self- report.
The ARTQ, a seven-item instrument developed by Fallowfield and associates,9 was used to assess perceptions of cancer clinical trials. The ARTQ includes three domains: Positive or negative perceptions of medical research in general, willingness to personally participate in research, and willingness to personally participate in research involving randomization.9, 17 Table 4 lists the items included in the instrument. The first three questions on the ARTQ, which is based on self-report, distinguish people who would consider enrolling in a clinical research study from those who are uncertain or who would not want to participate. Respondents are asked to indicate “Yes,” “No,” or “Do Not Know” to the first three questions. Respondents who are uncertain or who would not want to participate in a trial are then asked to read three statements that describe why doctors and researchers want to do studies. The statements also describe participants’ right to withdraw from the study at any time, and a statement related to the treatments and side effects associated with the trial. Respondents answer each question consecutively and then answer a seventh and final question that asks whether knowing the extra information contained in the statements would now encourage them to reconsider participation.17
Table 4.
ARTQ Items: Answers Are Yes, No, or Do Not Know
| Do you think that patients should be asked to take part in medical research? |
| Suppose that you were asked to take part in a research study comparing two treatments, both of which were suitable for your illness.Would you be prepared to take part in a study comparing different treatments? |
| Usually, the only scientific way to compare one treatment with another is for the choice between the two to be made randomly, rather like tossing a coin.Would you be prepared to take part in a study where treatment was chosen at random? |
| If you answered “No” or “Do not know” to question 3, we would now like to ask you a bit more about this. In a randomized study a choice would be made between two treatments, either of which would be suitable for you. Your doctor and experts in the field do not know for sure if one treatment is better than the other, or if they are both the same, that’s why they want to do the study.Would knowing that encourage you to take part? |
| In a random choice study, if the treatment you were receiving did not suit you for any reason you could leave the study. Your doctor would then give you whatever other treatment might be appropriate for you.Would that encourage you to take part? |
| Before you agreed to enter a random choice study the doctor would tell you all about the two treatments being compared, before you were allocated to one or the other.Would that encourage you to take part? |
| If you knew all the following things were taken in account, would you change your mind and agree to take part in the study?Both treatments were completely suitable. You could leave the study if the treatment did not suit you. There is plenty of information before the random choice was made. |
The validity of the ARTQ in predicting patient’s behavior in terms of enrollment into cancer clinical trials was evaluated by Fleissig and co-workers18 in a study with 265 patients invited to join one of 40 different randomized clinical trials. The majority of the patients (77.4%) agreed to enroll in a trial. This outcome was predicted by the ARTQ with 80.4% accuracy based on the patients’ ARTQ scores.18
In the present study, the investigators evaluated not only respondents who switched to more favorable perceptions of randomized trials but also those who switched to more negative perceptions, so all seven items on the ARTQ were administered to all of the participants. Additional survey items assessed general demographic characteristics of participants, including Hispanic ethnicity, race, highest level of education completed, marital status, household income, age, and gender.
Statistical Methods
The survey data were double-entered into SPSS 16.0 and were compared for verification of data entry. Analyses were done with SPSS 16.0 (SPSS, Inc., Chicago, IL), and R v2.6.1. Chi-square tests were used to compare demographics across all sites. Of particular interest was the percentage of participants who changed their responses from less favorable to more favorable perceptions of cancer clinical trials after the educational intervention. It was hypothesized that more participants who had negative perceptions at baseline would change their perceptions of cancer clinical trials to positive ones after the intervention than expected by chance alone. To test this hypothesis, the fraction of respondents changing their perception (either from positive to negative or vice versa) was estimated for each item and treated as the ‘chance alone’ change proportion (i.e., the null proportion). Then, we performed two-sided, one-sample Fisher’s exact tests, comparing the fraction of respondents who changed from No/Don’t Know to Yes versus the null proportion for each item. Additional analyses were done to evaluate differences in reporting patterns in AA and EA. These were primarily descriptive, inspecting point estimates and 95% confidence intervals. However, p-values were also estimated using Fisher’s exact tests.
Results
Table 5 shows the demographic characteristics of all participants who were present at the time of the pretest (n = 195). Most were AA (75.4%). Slightly more than 6% had less than a high school education (6.1%), 10.3% had a high school diploma as their terminal degree, 21.0% had taken some college courses, 27.2% were college graduates, and 27.2% had completed postgraduate studies. About half were married or living as married (45.1%), slightly more than half were female (53.3%), and almost half had an annual household income of less than $40,000 (45.6%).
Table 5.
Summary of Demographic Characteristics of Participants at Pretest
| Variable | N (%) |
|---|---|
| Age (yrs)* | |
| <50 | 78 (40.0) |
| 51-64 | 73 (37.4) |
| 65-75 | 34 (17.4) |
| >76 | 5 (2.6) |
| Hispanic* | |
| Yes | 3 (1.5) |
| No | 188 (96.4) |
| Race* | |
| African American or Black | 147 (75.4) |
| American Indian or Alaskan Native | 15 (7.7) |
| Caucasian or White | 28 (14.4) |
| Other | 0 (0.0) |
| Education* | |
| <8 yrs | 4 (2.1) |
| 8-11 yrs | 8 (4.1) |
| 12 yrs or completed high school | 20 (10.3) |
| Post high school training other than college | 12 (6.2) |
| Some college | 41 (21.0) |
| College graduate | 53 (27.2) |
| Postgraduate | 53 (27.2) |
| Marital status* | |
| Married or living as married | 88 (45.1) |
| Widowed | 19 (9.7) |
| Divorced | 24 (12.3) |
| Separated | 5 (2.6) |
| Never married | 54 (27.7) |
| Household income ($)* | |
| 0-19,999 | 47 (24.1) |
| 20,000-39,999 | 42 (21.5) |
| 40,000-59,999 | 41 (21.0) |
| 60,000-79,999 | 26 (13.3) |
| ≥80,000 | 26 (13.3) |
| Gender* | |
| Male | 28 (14.4) |
| Female | 104 (53.3) |
Some participants were missing data on this variable
The sites also differed in the percentage of participants with less than a college diploma (Table 6). Educational differences were most pronounced in the Denmark, Georgetown, and Ridgeville sites. These three sites included higher percentages of participants with less than a college diploma (62.5%, 60.0%, and 64.0%, respectively). In addition, the Ridgeville site was the only site that included Native American/American Indian participants: 60% of the participants at the Ridgeville site were Native American.
Table 6.
Percentage of Participants at Each Site with Less Than a College Degree
| Site | % |
|---|---|
| Charleston | 35.3 |
| Columbia | 23.8 |
| Denmark | 62.5 |
| Florence | 46.7 |
| Georgetown | 60.0 |
| Greenville | 42.1 |
| Johns Island | 35.7 |
| Orangeburg | 33.3 |
| Orangeburg 2 | 33.3 |
| Ridgeville | 64.0 |
Table 7 shows the number of participants at each site. As noted, almost 90% of those who pre-registered showed up to participate.
Table 7.
Number of Participants at Each Study Site
| Site | County of Site | Program Location | Date of the Program | Number of Pre-Registered Participants | Number of Actual Participants |
|---|---|---|---|---|---|
| Ridgeville | Berkeley | Four Holes Indian Organization Community Center | October 27, 2007 | 34 | 30 |
| Georgetown | Georgetown | Nazareth A.M.E. Church | February 9, 2008 | 29 | 24 |
| Charleston | Charleston | Medical University of South Carolina Hollings Cancer Center | June 21, 2008 | 24 | 22 |
| Greenville | Greenville | Greenville Hospital System | October 25, 2008 | 18 | 18 |
| Orangeburg | Orangeburg | South Carolina State University | November 1, 2008 | 32 | 29 |
| Columbia | Richland | Palmetto Health Baptist Building | May 9, 2009 | 24 | 21 |
| Orangeburg | Orangeburg | South Carolina State University | May 30, 2009 | 20 | 17 |
| Johns Island | Charleston | Johns Island Rural Housing Community Center | June 13, 2009 | 23 | 20 |
| Denmark | Bamberg | Voorhees College | February 27, 2010 | 22 | 18 |
| Florence | Florence | Carolina Hospital System Floyd Conference Center | June 25, 2011 | 16 | 16 |
| Total Number of Participants | 242 | 215 | |||
Seven-Item ARTQ Outcomes From Pretest to Posttest
Of the 195 individuals who participated in the pretest, 184 completed a posttest, but not all of the 184 answered every question on the ARTQ. For each of the seven items on the ARTQ, only those participants that answered each question at both the pre- and posttest were included in the analysis; the number of participants included ranged from n = 118 (question 4) to n = 178 (question 1). For each of the seven items on the ARTQ, the majority of participants who had less favorable perceptions of cancer clinical trials before the intervention changed their perceptions to more positive perceptions of clinical trials from pretest to posttest (p < .01).
For each item, from baseline to post-intervention, more people changed from a negative or uncertain perception to a more positive perception compared with what would be expected by chance. To use Item 1 as an example, in response to the question “Do you think that patients should be asked to take part in medical research?”, 21 out of 178 respondents (12%) gave different answers on the pre- and posttests. However, the fraction changing from No/Don’t Know to Yes was substantially higher than 12%. That is, out of the 22 who responded No/Don’t Know to Item 1 on the pretest, 16 of them changed to Yes at the posttest, which is 73% (p < .001).
The comparison of changes in perception from pre- to posttest is shown in Figure 3. Circles represent point estimates of proportions, and vertical bars are 95% confidence intervals. Solid lines are confidence intervals for changes from Yes to No/Don’t Know. Dashed lines are confidence intervals for changes from No/Don’t Know to Yes. Dotted lines represent the ‘chance alone’ null proportion. The p-values for all comparisons were less than .01 based on two-sided Fisher’s exact tests (Figure 2). For all but one item, fewer than 10% were persuaded to a negative or indifferent attitude from a positive attitude. In contrast, for all items, among those with negative or indifferent attitudes at baseline, greater than 40% reported positive attitudes post-intervention (Figure 3).
Figure 3. Proportion of Respondents Who Changed From Yes to No/Don’t Know Versus No/Don’t Know to Yes for the Seven Items in the Fallowfield Instrument.
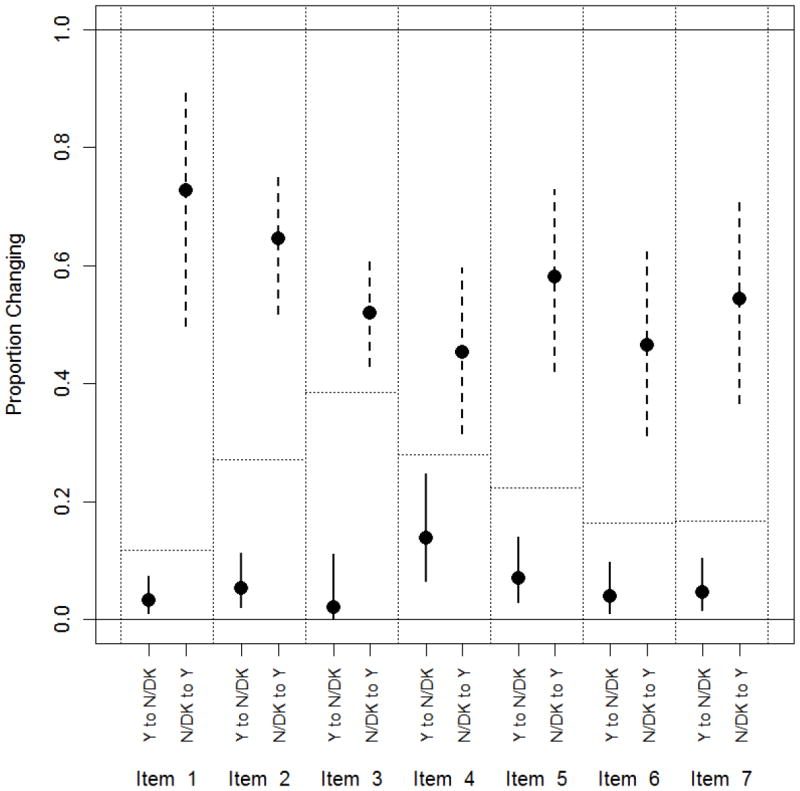
P<0.001 for items 1, 2, 5, 6 and 7; p=0.001 for item 3; p=0.008 for item 4. Horizontal dotted lines show the assumed null proportion of respondents who change their response from baseline.Due to some missing responses, the sample sizes vary per item for items 1 through 7, respectively, as follows: 178, 177, 177, 118, 143, 146, 144.
Although the number of EA in the sample was relatively small (n = 28), changes in perceptions from pre- to posttest within AA and within EA participants (Asian race was not considered owing to the small sample size) were estimated. These results are not shown here, but the patterns of change in perceptions were consistent across races with similar point estimates and overlapping confidence intervals. In only one case (ARTQ item 3) was there a significant difference, with many more AA changing their response from No/Don’t Know to Yes (59/100 [59%]) compared with EA (4/17 [24%]; p = .01). For the remaining 13 comparisons, there were no substantive or significant differences (at the alpha = 0.05 level).
Limitations
The study incorporated a convenience sample that may not have been as representative of the state population might have been seen with a random sampling method. However, efforts were made to include representation of study participants from different geographic regions of South Carolina. Also, the assessment time period was short. The extent to which changes in perceptions of clinical trials were sustained over time was not evaluated.
In addition, although the focus of the present paper is on the outcomes related to cancer clinical trials perceptions, this component of the program cannot be taken out of context from the larger 4-hour program. It is not known whether we would have achieved similar results if the 30-minute cancer clinical trials education component had been used as the entire program instead of included as a component of the current 4-hour program.
Slightly more than half of the study participants were women. It is unclear whether similar responses would have been seen in a sample that had a greater proportion of men. However, in our previous study focusing on recruitment of AA men to a cancer clinical trial, females spouses or partners were found to serve as “gatekeepers” in terms of access to the male study participants. The prior study also showed that women transmitted health information to the men in their lives.7,19
Therefore, in the present study, although efforts were made to include men by publicizing the cancer education sessions in each area with male-dominated organizations such as fraternities, Masonic orders, and ministerial alliances, the investigators felt confident that the women who participated in the sessions would share the information with their husbands, sons, nephews, and so on.
This study has a number of strengths. First, it incorporated a community-based recruitment strategy. The investigators primarily relied on community representatives to recruit participants for each session. The community representatives also identified the community venue for each session. Second, pre- and posttest data show highly statistically significant increases in favorable perceptions of cancer clinical trials. Third, two large cultural groups were represented in the sample. The first group is the Wassamasaw Tribe of Varnertown/Ridgeville and the second group is the Sea Island communities of Georgetown and Johns Island. Participants from the Ridgeville, Georgetown, and Johns Island sites tended to be less educated, medically underserved, and relatively isolated from health care settings.14,20 However, clinical trial perceptions outcomes related to the Wassamasaw Tribe and the Sea Island communities were not different from the outcomes of participants at other sites.
Discussion
The purpose of this study was to conduct a clinical trial education program to impact perceptions of trials among predominantly AA populations in South Carolina. No other studies reported in the literature have evaluated the ARTQ in assessing perceptions of trials among AA; the majority of studies using the ARTQ have been conducted in Europe. As such, the present study makes an important contribution to the research literature.
Results show that the clinical trial education program positively influenced trial perceptions among the AA study participants. Among AA in the present study, 59% of the AA changed their responses from No/Don’t Know at pretest to Yes at posttest, meaning that after the program, they would revise their initial opinion and would actually take part in a trial if one were offered to them. This is similar to the findings from prior use of the measurement instrument, which showed that among 174 individuals (55.2%) who initially said “no” to randomization or were unsure, would actually change their responses and take part in a trial.9
As noted by previous researchers in the UK who used the ARTQ to evaluate perceptions of randomized trials in a sample of 1,066 cancer surgical and oncology clinics from May 2007 to November 2009, 91% (n = 967) responded Yes to question 1, 73% (n = 781) responded Yes to question 2, and 55% (n = 589) responded Yes to question 3. These investigators noted that of the 297 patients who eventually answered “Yes” to question 7, the majority (172 [58%]) had difficulties with the randomization component of participation in medical research. In the present study, the clinical trial education program specifically focused on randomization, using simple cartoons developed by the NIH to pictorially describe the process of randomization. The rationale for and importance of randomization in cancer clinical trials were also discussed during the presentation.
The results of the present study show that as the items in the ARTQ instrument increased in complexity, a smaller proportion of participants changed their responses to more favorable perceptions of trials. For example, Item 4 includes multiple areas of complexity, such as being in a randomized trial and not knowing whether one treatment is better. It may be difficult for the participants to think about these multiple areas of complexity simultaneously while responding to the item. This finding implies that each complex concept could be discussed separately, as the layers of complexity apparently lead to confusion and to less favorable perceptions of trials.
The ARTQ could be used for multiple purposes. It could be administered to potential trial participants to identify those whose trial perceptions indicate that they could benefit from participating in a clinical trials education program. The ARTQ results could thus foster communication about trials and highlight areas where investigators could spend additional time describing the trial design and responding to questions about specific aspects or components of the trial. Based on the positive impact of the program among AA, it could be incorporated as a standard recruitment procedure for trials focusing on augmenting representation of AA in the trials. Similar educational interventions have been used successfully to recruit participants to clinical trials for diseases such as lung cancer21 and diabetes.22
It is important to note that all of the participants in the cancer clinical trials education program received materials that they could use to conduct their own cancer clinical trials education training programs. The rationale for disseminating these materials was to assist participants in sharing cancer clinical trials information with others in their own communities. Therefore, a “Train the Trainer” approach was employed in the clinical trials education program. As reported to the investigators during follow-up telephone calls with the study participants, 40 of the trained participants/ lay facilitators have conducted 104 sessions, reaching 3,292 community members, although data on sociodemographic characteristics or program outcomes are not available for these individuals.
It is possible that the broad reach in the Train the Trainer program is attributable to the relatively high level of education of the initial program participants. According to the 2006 U.S. Census Bureau estimates, only 15.1% of the South Carolina population over the age of 25 has completed their bachelor’s degree.23 In the present study, 27.2% of participants had obtained a college diploma and another 27.2% had completed their postgraduate education. Thus, the participants in this study were more highly educated than the general population of South Carolina.
Changes in knowledge and perceptions are not automatically associated with changes in health behavior. However, the results of a recent study suggest that educating people allows them to make better health decisions because they process health information more effectively. In another study, Lange24 reviewed data from the National Health Interview Survey and found that screening and individual risk assessments have a closer relationship to objective risk factors among educated individuals compared with less educated individuals. These results imply that if people can be educated to process health information more effectively, then they will make more informed (i.e., “better”) health decisions. Therefore, programs such as the cancer clinical trials education program could actually help people to make informed decisions about participating in clinical trials.
Informed decision making is the process of making decisions based on knowledge of risks and probable benefits of different options.25-30 Making informed decisions is particularly crucial in deciding whether to participate in a clinical trial, in which a known quantity is often contrasted with one or more unknown quantities, leading to uncertainty about the association between cancer clinical trial participation and improved health outcomes.
The decision-making process is much more salient for AA than for members of the general population because AA are disproportionately affected by cancer. However, as Langford and colleagues5 note, AAs are significantly less likely than EAs to have heard of a clinical trial. Therefore, programs are needed to provide AAs with the information that they need to make informed decisions about trial participation.
Conclusions
Providing cancer clinical trials information to predominantly AA populations in South Carolina led to more positive perceptions of cancer clinical trials. Future research studies will incorporate a longer follow-up period to assess whether short-term gains are sustained over time and whether the participants actually enrolled in a trial. Also, in future studies, the program outcomes from the sessions conducted by the trained community members will be evaluated.
References
- 1.American Cancer Society. Cancer Facts and Figures for African Americans 2009-2010. Atlanta: Author; 2009. [Google Scholar]
- 2.Ford JG, Howerton M. The science of recruiting minority populations to screening trials. Clin Trials. 2004;1(4):341–2. doi: 10.1191/1740774504cn034ed. [DOI] [PubMed] [Google Scholar]
- 3.Lai GY, Gary TL, Tilburt J, Bolen S, Baffi C, Wilson RF, et al. Effectiveness of strategies to recruit underrepresented popu- lations into cancer clinical trials. Clin Trials. 2006;3(2):133–41. doi: 10.1191/1740774506cn143oa. [DOI] [PubMed] [Google Scholar]
- 4.Joseph G, Dohan D. Diversity of participants in clinical trials in an academic medical center: The role of the “Good Study Patient?”. Cancer. 2009;115(3):608–15. doi: 10.1002/cncr.24028. [DOI] [PubMed] [Google Scholar]
- 5.Langford A, Resnicow K, An L. Clinical trial awareness among racial/ethnic minorities in HINTS 2007: Sociodemographic, attitudinal, and knowledge correlates. Journal of Health Communication. 2010;15(Suppl 3):92–101. doi: 10.1080/10810730.2010.525296. [DOI] [PMC free article] [PubMed] [Google Scholar]
- 6.Pinsky PF, Ford M, Gamito E, Higgins D, Jenkins V, Lamerato L, et al. Enrollment of racial and ethnic minorities in the Prostate, Lung, Colorectal and Ovarian Cancer Screening Trial. J Natl Med Assoc. 2008;100(3):291–8. doi: 10.1016/s0027-9684(15)31241-4. [DOI] [PubMed] [Google Scholar]
- 7.Ford ME, Havstad SL, Davis SD. A randomized trial of recruitment methods for older African American men in the Prostate, Lung, Colorectal and Ovarian (PLCO) Cancer Screening Trial. Clin Trials. 2004;1(4):343–51. doi: 10.1191/1740774504cn029oa. [DOI] [PubMed] [Google Scholar]
- 8.Ford ME, Havstad SL, Fields ME, Manigo B, McClary B, Lamerato L. Effects of baseline comorbidities on cancer screening trial adherence among older African American men. Cancer Epidemiol Biomarkers Prev. 2008;17(5):1234–9. doi: 10.1158/1055-9965.EPI-08-0118. [DOI] [PMC free article] [PubMed] [Google Scholar]
- 9.Fallowfield LJ, Jenkins V, Brennan C, Sawtell M, Moynihan C, Souhami RL. Attitudes of patients to randomised clinical trials of cancer therapy. Eur J Cancer. 1998;34(10):1554–9. doi: 10.1016/s0959-8049(98)00193-2. [DOI] [PubMed] [Google Scholar]
- 10.Giuliano AR, Mokuau N, Hughes C, Torolero-Luna G, Risendeal B, Ho RCS, et al. Participation of minorities in cancer research: The influence of structural, cultural, and linguistic factors. Ann Epidemiol. 2000;10(8 Suppl):S22–34. doi: 10.1016/s1047-2797(00)00195-2. [DOI] [PubMed] [Google Scholar]
- 11.Swanson GM, Ward AJ. Recruiting minorities into clinical trials: Toward a participant-friendly system. J Natl Cancer Inst. 1995;87(23):1747–59. doi: 10.1093/jnci/87.23.1747. [DOI] [PubMed] [Google Scholar]
- 12.Freimuth VS, Quinn SC, Thomas SB, Cole G, Zook E, Duncan T. African Americans’ views on research and the Tuskegee Syphilis Study. Soc Sci Med. 2001;52(5):797–808. doi: 10.1016/s0277-9536(00)00178-7. [DOI] [PubMed] [Google Scholar]
- 13.U.S. Centers for Disease Control and Prevention. CDC Behavioral Risk Factor Surveillance System survey data 2010. Atlanta: Author; 2011. [Google Scholar]
- 14.Ford ME, Wahlquist AE, Ridgeway C, Streets J, Mithcum KA, Harper RR, Jr, et al. Evaluating an intervention to increase cancer knowledge in racially diverse communities in South Carolina. Patient Educ Counsel. 2011;83:256–60. doi: 10.1016/j.pec.2010.05.028. [DOI] [PMC free article] [PubMed] [Google Scholar]
- 15.McCaskill-Stevens W, Pinto H, Marcus AC, Comis R, Morgan R, Plomer K, et al. Recruiting minority cancer patients into cancer clinical trials: A pilot project involving the Eastern Cooperative Oncology Group and the National Medical Associ- ation. J Clin Oncol. 1999;17(3):1029–39. doi: 10.1200/JCO.1999.17.3.1029. [DOI] [PubMed] [Google Scholar]
- 16.Thomas SB, Quinn SC. The Tuskegee Syphilis Study, 1932 to 1972: Implications for HIV education and AIDS risk educa- tion programs in the black community. Am J Public Health. 1991;81(11):1498–505. doi: 10.2105/ajph.81.11.1498. [DOI] [PMC free article] [PubMed] [Google Scholar]
- 17.Jenkins V, Farewell D, Batt L, Maughan T, Branston L, Langridge C, et al. The attitudes of 1066 patients with cancer towards participation in randomised clinical trials. Br J Cancer. 2010;103(12):1801–7. doi: 10.1038/sj.bjc.6606004. [DOI] [PMC free article] [PubMed] [Google Scholar]
- 18.Fleissig A, Jenkins V, Fallowfield L. Results of an intervention study to improve communication about randomised clinical trials of cancer therapy. Eur J Cancer. 2001;37(3):322–31. doi: 10.1016/s0959-8049(00)00415-9. [DOI] [PubMed] [Google Scholar]
- 19.Ford DW, Nietert PJ, Zapka J, Zoller JS, Silvestri GA. Barriers to hospice enrollment among lung cancer patients: A survey of family members and physicians. Palliat Support Care. 2008;6(4):357–62. doi: 10.1017/S1478951508000564. [DOI] [PubMed] [Google Scholar]
- 20.American Indians & cancer. Available from: http://iccnetwork.org/cancerfacts/ICC-CFS2.pdf.
- 21.Du W, Mood D, Gadgeel S, Simon MS. An educational video to increase clinical trials enrollment among lung cancer patients. J Thorac Oncol. 2008;3(1):23–9. doi: 10.1097/JTO.0b013e31815e8bb2. [DOI] [PubMed] [Google Scholar]
- 22.Santoyo-Olsson J, Cabrera J, Freyre R, Grossman M, Alvarez N, Mathur D, et al. An innovative multiphased strategy to recruit under- served adults into a randomized trial of a community-based diabetes risk reduction program. Gerontologist. 2011;51(Suppl 1):S82–93. doi: 10.1093/geront/gnr026. [DOI] [PMC free article] [PubMed] [Google Scholar]
- 23.Selected social characteristics in the United States. Washington, DC: United States Census Bureau; 2006. [Google Scholar]
- 24.Lange F. The role of education in complex health decisions :evidence from cancer screening. J Health Econ. 2011;30(1):43–54. doi: 10.1016/j.jhealeco.2010.08.008. [DOI] [PubMed] [Google Scholar]
- 25.Briss P, Rimer B, Reilley B, Coates RC, Lee NC, Mullen P, et al. Promoting informed decisions about cancer screening in commu- nities and healthcare systems. Am J Prev Med. 2004;26(1):67–80. doi: 10.1016/j.amepre.2003.09.012. [DOI] [PubMed] [Google Scholar]
- 26.Gafni A, Charles C, Whelan T. The physician-patient encounter: The physician as a perfect agent for the patient versus the informed treatment decision-making model. Soc Sci Med. 1998;47(3):347–54. doi: 10.1016/s0277-9536(98)00091-4. [DOI] [PubMed] [Google Scholar]
- 27.Gattellari M, Ward JE. A community-based randomised controlled trial of three different educational resources for men about prostate cancer screening. Patient Educ Couns. 2005;57(2):168–82. doi: 10.1016/j.pec.2004.05.011. [DOI] [PubMed] [Google Scholar]
- 28.Piercy GB, Deber R, Trachtenberg J, Ramsey EW, Norman RW, Goldenberg SL, et al. Impact of a shared decision-making program on patients with benign prostatic hyperplasia. Urology. 1999;53(5):913–20. doi: 10.1016/s0090-4295(99)00051-5. [DOI] [PubMed] [Google Scholar]
- 29.Stevenson FA, Barry CA, Britten N, Barber N, Bradely CP. Doctor-patient communication about drugs: The evidence for shared decision making. Soc Sci Med. 2000;50(6):829–40. doi: 10.1016/s0277-9536(99)00376-7. [DOI] [PubMed] [Google Scholar]
- 30.Volk RJ, Jibaja-Weiss ML, Hawley ST, Kneuper S, Spann SJ, Miles BJ, et al. Entertainment education for prostate cancer screening: A randomized trial among primary care patients with low health literacy. Patient Educ Couns. 2008;73(3):482–9. doi: 10.1016/j.pec.2008.07.033. [DOI] [PMC free article] [PubMed] [Google Scholar]
- 31.South Carolina Department of Environmental Control website [Internet] Columbia (SC): [2012 Sept 1]. Available from: ttp://scangis.dhec.sc.gov/scan/cancer2/mortinput.aspx. [Google Scholar]