Abstract
This paper describes a silica nanoparticle-modified microfluidic paper-based analytical device (μPAD) with improved color intensity and uniformity for three different enzymatic reactions with clinical relevance (lactate, glucose, and glutamate). The μPADs were produced on Whatman grade 1 filter paper and using a CO2 laser engraver. Silica nanoparticles modified with 3-aminopropyltriethoxysilane (APTES) were then added to the paper devices to facilitate the adsorption of selected enzymes and prevent the washing away effect that creates color gradients in the colorimetric measurements. Here we show three different enzymatic assays for compounds. According to the results herein described, the addition of silica nanoparticles yielded to significant improvements in color intensity and uniformity. The resulting μPADs allowed for the detection of the three analytes in clinically-relevant concentration ranges with limits of detection (LOD) of 0.63 mM, 0.50 mM, and 0.25 mM for lactate, glucose, and glutamate, respectively. An example of an analytical application has been demonstrated for the semi-quantitative detection of all three analytes in artificial urine. The results demonstrate the potential of silica nanoparticles to avoid the washing away effect and improve the color uniformity and intensity in colorimetric bioassays performed on μPADs.
Keywords: Immobilization process, nanomaterials, CO2-laser, colorimetric assays, μPADs
1. Introduction
In the last decade, the interest to develop paper-based analytical platforms has grown exponentially. Their low-cost, availability of different fabrication techniques, safe disposal, low consumption of reagents and sample, high potential for remote use, and capability to provide semi-quantitative results for a series of analytes are some of the top reasons behind the success of microfluidic paper-based analytical devices (μPADs).1-5 Furthermore, since their initial development, μPADs have been employed for a variety of applications including immunoassays,6 environmental monitoring,7, 8 bioterrorism,9 and urinalysis.3, 10 While there are many detection methods for μPADs, such as electrochemical,11 transmittance,12 electrochemiluminescence,13 chemiluminescence,6, 14 and fluorescence;9, 15 colorimetric detection16-19 has been the most widely adopted technique for μPADs. The success of this detection method can be attributed to the simplicity of the final response, which can be converted to a semi-quantitative numerical value using a calibration curve obtained with an image from a cellphone camera or portable scanner. Most often, these assays are based on the selective oxidation of the analyte followed by a peroxidase-based reaction20 that catalyzes the oxidation of a chromogenic agent21, 22 that yields to a color change.23 Although there are several drawbacks associated with this technology, the most remarkable one is the heterogeneity of the color distribution in the detection zones. This issue, which can be attributed to the mobility of enzymes and reagents towards the edge of the detection zone when the sample wicks up the hydrophilic channels, can result in increased variability and poor judgment of the final color by the user.1, 24Several strategies can be adopted to overcome this problem, including controlling the volume of reactants and the sample's wicking velocity.25 Among those directed to the immobilization of the enzymes via chemical modification to the cellulose26-28 it is worth mentioning the addition of succinic anhydride,29 sodium periodate,30 or 3-aminopropyltrimethoxysilane (APTES).31 These modifications result in the formation of carbonyl, aldehyde, or amino groups than can be used to permanently immobilize enzymes using covalent bonds and well-known conditions. μPADs can also be modified using ceria nanoparticles,22 gold nanoparticles,32 silver nanoparticles,33, 34 and carbon nanotubes35, 36 to aid with the detection step. Although each of these strategies presents their own advantages, they are not widely applicable and require the implementation of specific processes. Aiming to address these shortcomings, the hypothesis of this project was that silica nanoparticles, trapped within the structure of the cellulose, could provide a simple and efficient way to immobilize the components of the analysis and therefore improve the overall performance of colorimetric detection on μPADs. Due to their clinical relevance17, 37, 38 the experiments herein described were focused on the analysis of lactate, glucose, and glutamate in artificial urine; providing a non-invasive and highly abundant sample to assess the effectiveness of the proposed strategy.
2. Experimental Section
2.1 Material and Reagents
Glucose oxidase (from Aspergillus niger, 17300 U·g-1) (GOx), peroxidase type II (from horseradish 199 pupurogallin, U·mg-1) (HRP), lactate oxidase (from Pediococcus sp. 20 U·mg-1) (LOx), L-glutamate oxidase (from Streptomyces sp., 5 U·mg-1) (LGOx), D-(+)-glucose, sodium-L-lactate, sodium 3,5-dichloro-2-hydroxy-benzenesulfonic acid (DHBS), 3-aminopropyltriethoxysilane (99%) (APTES), silicon dioxide nanopowder (15 nm), ethanol (99.5%), L-glutamic acid (Glu), 3,3′,5,5′-tetramethylbenzidine ≥98% (TMB), citric acid, sodium bicarbonate, urea, sodium sulfate, and ammonium chloride were purchased from Sigma-Aldrich (St. Louis, MO). 4-aminoantipyrine (AAP) was obtained from Alfa Aesar (Ward Hill, MA). Calcium chloride and potassium iodide (KI) were purchased from E.M. Science (Gibbstown, NJ). Sodium phosphate monobasic anhydrous and sodium phosphate dibasic anhydrous were received from Fisher Scientific (Waltham, MA). D-(+)-trehalose anhydrous was obtained from TCI American (Portland, OR). Sodium chloride and magnesium sulfate were purchased from Mallinckrodt Baker (now Avantor Performance Materials; Center Valley, PA). Following a recent publication from our group,25 experiments were carried out on filter paper #1, obtained from Whatman (Maidson Kent, UK). All chemicals were used as received and made in ultrapure water (18 MΩ·cm-1, Barnstead Nanopure; Dubuque, IA) without further purification. For the analysis, a standard solution containing the highest concentrations of each analyte (25 mmol·L-1 lactate, 20 mmol·L-1 glucose, and 10 mmol·L-1 glutamate) was prepared in 100 mmol·L-1 PBS (pH=6.0) and diluted at different ratios to cover the concentration ranges utilized in the calibration curves.
The ellipsometry experiments were performed using standard <111> silicon wafers (Si/SiO2, Sumco Corporation; Phoenix, AZ) that were scored using a computer-controlled engraver (Gravograph IS400, Gravotech; Duluth, GA). The substrates were then manually cut (1 cm in width and 4 cm in length), cleaned in piranha solution (30% H2O2: 70% sulfuric acid) at 90 °C for 30 min, thoroughly rinsed it with DI water, and dried in a convective oven.
2.2 Instrumentation
Numerous techniques have been employed for the fabrication of μPADs, including photolithography, plotting, screen printing, inkjet etching, plasma etching, inkjet printing, flexographic printing, PDMS printing, printed circuit technology, laser cutting, and wax printing.1, 2, 39, 40 Among the diverse fabrication procedures, laser cutting from a predesigned pattern is a one-step straightforward method for fabrication of μPADs.16 For that reason, a commercial CO2 laser engraver (Mini 24, 30W, Epilog Laser Systems; Golden, CO) was used to cut the paper and produce the μPADs. Details about the system and its capabilities can be found elsewhere.41 This system was connected to an air filter (model AD350, BOFA; Staunton, IL), equipped with a HEPA / activated aluminum / potassium permanganate and an activated carbon panel to remove fumes from the engraver. To minimize the risk of ignition of the paper during the cutting process, a stream of N2 was impinged on the engraving point. The layout for the μPAD was designed using CorelDraw X6 and cut using 600-dpi resolution, 30% power, and 30% speed. This process resulted in the ablation of the edge of the microfluidic design and the creation of a hydrophobic boundary.16 To gain insight about the density and distribution of the SiO2 nanoparticles on the paper, scanning electron microscopy (SEM, JEOL/EO, JSM-6510; Peabody, MA) was used.
2.3 Enzymatic Solutions and Colorimetric Detection
All assays were prepared using solutions containing either a mixture of the enzymes or the chromogenic agent. For the glucose assay, a 1:5 mixture of HRP (339 U·mL-1, in 100 mmol·L-1 PBS pH=6.0) and GOx (645 U·mL-1, in 100 mmol·L-1 PBS pH=6.0) was prepared. The chromogenic reagent was prepared using KI and trehalose, dissolved in 100 mmol·L-1 PBS (pH=6.0) to a final concentration of 0.6 and 0.3 mol·L-1, respectively. For the lactate detection, a 1:1 mixture of LOx (100 U·mL-1, in 100 mmol·L-1 PBS pH=6.0) and HRP (339 U·mL-1, in 100 mmol·L-1 PBS pH=6.0) was prepared. In this case, 4-AAP and DHBS (6.6 mmol·L-1) were dissolved in 100 mmol·L-1 PBS (pH=6.0) and kept in the fridge covered with aluminum foil to refrain from light. For the glutamate assay, a 1:1 mixture of LGOx (4.16 U·mL-1, in 100 mmol·L-1 PBS pH=7.4) and HRP (339 U·mL-1, in 100 mmol·L-1 PBS pH=6) was prepared. TMB (15 mmol·L-1, dissolved in EtOH and kept in the fridge covered in aluminum foil to refrain from light)42 was selected as the chromogenic agent.
The μPADs were modified with silica nanoparticles (vide infra) and then thoroughly rinsed with PBS (pH=6.0) to remove the excess particles from the surface of the paper. Afterwards, 1 μL of the solution containing the selected enzymes was spotted on the detection zone and dried at room temperature for 15 min. Next, 1 μL of the solution containing the selected chromogenic agent was spotted on the detection zone and dried at room temperature for another 15 min. Finally, solutions containing the analytes (10μL) were introduced to the μPADs at the bottom extremity of the center channel and allowed to reach the detection zones by capillarity. After 30 min, an image of the device was acquired using a flatbed scanner (Canon, CanonScan Lide700F) and then analyzed using Adobe Photoshop CS6.
2.4 Artificial Urine Sample
In agreement with previous reports,11, 16, 43 the artificial urine was prepared at pH = 6.0 and comprised of 2 mM citric acid, 25 mM sodium bicarbonate, 170 mM urea, 2.5 mM calcium chloride, 90 mM sodium chloride, 2 mM magnesium sulfate, 10 mM sodium sulfate, 7 mM sodium phosphate monobasic anhydrous, 7 mM sodium phosphate dibasic anhydrous, and 25 mM ammonium chloride. This solution was stored in the refrigerator (4 °C) until use.
2.5 Spectroscopic Ellipsometry
Ellipsometric experiments, used to investigate the enzyme adsorption process to a SiO2 substrate, were performed using a variable angle spectroscopic ellipsometer (WVASE, J.A. Woollam Co.; Lincoln, NE) following a procedure described elsewhere.44-46 The collected data (amplitude ratio (Ψ) and phase difference (Δ) as function of wavelength or time) was modeled using the WVASE software package (J.A. Woollam Co.; Lincoln, NE) and the mean square error (MSE, calculated by a built-in function in WVASE) was used to quantify the difference between the experimental and model-generated data. In agreement with previous reports, MSE < 15 were considered acceptable.45, 47 The ellipsometric measurements were interpreted using an optical model that considered the dielectric properties of Si (bulk, d = 1 mm) and SiO2 (d = 2.1 ± 0.5 nm). A standard Cauchy function was added to describe the optical properties of the APTES layer (d = 0.89 ± 0.06 nm).48 Finally, and when pertinent, optical properties of the enzyme adsorbed on the substrates were also described with an additional Cauchy function. Dynamic adsorption experiments, performed to determine the adsorption time, were carried out in a modified electrochemical cell (J.A. Woollam Co.; Lincoln, NE) mounted directly on the vertical base of the ellipsometer, with an incident angle of 70°. First, a spectroscopic scan of either the silica wafer (Si/SiO2) or the silica wafer modified with APTES (Si/SiO2/APTES) was measured (from 300 to 800 nm, with 10 nm step) by placing the substrate in the ellipsometry cell using buffer solution (100 mmol·L-1 PBS, pH=6.0) as the aqueous medium. Next, the adsorption experiment was started recording a baseline while buffer solution was pumped with a peristaltic pump (Gilson Minipuls 3; Middleton, WI) inside the cell at a rate of 1 mL·min-1. After 20 min of baseline, the enzyme solution was injected to allow the absorption of a monolayer of GOx on the substrate surface. When a plateau in the signal was noticed, the buffer solution was pumped again into the cell for 20 minutes in order to evaluate the stability of GOx layer formed on the substrate. Lastly, a spectroscopic scan was performed to obtain the thickness of the enzyme layer; which allows calculating the change in thickness and adsorbed amount of GOx during the dynamic adsorption experiment.
3. Results and Discussion
Based on the current literature, it is clear that μPADS represent one the most powerful tools in the field of modern chemical analysis. However, the poor uniformity and homogeneity associated with colorimetric measurements represent some the most important shortcomings of this technology. Aiming to solve this problem, SiO2 nanoparticles were modified with amine groups, immobilized with the structure of the paper, and used to support the enzymes required for the selected tests. Therefore, the experiments herein described address the criteria used for the selection of the conditions for the modification of the nanoparticles, the adsorption of the enzyme, and the evaluation of the resulting analytical devices.
3.1. Modification and deposition of the SiO2 nanoparticles
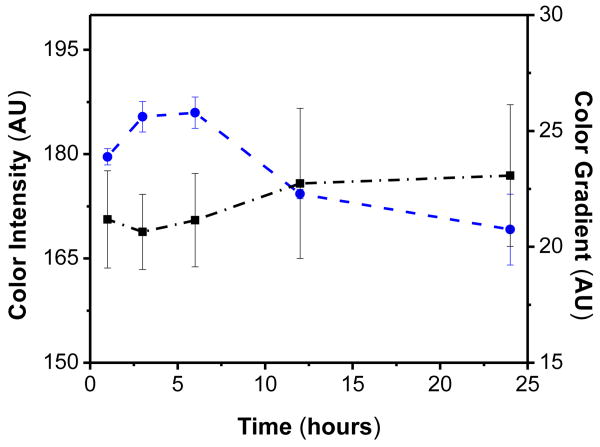
In order to enhance the protein adsorption process and their immobilization to the cellulose, a silane-coupling reaction was carried out to introduce amine groups on the surface of the silica nanoparticles. Although previously applied for the detection of IgG using micro-zones plates, silica microbeads modified with this reaction have increased the adsorption of proteins by 20-700%.49 For this reaction, a solution of 5% (v/v) APTES was first prepared in ethanol. Then, 3.3 mg of the SiO2 nanoparticles were added to the solution and thoroughly mixed to form a uniform suspension that was placed on an orbital shaker. Because a number of variables can affect the density of amine groups50, 51 and the subsequent adsorption of the enzymes to the SiO2 surface,52 the effect of the time of contact between nanoparticles with APTES solution on the color intensity and color gradient was first investigated. For these experiments, the SiO2 nanoparticles were mixed with the APTES solution and vortexed for different periods of time, ranging from 1 to 24 hours. Then, μPADs were immersed in the nanoparticle suspension, dried at room temperature and modified using the protocol for glucose assay as described earlier. The results are summarized in Figure 1A. As it can be observed, the modification time has significant effects on the color intensity but almost no effect on the color gradient (within the experimental error). These results could be attributed to a balance between the amount of protein adsorbed to the surface of the nanoparticles and the strength of the interaction. While at short reaction times there may not be enough groups on the surface to support the enzyme dispensed, longer reaction times could render the surface too hydrophobic; therefore inducing conformational changes in the adsorbed enzyme and resulting in lower catalytic activities. Considering these results, particles modified for 3 hours were used for the remaining experiments described in this manuscript.
Figure 1A.
Effect of modification time of silica nanoparticles with APTES on the color (●) intensity and (▪) gradient.
These nanoparticles were deposited on the surface of the μPAD via two different methods, either by dispensing the suspension using an automatic pipette or by immersion. It was observed that when particles (1 μL of a suspension) were deposited on the surface of the μPAD using a pipette, they remained around the application point (data not shown). This behavior was attributed to the fact that even small aggregates of the nanoparticles cannot move through the three-dimensional structure of the cellulose and therefore tend to accumulate at the seeding point. In order to achieve a uniform distribution of the nanoparticles, μPADs were placed on a Petri dish, covered with a suspension of the nanoparticles, and then left until the complete evaporation of the solvent (around 30 min). Before their use, the μPADs were rinsed with PBS to remove loosely-bound nanoparticles. Figure 1B shows a representative SEM image of the detection zone after the modification with the SiO2 nanoparticles. Considering that the most homogenous distribution of nanoparticles would lead to a more homogeneous distribution of the enzymes (and, consequently, better color uniformity), μPADs prepared by immersion were used for the remaining experiments described in this manuscript.
Figure 1B.
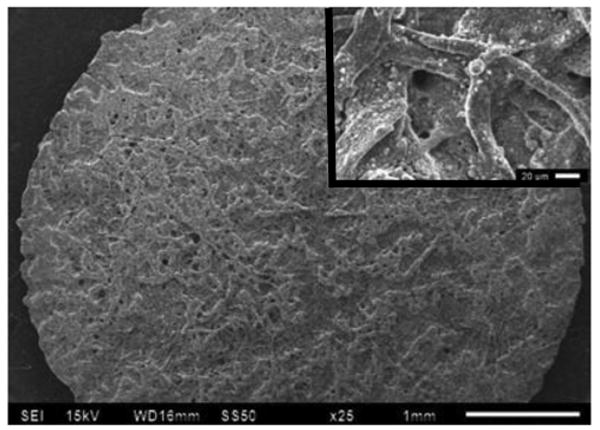
SEM of the detection zone of a μPAD after the deposition of SiO2 nanoparticles by immersion.
3.2 Adsorption of GOx onto SiO2 and SiO2/APTES Substrates
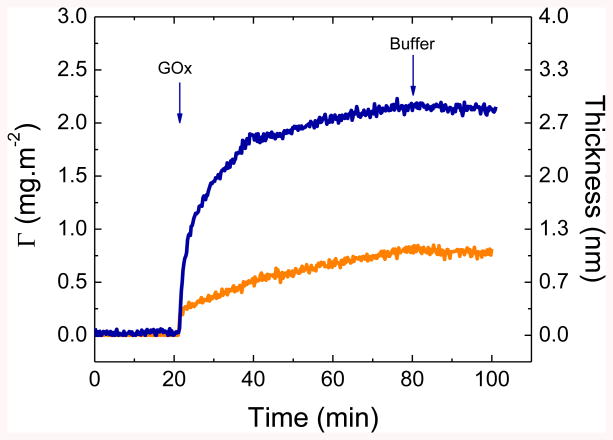
Being crystalline and highly charged, bare SiO2 surfaces only allow for the adsorption of certain proteins.53-56 Therefore, and in order to increase the adsorption capacity of the surface, a modification with APTES was implemented. In order to determine the time required for the enzymes to saturate the surface and estimate the amount of protein immobilized, dynamic adsorption experiments were performed using GOx as the model enzyme. Although the curvature of the surface can also play a key role in the activity of the adsorbed protein,57, 58 the surface of the SiO2 nanoparticle was mimicked using silica wafers, which were also modified using the procedure described for the nanoparticles. In order to prevent potential desorption of the enzyme upon the interaction with the urine sample, adsorption experiments were performed at pH = 6.0. Figure 2 shows a representative example of the dynamic adsorption experiments performed with GOx onto either the silica surface before (Si/SiO2) or after the modification with APTES (Si/SiO2/APTES).
Figure 2.
Adsorption of GOx (1 mg·mL-1, pH = 6.0) onto either a Si/SiO2 (orange curve) or a Si/SiO2/APTES (blue curve) substrate. The arrows show the time which the enzyme solution impinging on the substrate was replaced by the buffer solution.
As it can be observed for both cases, the adsorption proceeds as a fast process and gradually slows down as the surface coverage increased. It is important to note that while fast initial adsorption rates were obtained with both surfaces, significantly higher amounts were adsorbed upon the modification with APTES. For the case of the bare SiO2 surfaces, the initial adsorption process (dΓ/t0 = 0.4 ± 0.1 mg·m-2·min-1) quickly slowed down, leading to an adsorbed amount of only 0.8 ± 0.1 mg·m-2 and a thickness of 1.1 ± 0.1 nm within the 80 min experiment. Considering the dimensions of the enzyme (8.0 nm × 7.0 nm × 5.5 nm59), these results suggest that a surface coverage of less than 20% was obtained within the timeframe investigated. For the case of Si/SiO2/APTES, the adsorption of GOx also proceeded as a fast initial process (dΓ/t0 = 0.7± 0.1 mg·m-2·min-1) and reached approximately 95% of the saturation amount within 20 min after the protein injection. Under these conditions, a GOx layer with a thickness of 2.7 ± 0.1 nm (corresponding to Γ=2.2 ± 0.1 mg·m-2) was formed on the surface. These values suggest the formation of an incomplete monolayer on the surface, where GOx adopts a side-on conformation and a surface coverage of at least 50%. Experimental data also revealed that the protein layer could not be removed from the substrate when the buffer solution was allowed to impinge on the adsorbed protein film (Figure 2, at t=80 min for 20 min). This finding was considered fundamental as it demonstrated that the enzyme remained on the surface (within the timeframe of the experiment) after a washing step, therefore supporting the possibility to use adsorption as the immobilization method.
The difference in the behavior observed at both surfaces can be related to the nature of the physicochemical interactions between the enzyme molecules and the solid surface. In general, the adsorption process is driven by short- and long-range forces resulting from a combination of electrostatic interactions between the protein and the solid surface,60-62 co-adsorption of small ions, dispersion forces, changes in the state of hydration of the sorbent surface and parts of the protein molecule, and structural rearrangements in the protein.63-66 Consequently, the differences in thickness and adsorbed amount observed between the Si/SiO2 and Si/SiO2/APTES substrates can be explained considering the role of electrostatic interactions. At pH = 6 (the working pH), both the GOx (IEP = 4.267) and SiO2 surface (IEP = 2.068) were negatively charged resulting in the adsorption process being limited by electrostatic repulsions between the surface and the protein as well as between proteins. On the other side, when the surface was modified with APTES (IEP = 7.469) the electrostatic interactions between the protein and the surface were neutralized, resulting in a higher density of GOx on the surface. While these experiments were performed with GOx, the similar structure of LOx and LGOx70, 71 suggests that a similar behavior can be expected with the other enzymes.
3.3 Analytical Performance
In order to demonstrate the advantages of the proposed approach on the analytical performance of μPADs, the color intensity and uniformity of three enzymatic reactions was evaluated. For this purpose, lactate, glucose, and glutamate were selected as target analytes. Since the kidneys normally reabsorb them, no lactate or glucose are excreted into the urine when present in plasma at normal levels. However, high levels of lactate (above 2.5 mM) can be found in patients with glycogen storage disease type-I and may indicate that the liver may not able to convert enough glucose from glucose-6-phosphate.72, 73 As it is essential to manage and control diabetes72 and affects millions of patients worldwide, glucose is one of the most assayed molecules. Elevated urinary glutamic acid levels have been associated with a 4-fold higher risk for migraines in females.74 Beyond their clinical relevance, the three selected reactions are catalyzed by enzymes with well-known properties, and use a simple, oxygen-dependent reaction that produces H2O2.75 The H2O2 is then utilized to oxidize a chromogenic agent in a secondary reaction catalyzed with HRP.76
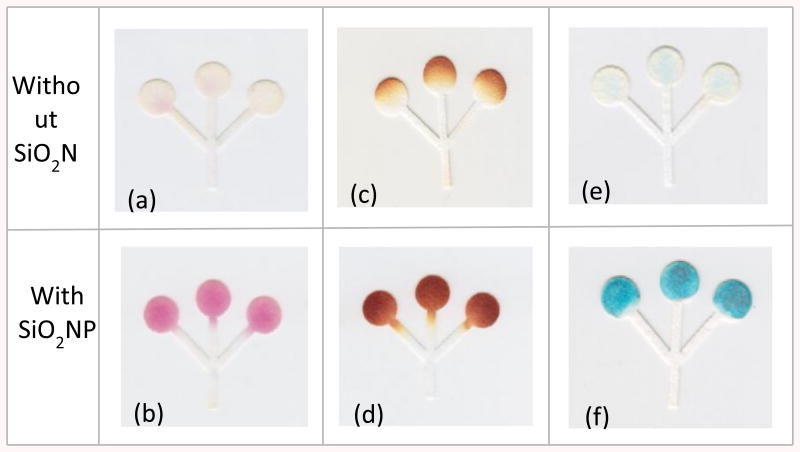
The enzymatic tests were performed on paper devices either with or without nanoparticles and prepared as described in the experimental section. As it can be observed in Figure 3, significant improvements in the signal intensity and color homogeneity were obtained when silica nanoparticles were used to support the enzymes. As previously hypothesized, the improvements in both intensity and uniformity can be explained by considering that silica nanoparticles, trapped within the three-dimensional structure of the cellulose, can provide a solid surface to immobilize the enzymes and therefore minimize the transport of the reactants as the solution wicks the device.
Figure 3.
Optical images showing the colorimetric assays for (a, b) lactate, (c, d) glucose, and (e, f) glutamate assays on native (without SiO2) and silica-modified (with SiO2) papers. The concentrations for the lactate, glucose, and glutamate were 1.5, 20, and 10 mM, respectively.
Besides the visual evidence, the images were analyzed to obtain quantitative information of the effect of SiO2 nanoparticles on the color intensity and homogeneity. It was observed (see Supplementary Information) that the addition of SiO2 nanoparticles yielded improvements in color intensity (when compared with the same reaction on native paper) of 92%, 46% and 61% for the detection of lactate, glucose, and glutamate tests, respectively. These values are related to the gain in color intensity taking into account the values recorded on native paper by calculating the percent difference. Although the addition of nanoparticles reduced the color gradient by 75% for the glucose assay, only slight improvements were obtained for the lactate and glutamate assays. This difference can be attributed to the poor color formed in the lactate and glutamate assays in the absence of the nanoparticles, therefore skewing the results.
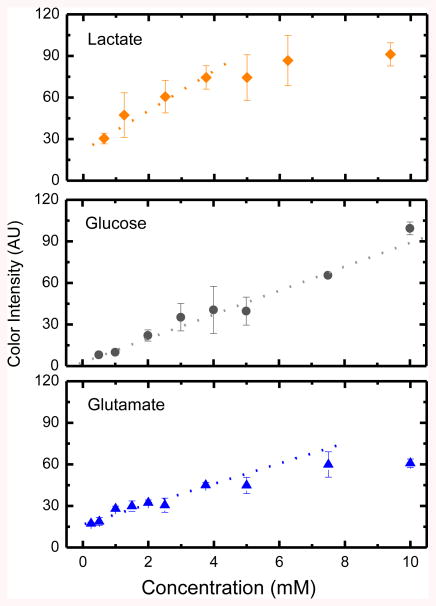
Calibration curves using nanoparticle-modified μPADs were then generated by sequentially spotting the reaction-zones with the reagents for lactate, glucose, and glutamate, and then mixtures of the corresponding analytes at different concentration levels. Measurements were performed at least three times and the mean intensity and relative standard deviations are shown in Figure 4. In general it can be observed that within the investigated concentration range (0-10 mM), higher concentrations led to higher color intensities. Under the optimized conditions also, linear relationships were obtained between the concentration and the resulting color intensity for lactate (0.63 – 3.75 mM), glucose (0.5–10 mM), and glutamate (0.25– 7.50 mM). The limits of detection (LOD), calculated as the lowest concentration leading to a signal that was proportional to the concentration of the analyte and with a magnitude of at least three times the standard deviation of the blank, were 0.63 mM, 0.50 mM, and 0.25 mM for lactate, glucose, and glutamate, respectively. In agreement with the trend shown in Figure 3, control calibration curves performed for each analyte on devices fabricated without SiO2 nanoparticles yielded to lower sensitivity values and were significantly affected by signal heterogeneity (data not shown). It is also important to highlight that while several batches of the μPADs were used to collect the data reported in this manuscript, no statistical difference was observed.
Figure 4.
Calibration curves for lactate (y=14× + 22, R2=0.98), glucose (y=8.6× + 2, R2=0.99), and glutamate (y=7.5× + 7, R2=0.94) assays performed on μPADs containing chemically modified silica nanoparticles.
3.4 Analyses in Artificial Urine
The utility of the proposed μPADs for the quantification of lactate, glucose, and glutamate levels in artificial urine samples was also investigated considering the clinically-relevant levels of lactate, glucose, and glutamate in urine.17, 38, 77 For these experiments, the artificial urine (prepared as described in the Experimental Section) was spiked with relevant concentrations of lactate (2.14 mM), glucose (7.33 mM), and glutamate (4.21 mM) and analyzed on μPADs modified with SiO2 nanoparticles. As it can be observed in Figure 5, the proposed μPADs allowed the simultaneous analysis of the three analytes after the 30 min reaction. The color developed in each detection zone fell within the expected color intensity, calculated from each respective linear equation. Specifically, lactate was expected to have an intensity of 52 AU and the actual intensity was 58 ± 7 AU; glucose expected intensity was 66 AU and it read 71 ± 7 AU; and glutamate was expected to develop an intensity of 49 AU and read 57 ± 9 AU. These values (that are within one standard deviation of the expected results) were considered acceptable for the goals of the proposed project.
Figure 5.
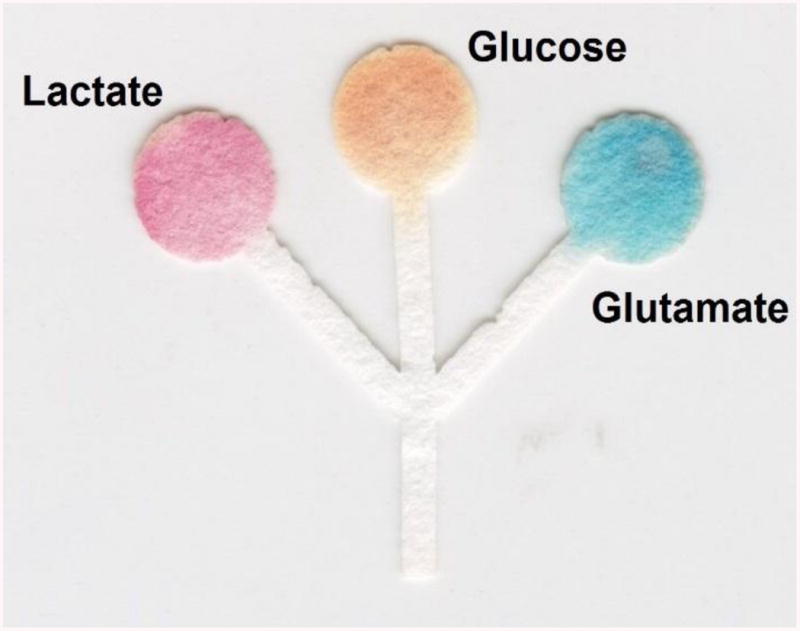
Optical image showing the analysis of an artificial urine sample spiked with lactate, glucose, and glutamate on the proposed μPAD.
4. Conclusions
This current study has described a simple and rapid process to modify μPADs with SiO2 nanoparticles. The devices were fabricated using a CO2 laser engraver and then immersed in a suspension containing the APTES-modified silica nanoparticles. These particles, trapped within the structure of the cellulose, served as a solid support to immobilize the enzymes responsible for the colorimetric reaction. By significantly improving the color intensity and color uniformity, the addition of these nanoparticles allows overcoming one of the major drawbacks of colorimetric detection on μPADs. The platform was successfully applied to the qualitative (presence) and semi-quantitative analysis of lactate, glucose, and glutamate in urine samples. As such the devices can provide a strong platform to perform point-of-care testing in communities with limited resources. Furthermore, it is expected that other nanoparticles or nanomaterials will also allow the development of additional biochemical assays.
Supplementary Material
Acknowledgments
Financial support for this project has been provided in part by the University of Texas at San Antonio, the National Institutes of Health through the Research Centers at Minority Institutions (G12MD007591), and the National Institutes of Health through the National Institute of General Medical Sciences (2SC3GM081085). E.F.M.G gratefully acknowledges the scholarship granted from Conselho Nacional de Desenvolvimento Científico e Tecnológico (CNPq) and Instituto Nacional de Ciência e Tecnologia de Bioanalítica (INCTBio) – Science without borders program (Grant N° 246903/2012-0).
References
- 1.Yetisen AK, Akram MS, Lowe CR. Lab Chip. 2013;13:2210–2251. doi: 10.1039/c3lc50169h. [DOI] [PubMed] [Google Scholar]
- 2.Li X, Ballerini DR, Shen W. Biomicrofluidics. 2012;6:011301. doi: 10.1063/1.3687398. [DOI] [PMC free article] [PubMed] [Google Scholar]
- 3.Martinez AW, Phillips ST, Butte MJ, Whitesides GM. Angewandte Chemie (International ed in English) 2007;46:1318–1320. doi: 10.1002/anie.200603817. [DOI] [PMC free article] [PubMed] [Google Scholar]
- 4.Dungchai W, Chailapakul O, Henry CS. Anal Chim Acta. 2010;674:227–233. doi: 10.1016/j.aca.2010.06.019. [DOI] [PubMed] [Google Scholar]
- 5.Tomazelli Coltro WK, Cheng CM, Carrilho E, de Jesus DP. Electrophoresis. 2014 doi: 10.1002/elps.201400006. n/a-n/a. [DOI] [PubMed] [Google Scholar]
- 6.Ge L, Wang S, Song X, Ge S, Yu J. Lab Chip. 2012;12:3150–3158. doi: 10.1039/c2lc40325k. [DOI] [PubMed] [Google Scholar]
- 7.Sameenoi Y, Panymeesamer P, Supalakorn N, Koehler K, Chailapakul O, Henry CS, Volckens J. Environ Sci Technol. 2012;47:932–940. doi: 10.1021/es304662w. [DOI] [PMC free article] [PubMed] [Google Scholar]
- 8.Cate DM, Dungchai W, Cunningham JC, Volckens J, Henry CS. Lab Chip. 2013;13:2397–2404. doi: 10.1039/c3lc50072a. [DOI] [PubMed] [Google Scholar]
- 9.Taudte RV, Beavis A, Wilson-Wilde L, Roux C, Doble P, Blanes L. Lab Chip. 2013;13:4164–4172. doi: 10.1039/c3lc50609f. [DOI] [PubMed] [Google Scholar]
- 10.Martinez AW, Phillips ST, Whitesides GM, Carrilho E. Anal Chem. 2009;82:3–10. doi: 10.1021/ac9013989. [DOI] [PubMed] [Google Scholar]
- 11.Nie Z, Nijhuis CA, Gong J, Chen X, Kumachev A, Martinez AW, Narovlyansky M, Whitesides GM. Lab Chip. 2010;10:477–483. doi: 10.1039/b917150a. [DOI] [PMC free article] [PubMed] [Google Scholar]
- 12.Ellerbee AK, Phillips ST, Siegel AC, Mirica KA, Martinez AW, Striehl P, Jain N, Prentiss M, Whitesides GM. Anal Chem. 2009;81:8447–8452. doi: 10.1021/ac901307q. [DOI] [PubMed] [Google Scholar]
- 13.Delaney JL, Hogan CF, Tian J, Shen W. Anal Chem. 2011;83:1300–1306. doi: 10.1021/ac102392t. [DOI] [PubMed] [Google Scholar]
- 14.Yu J, Ge L, Huang J, Wang S, Ge S. Lab Chip. 2011;11:1286–1291. doi: 10.1039/c0lc00524j. [DOI] [PubMed] [Google Scholar]
- 15.Thom NK, Lewis GG, DiTucci MJ, Phillips ST. RSC Adv. 2013;3:6888–6895. [Google Scholar]
- 16.Nie J, Liang Y, Zhang Y, Le S, Li D, Zhang S. Analyst. 2013;138:671–676. doi: 10.1039/c2an36219h. [DOI] [PubMed] [Google Scholar]
- 17.Dungchai W, Chailapakul O, Henry CS. Analytica Chimica Acta. 2010;674:227–233. doi: 10.1016/j.aca.2010.06.019. [DOI] [PubMed] [Google Scholar]
- 18.Bhakta SA, Borba R, Taba M, Jr, Garcia CD, Carrilho E. Anal Chim Acta. doi: 10.1016/j.aca.2013.11.044. [DOI] [PMC free article] [PubMed] [Google Scholar]
- 19.Chen X, Chen J, Wang F, Xiang X, Luo M, Ji X, He Z. Biosens Bioelectron. 2012;35:363–368. doi: 10.1016/j.bios.2012.03.018. [DOI] [PubMed] [Google Scholar]
- 20.Mikkelsen SR, Corton E. ch. 3. John Wiley & Sons, Inc.; 2004. pp. 51–60. [Google Scholar]
- 21.Klasner SA, Price AK, Hoeman KW, Wilson RS, Bell KJ, Culbertson CT. Anal Bioanal Chem. 2010;397:1821–1829. doi: 10.1007/s00216-010-3718-4. [DOI] [PubMed] [Google Scholar]
- 22.Ornatska M, Sharpe E, Andreescu D, Andreescu S. Anal Chem. 2011;83:4273–4280. doi: 10.1021/ac200697y. [DOI] [PubMed] [Google Scholar]
- 23.Björkstën F. Biochim Biophys Acta. 1970;212:396–406. doi: 10.1016/0005-2744(70)90245-7. [DOI] [PubMed] [Google Scholar]
- 24.Hu J, Wang S, Wang L, Li F, Pingguan-Murphy B, Lu TJ, Xu F. Biosens Bioelectron. 2014;54:585–597. doi: 10.1016/j.bios.2013.10.075. [DOI] [PubMed] [Google Scholar]
- 25.Evans E, Gabriel EFM, Coltro WKT, Garcia CD. Analyst. 2014;139:2127–2132. doi: 10.1039/c4an00230j. [DOI] [PMC free article] [PubMed] [Google Scholar]
- 26.Lewis DM, McLlroy KA. Rev Prog Color Relat Top. 1997;27:5–17. [Google Scholar]
- 27.Roy D, Semsarilar M, Guthrie JT, Perrier S. Chem Soc Rev. 2009;38:2046–2064. doi: 10.1039/b808639g. [DOI] [PubMed] [Google Scholar]
- 28.Missoum K, Belgacem M, Bras J. Materials. 2013;6:1745–1766. doi: 10.3390/ma6051745. [DOI] [PMC free article] [PubMed] [Google Scholar]
- 29.Wegner G, Buchholz V, Ödberg L, Stemme S. Adv Mat. 1996;8:399–402. [Google Scholar]
- 30.Sirvio J, Hyvakko U, Liimatainen H, Niinimaki J, Hormi O. Carbohydr Polym. 2011;83:1293–1297. [Google Scholar]
- 31.Koga H, Kitaoka T, Isogai A. J Mat Chem. 2011;21:9356–9361. [Google Scholar]
- 32.Lafleur JP, Senkbeil S, Jensen TG, Kutter JP. Lab Chip. 2012;12:4651–4656. doi: 10.1039/c2lc40543a. [DOI] [PubMed] [Google Scholar]
- 33.Yu WW, White IM. 2011 [Google Scholar]
- 34.Dungchai W, Sameenoi Y, Chailapakul O, Volckens J, Henry CS. Analyst. 2013;138:6766–6773. doi: 10.1039/c3an01235b. [DOI] [PMC free article] [PubMed] [Google Scholar]
- 35.Lei KF, Lee KF, Yang SI. Microelectron Eng. 2012;100:1–5. [Google Scholar]
- 36.Han JW, Kim B, Li J, Meyyappan M. RSC Adv. 2014;4:549–553. [Google Scholar]
- 37.Martinez AW, Phillips ST, Carrilho E, Thomas SW, Sindi H, Whitesides GM. Anal Chem. 2008;80:3699–3707. doi: 10.1021/ac800112r. [DOI] [PMC free article] [PubMed] [Google Scholar]
- 38.Tietz NW. Clinical Guide to Laboratory Tests. 3rd. W.B. Saunders; Philadeplphia, PA: 1995. [Google Scholar]
- 39.Martinez AW, Phillips ST, Whitesides GM, Carrilho E. Analytical Chemistry. 2009;82:3–10. doi: 10.1021/ac9013989. [DOI] [PubMed] [Google Scholar]
- 40.Yetisen AK, Akram MS, Lowe CR. Lab on a Chip. 2013;13:2210–2251. doi: 10.1039/c3lc50169h. [DOI] [PubMed] [Google Scholar]
- 41.Gabriel EFM, Coltro WKT, Garcia CD. Electrophoresis. 2014 doi: 10.1002/elps.201300511. n/a-n/a. [DOI] [Google Scholar]
- 42.Md Muslim NZ, Ahmad M, Heng LY, Saad B. Sens Actuators, B. 2012;161:493–497. [Google Scholar]
- 43.Yu J, Ge L, Huang J, Wang S, Ge S. Lab on a Chip. 2011;11:1286–1291. doi: 10.1039/c0lc00524j. [DOI] [PubMed] [Google Scholar]
- 44.Nejadnik MR, Francis L, Garcia CD. Electroanalysis. 2011;23:1462–1469. doi: 10.1002/elan.201000758. [DOI] [PMC free article] [PubMed] [Google Scholar]
- 45.Mora MF, Reza Nejadnik M, Baylon-Cardiel JL, Giacomelli CE, Garcia CD. J Colloid Interface Sci. 2010;346:208–215. doi: 10.1016/j.jcis.2010.02.019. [DOI] [PMC free article] [PubMed] [Google Scholar]
- 46.Fujiwara H. Spectroscopic ellipsometry Principles and applications. J. Wiley & Sons; West Sussex, England: 2007. [Google Scholar]
- 47.Nejadnik MR, Deepak FL, Garcia CD. Electroanalysis. 2011;23:1462–1469. doi: 10.1002/elan.201000758. [DOI] [PMC free article] [PubMed] [Google Scholar]
- 48.An Y, Chen M, Xue Q, Liu W. J Colloid Interface Sci. 2007;311:507–513. doi: 10.1016/j.jcis.2007.02.084. [DOI] [PubMed] [Google Scholar]
- 49.Bai P, Luo Y, Li Y, Yu XD, Chen HY. Chin J Anal Chem. 2013;41:20–24. [Google Scholar]
- 50.Ek S, Iiskola EI, Niinistö L, Vaittinen J, Pakkanen TT, Keränen J, Auroux A. Langmuir. 2003;19:10601–10609. [Google Scholar]
- 51.Wayment JR, Harris JM. Anal Chem. 2006;78:7841–7849. doi: 10.1021/ac061392g. [DOI] [PubMed] [Google Scholar]
- 52.Aissaoui N, Bergaoui L, Landoulsi J, Lambert JF, Boujday S. Langmuir. 2011;28:656–665. doi: 10.1021/la2036778. [DOI] [PubMed] [Google Scholar]
- 53.van der Veen M, Stuart MC, Norde W. Colloids Surf B. 2007;54:136–142. doi: 10.1016/j.colsurfb.2006.08.017. [DOI] [PubMed] [Google Scholar]
- 54.Norde W. Colloids Surf B. 2008;61:1–9. doi: 10.1016/j.colsurfb.2007.09.029. [DOI] [PubMed] [Google Scholar]
- 55.Vasina EN, Paszek E, N DV, Jr, Nicolau DV. Lab Chip. 2009;9:891–900. doi: 10.1039/b813475h. [DOI] [PubMed] [Google Scholar]
- 56.Rabe M, Verdes D, Seeger S. Adv Colloid Interface Sci. 2011;162:87–106. doi: 10.1016/j.cis.2010.12.007. [DOI] [PubMed] [Google Scholar]
- 57.Vertegel AA, Siegel RW, Dordick JS. Langmuir. 2004;20:6800–6807. doi: 10.1021/la0497200. [DOI] [PubMed] [Google Scholar]
- 58.Lundqvist M, Sethson I, Jonsson BH. Langmuir. 2004;20:10639–10647. doi: 10.1021/la0484725. [DOI] [PubMed] [Google Scholar]
- 59.Hecht HJ, Schomburg D, Kalisz H, Schmid RD. Biosens Bioelectron. 1993;8:197–203. doi: 10.1016/0956-5663(93)85033-k. [DOI] [PubMed] [Google Scholar]
- 60.Wang ZH, Jin G. Colloids Surf B. 2004;34:173–177. doi: 10.1016/j.colsurfb.2003.12.012. [DOI] [PubMed] [Google Scholar]
- 61.Yamada K, Yoshii S, Kumagai S, Fujiwara I, Nishio K, Okuda M, Matsukawa N, Yamashita I. Jpn J Appl Phys. 2006;45:4259. [Google Scholar]
- 62.Jang LS, Liu HJ. Biomed Microdevices. 2009;11:331–338. doi: 10.1007/s10544-008-9239-7. [DOI] [PubMed] [Google Scholar]
- 63.Baszkim A, Norde W, editors. Physical Chemistry of Biological Interfaces. Marcel Dekker, Inc.; New York, NY: 2000. [Google Scholar]
- 64.Norde W, Giacomelli CE. J Biotechnol. 2000;79:259–268. doi: 10.1016/s0168-1656(00)00242-x. [DOI] [PubMed] [Google Scholar]
- 65.Norde W. Colloids Surf B. 2008;61:1–9. doi: 10.1016/j.colsurfb.2007.09.029. [DOI] [PubMed] [Google Scholar]
- 66.Vermeer AWP, Norde W. J Colloid Interface Sci. 2000;225:394–397. doi: 10.1006/jcis.2000.6769. [DOI] [PubMed] [Google Scholar]
- 67.Pazur JH, Kleppe K. Biochemistry. 1964;3:578–583. doi: 10.1021/bi00892a018. [DOI] [PubMed] [Google Scholar]
- 68.Kosmulski M. J Colloid Interface Sci. 1998;208:543–545. doi: 10.1006/jcis.1998.5859. [DOI] [PubMed] [Google Scholar]
- 69.Zhang H, He HX, Wang J, Mu T, Liu ZF. Appl Phys A. 1998;66:S269–S271. [Google Scholar]
- 70.Zafar Hussain I, Syed Muhammad Usman Ali S, Kimleang K, Magnus W. Sensors. 2012:12. [Google Scholar]
- 71.BÖHmer A, MÜLler A, Passarge M, Liebs P, Honeck H, MÜLler HG. Eur J Biochem. 1989;182:327–332. doi: 10.1111/j.1432-1033.1989.tb14834.x. [DOI] [PubMed] [Google Scholar]
- 72.Lin CC, Tseng CC, Chuang TK, Lee DS, Lee GB. Analyst. 2011;136:2669–2688. doi: 10.1039/c1an15029d. [DOI] [PubMed] [Google Scholar]
- 73.Hagen T, Korson MS, Wolfsdorf JI. Mol Gen Metab. 2000;70:189–195. doi: 10.1006/mgme.2000.3013. [DOI] [PubMed] [Google Scholar]
- 74.Ragginer C, Lechner A, Bernecker C, Horejsi R, Möller R, Wallner-Blazek M, Weiss S, Fazekas F, Schmidt R, Truschnig-Wilders M, Gruber HJ. Eur J Neurol. 2012;19:1146–1150. doi: 10.1111/j.1468-1331.2012.03693.x. [DOI] [PubMed] [Google Scholar]
- 75.Alnokkari A, Ataie M, Alasaf Z. Chin J Appl Environ Biol. 2013;19:1069–1072. [Google Scholar]
- 76.Chen X, Chen J, Wang F, Xiang X, Luo M, Ji X, He Z. Biosensors and Bioelectronics. 2012;35:363–368. doi: 10.1016/j.bios.2012.03.018. [DOI] [PubMed] [Google Scholar]
- 77.Wu AHB. Tietz clinical guide to laboratory tests. 4th. Saunders/Elsevier; St Louis, Mo.: 2006. [Google Scholar]
Associated Data
This section collects any data citations, data availability statements, or supplementary materials included in this article.


