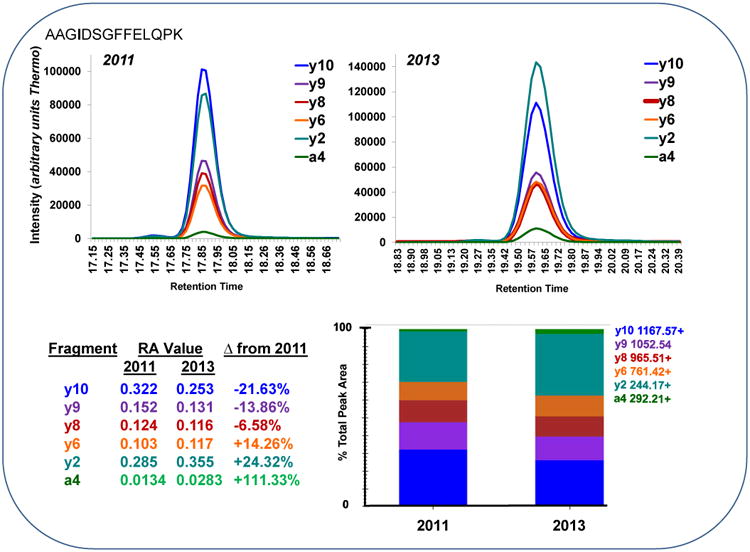
Figure 1.

An extracted ion chromatogram is shown for the peptide AAGIDSGFFELPK for six transitions (a4, y2, y6, y8, y9 and y10) from a single LC-MS/MS run from 2011 and 2013. A significant increase (α = 0.05) in relative abundance of y2 (244.1656+) and a4 (292.2093+) was observed. Meanwhile, a corresponding significant decrease (α = 0.05) in the relative abundance of y10 (1167.5681+) and y9 (1052.5411+) was also observed.
