

Abstract
Rapid advances in high-throughput sequencing facilitate variant discovery and genotyping, but linking variants into a single haplotype remains challenging. Here we demonstrate HaploSeq, an approach for assembling chromosome-scale haplotypes by exploiting the existence of ‘chromosome territories’. We use proximity ligation and sequencing to show that alleles on homologous chromosomes occupy distinct territories, and therefore this experimental protocol preferentially recovers physically linked DNA variants on a homolog. Computational analysis of such data sets allows for accurate (~99.5%) reconstruction of chromosome-spanning haplotypes for ~95% of alleles in hybrid mouse cells with 30× sequencing coverage. To resolve haplotypes for a human genome, which has a low density of variants, we coupled HaploSeq with local conditional phasing to obtain haplotypes for ~81% of alleles with ~98% accuracy from just 17× sequencing. Whereas methods based on proximity ligation were originally designed to investigate spatial organization of genomes, our results lend support for their use as a general tool for haplotyping.
Rapid progress in DNA shotgun sequencing technologies has enabled systematic identification of the genetic variants of an individual1–4. However, as the human genome consists of two homologous sets of chromosomes, understanding the true genetic makeup of an individual requires delineation of the maternal and paternal copies or haplotypes of the genetic material. Obtaining a haplotype in an individual is useful in several ways. First, haplotypes are useful clinically in predicting outcomes for donor-host matching in organ transplantation5,6 and are increasingly used as a means to detect disease associations7–9. Second, in genes that show compound heterozygosity, haplotypes provide information as to whether two deleterious variants are located on the same allele, greatly affecting the prediction of whether inheritance of these variants is harmful10–12. Third, haplotypes from groups of individuals have provided information on population structure13–15 and the evolutionary history of the human race16. Lastly, recently described widespread allelic imbalances in gene expression suggest that genetic or epigenetic differences between alleles may contribute to quantitative differences in expression17–20. An understanding of haplotype structure will therefore be critical for delineating the mechanisms of variants that contribute to allelic imbalances. Taken together, knowledge of complete haplotype structure in individuals is essential for advancing personalized medicine.
Recognizing the importance of haplotypes, several groups have sought to expand our understanding of haplotype structures at the level of both populations and individuals. Initiatives such as the International Hapmap Project13 and the 1000 Genomes Project14,15 have attempted to systematically reconstruct haplotypes through linkage disequilibrium measures based on populations of unrelated individuals. However, the average length of accurately phased haplotypes generated using this approach is limited to ~300 kb21,22. Alternatively, genotyping parent-child trios can determine whole-genome haplotypes in the child, but such methods are constrained by their higher cost and the sample availability of the two biological parents.
Numerous experimental methods have also been developed to facilitate direct haplotype phasing of an individual, including long-fragment-read sequencing23, mate-pair sequencing24, fosmid sequencing4,25–27 and dilution-based sequencing28. At best, these methods can reconstruct haplotypes ranging from several kilobases to about a megabase, but none can achieve chromosome-spanning haplotypes. Whole-chromosome haplotype phasing has been achieved by sequencing based on fluorescence-activated cell sorting29, chromosome-segregation followed by sequencing21 and chromosome microdissection–based sequencing30. However, these methods only phase a fraction of the heterozygous variants in an individual, and more importantly, they are technically challenging to perform or require specialized instruments. Recently, whole-genome haplotyping has been performed using genotyping from sperm cells31; however, this approach is not applicable to the general population and requires the deconvolution of complex meiotic recombination patterns.
Computational analysis has shown that an important factor in haplotype reconstruction from DNA shotgun sequencing methods is the length of the sequenced genomic fragment32. For example, longer haplotypes can be obtained using mate-pair sequencing (fragment or insert size, ~5 kb) compared with conventional genome sequencing (fragment or insert size ~500 bp) (Supplementary Fig. 1a). However, it is technically difficult to isolate and sequence DNA fragments that are longer than what is already obtained using fosmid clones. Hence, using existing shotgun sequencing approaches, it is difficult to generate haplotype blocks longer than 1 million bases, even at ultra-deep sequencing coverage (Supplementary Fig. 1b).
Here we describe an approach for haplotyping by combining a proximity-ligation and DNA sequencing technique33–35 with a probabilistic algorithm for haplotype assembly24. We refer to the approach as HaploSeq, for haplotyping using proximity ligation and sequencing. We have experimentally validated HaploSeq in a hybrid mouse embryonic stem cell line and a human lymphoblastoid cell line in which the complete haplotypes were known a priori. We demonstrate here that with HaploSeq, chromosome-spanning haplotype reconstruction can be achieved with ~95% of alleles linked at an accuracy of ~99.5% in mouse. In the human cell line, we coupled HaploSeq with local conditional phasing to obtain chromosome-spanning haplotypes at ~81% resolution with an accuracy of ~98% using just 17× coverage of genome sequencing. These results establish the utility of proximity ligation and sequencing for haplotyping in human populations.
RESULTS
Experimental strategy of HaploSeq
In HaploSeq, we first perform proximity-ligation sequencing using the previously established Hi-C protocol34 (Fig. 1a). In this protocol, cross-linked DNA is first digested with a restriction enzyme and then ligated to form artificial fragments. This method therefore can capture DNA fragments from two distant genomic loci that looped together in three-dimensional space in vivo33–35 (Fig. 1a). Indeed, after shotgun DNA-sequencing of the resulting DNA library, paired-end sequencing reads have ‘insert sizes’ that range from several hundred base pairs to tens of millions of base pairs (Fig. 1a). Thus, the short DNA fragments generated in a Hi-C experiment can yield small haplotype blocks, long fragments ultimately can link these small blocks together (Fig. 1b). With enough sequencing coverage, such an approach has the potential to link variants in discontinuous blocks and assemble every such block into a single haplotype.
Figure 1.
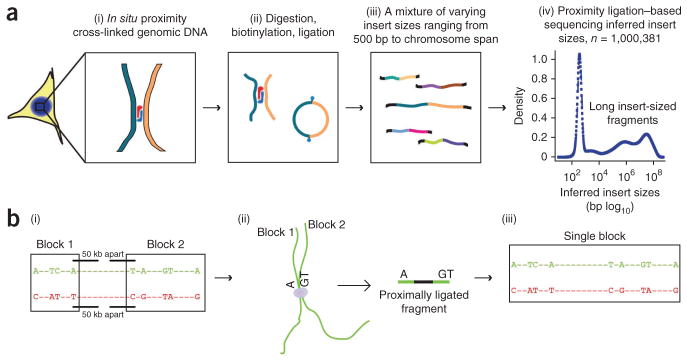
HaploSeq method for reconstructing haplotypes. (a) Proximity-ligation experiment. In brief, cross-linked chromatin are digested and ligated (i,ii). In contrast to other methods (Supplementary Fig. 1a; refs. 41,42), proximity-ligation experiments can capture distal DNA fragments that are spatially close. The ligated DNA fragments are isolated from cells and sequenced (iii). Consequently the Hi-C library contains fragments of different insert sizes (iv). Plot represents random subset of data points taken from Hi-C libraries generated by our laboratory in a lymphoblastoid cell line (GM12878). The x axis is in base pairs (log10 scale). (b) The role of proximity-ligation reads in building chromosome-spanning haplotypes. The green and red sequences represent regions of two homologous chromosomes, where “−” represents no variability and nucleotides represent heterozygous single-nucleotide polymorphisms (SNPs). Heterozygous SNPs and indels can be used to distinguish the homologous chromosomes. Local haplotype blocks (“Block 1” and “Block 2”) can be built from short-insert sequencing reads (i), similar to what occurs in conventional WGS or mate-pair sequencing. Given the distance between variants, these small haplotype blocks remain unphased in relation to each other. Distally located regions in terms of linear sequence can be brought in close proximity in situ (ii). These linkages will be preserved by proximity ligation. The large insert-size proximity-ligation sequencing reads help consolidate smaller haplotype blocks into a single chromosome-spannning haplotype (iii).
One complicating factor is that proximity ligation can capture interactions both in cis within an individual allele and in trans between homologous and nonhomologous chromosomes. Although nonhomologous trans interactions between different chromosomes do not affect phasing, interactions in trans between homologous chromosomes (referred to as h-trans hereafter) might complicate haplotype reconstruction if h-trans interactions were as frequent as cis interactions. Therefore, we set out to determine the relative frequency of h-trans versus cis interactions in proximity-ligation sequencing data. To accomplish this, we used a hybrid mouse embryonic stem (ES) cell line derived from a cross between two inbred homozygous strains (Mus musculus castaneous (CAST) and 129S4/SvJae (J129)), for which the parental inbred whole-genome sequences (WGS) were publicly available (Online Methods). As a result, the maternal and paternal haplotypes within this cell line are known a priori, and the frequency of interactions between alleles can then be explicitly tested. We performed a Hi-C experiment and generated >620 million usable 75-bp paired-end reads from these hybrid ES cells, corresponding to 30× coverage of the genome (Online Methods).
To determine the extent of intrahaplotype (cis) versus interhaplotype (h-trans) interactions, we used the prior haplotype information to distinguish reads from CAST and J129 alleles. We first visually checked the pattern of interactions between every allele, finding that the CAST and J129 alleles for each chromosome were largely self-interacting and distinct (Fig. 2a). Such a pattern has been previously observed in Hi-C studies and is analogous to the long-established concept that chromosomes occupy distinct, self-associated territories, known as “chromosome territories,” within the interphase nucleus34,35. However, previous Hi-C studies did not distinguish whether the two alleles for a given chromosome also occupy distinct, individual, chromosome territories34,35. Our results demonstrate that each allele occupies a distinct chromosome territory, with h-trans interactions occurring at a frequency of <2% of the total reads originating and ending on the two homologous chromosomes (Fig. 2b). These results indicate that the vast majority of Hi-C reads truly originated from cis interactions, which is essential for using them for haplotyping, as described below. In addition, the probability of a DNA read being in h-trans versus in cis appears to increase as a function of the insert size between the read pairs (Fig. 2c and Supplementary Fig. 2). Because of this trend, we capped the maximum insert size of Hi-C reads at 30 Mb to reduce the overall number of h-trans interactions to ~0.6% (Fig. 2d). Currently, we cannot determine if these rare h-trans interactions are due to noise in the data or to biological phenomena, such as homologous pairing of chromosomes36. Regardless, these observations indicate that h-trans interactions are rare, a prerequisite for HaploSeq analysis to succeed.
Figure 2.

Proximity-ligation products are predominantly intrahaplotype. (a) Heat map of whole-genome, long-range, chromatin contact frequencies. Hi-C reads originating from the CAST (“c”) or J129 (“j”) genome were distinguished based on the known haplotype structures of the parental strains. The frequency of interactions between each allele of each chromosome was calculated using 10-Mb bin size. The CAST or J129 allele of each chromosome primarily interacts in cis, confirming that the chromosomes territories seen in Hi-C data occur for individual alleles. Inset shows a magnified view of the CAST and J129 alleles for chromosomes 12 through 16. (b) Chart of intrahaplotype (cis) and interhaplotype (h-trans) interaction frequencies. From a priori haplotype information, we distinguish Hi-C read-pairs as interacting in cis (green) and in h-trans (purple). Plot was generated using data from chromosomes 1–19 in the CAST×J129 system. In (i), we used all intrachromosomal reads, and in (ii), we excluded all intrachromosomal reads that map with an insert size <1kb, as these are probably short contiguous DNA fragments and are therefore very likely to be in cis. Thus, the analysis described in (ii) provides a more conservative estimate of h-trans. Comparing these charts, the frequency of h-trans is at most ~2%. (c) Comparison of the h-trans interaction probability as a function of insert sizes. Plot generated using data from chromosomes 1–19 in CAST×J129 system. LOWESS fit (purple) was performed at 2% smoothing. Below 30 Mb, the probability of a read being an h-trans interaction is ≤5% (green dashed line) at any given insert size. (d) Similar to b, but excluding reads that have inserts >30 megabases. Probability of h-trans is estimated to be ~5% at 30-Mb insert size. Therefore, we use this cutoff as a maximum insert size for subsequent analyses.
Accurate chromosome-spanning haplotypes in mouse ES cells
Rare h-trans interacting reads and phenomena such as sequencing errors at the variant locations can cause erroneous connections between homologous chromosomes and complicate the reconstruction of haplotypes. To overcome these problems, we incorporated HapCUT24 software into HaploSeq analysis to probabilistically predict haplotypes. HapCUT constructs a graph in which nodes correspond to heterozygous variants and edges correspond to overlapping sequence fragments that may link the variants. This graph might contain spurious edges resulting from sequencing errors or h-trans interactions. HapCUT then uses a max-cut algorithm to predict parsimonious solutions that are maximally consistent with the haplotype information provided by the set of input sequencing reads (Fig. 3a). Because proximity ligation generates larger graphs than conventional genome sequencing or mate-pair sequencing, we modified HapCUT to balance computing time and number of iterations, so that the haplotypes can be predicted with reasonable speed and high accuracy (Online Methods and Supplementary Data).
Figure 3.

HaploSeq allows for accurate, high-resolution, and chromosome-spanning reconstruction of haplotypes. (a) Diagram of Hi-C reads (in blue and green) arising from the 129 alleles that span chromosome 18. These reads are used to link the variants into a single chromosome-spanning haplotype. The sequences of Hi-C reads are shown in black text with the variant locations in red. The sequence of the reference genome is shown in gray. A priori CAST and J129 haplotypes for each genotype at the variant locations are shown along with the predicted haplotype based on the Hi-C data. At these four bases, Hi-C reads match with the known haplotype structure. (b) Comparison of haplotype phasing methods for generating complete haplotypes by simulation. We simulated 75-bp paired-end sequencing data (chromosome 19) of conventional shotgun sequencing (mean = 400, s.d. = 100), mate pair (mean = 4,500, s.d. = 200) and fosmids (mean = 35,000, s.d. = 2,500) at 20× coverage. The first read was randomly placed in the genome, the second read was chosen based on the above-mentioned normal distribution parameters. We subsampled the CAST×J129 data to generate 20× Hi-C fragments that were used for HaploSeq analysis. The y axis represents the span of MVP block as a function of phasable span of chromosome 19. We also combined 20× sequencing coverage for each method with 20× conventional WGS data for a total of 40× coverage to compare methods at a higher coverage. (c) Analysis of the adjusted span (AS) of the haplotype phasing. The AS is defined as the product of span and fraction of heterozygous variants phased in that block. Haplotype blocks were ranked by number of heterozygous variants phased in each block (x axis is ranking) and the cumulative AS over the whole chromosome is represented on the y axis.
To test the ability of HapCUT to generate haplotype blocks from proximity-ligation and sequencing data, we again used the CAST×J129 mouse ES cell Hi-C data. In this instance, we did not distinguish a priori to which allele a sequencing read belonged. Instead, we allowed HapCUT to reconstruct de novo haplotype blocks of the heterozygous variants. We used the metrics of completeness, resolution and accuracy to assess the performance of our HaploSeq analysis in haplotype reconstruction (Supplementary Fig. 3).
The completeness metric of haplotype phasing is defined as the size in base pairs of the haplotype blocks generated. In general, HapCUT will generate several haplotype blocks of various sizes for each chromosome depending on heterozygous variant connections. To assess completeness, we analyzed the span of the haplotype blocks generated for each chromosome. We observed that each chromosome contains one block with the most heterozygous variants phased (MVP). In addition to the MVP block, a minority of heterozygous variants may be assigned to smaller blocks owing to their inability to be connected with the MVP block. The MVP block in our case spanned >99.9% of the phasable base-pairs for each chromosome (Table 1), demonstrating that HaploSeq analysis using Hi-C data can generate complete, chromosome-spanning haplotypes.
Table 1.
Accurate chromosome-spanning haplotypes in mouse ES cells
| Chromosome | Phasable span of chromosome | Variants spanned in MVP block | Percent chromosome spanned in MVP block | Percent variants phased in MVP block | Percent accuracy of phasing in MVP block |
|---|---|---|---|---|---|
| Chr1 | 194,188,030 | 1,409,566 | 100.000 | 95.231 | 99.627 |
| Chr2 | 178,746,638 | 1,109,866 | 99.997 | 93.703 | 99.569 |
| Chr3 | 156,599,306 | 1,120,125 | 100.000 | 94.911 | 99.639 |
| Chr4 | 152,628,848 | 1,030,740 | 99.997 | 94.366 | 99.546 |
| Chr5 | 149,536,169 | 1,063,616 | 99.999 | 94.414 | 99.521 |
| Chr6 | 146,516,752 | 1,074,301 | 100.000 | 96.086 | 99.674 |
| Chr7 | 149,523,520 | 965,142 | 99.999 | 94.152 | 99.427 |
| Chr8 | 128,735,517 | 939,132 | 99.948 | 95.060 | 99.558 |
| Chr9 | 121,070,077 | 832,047 | 99.987 | 94.547 | 99.600 |
| Chr10 | 126,991,341 | 980,549 | 99.996 | 95.624 | 99.735 |
| Chr11 | 118,843,488 | 861,541 | 99.996 | 94.612 | 99.577 |
| Chr12 | 118,256,511 | 794,128 | 100.000 | 94.588 | 99.515 |
| Chr13 | 117,284,037 | 858,859 | 100.000 | 95.494 | 99.679 |
| Chr14 | 122,159,750 | 823,216 | 99.998 | 94.707 | 99.541 |
| Chr15 | 100,494,041 | 719,697 | 100.000 | 94.811 | 99.618 |
| Chr16 | 95,301,285 | 711,670 | 99.898 | 95.471 | 99.668 |
| Chr17 | 92,272,062 | 616,348 | 99.999 | 93.669 | 99.443 |
| Chr18 | 87,771,251 | 674,750 | 99.989 | 95.631 | 99.599 |
| Chr19 | 58,256,454 | 411,457 | 99.869 | 95.243 | 99.662 |
Table of the results of Hi-C–based haplotype phasing in CAST×J129 system. For each chromosome, we generated complete (>99.9% of bases spanned), high-resolution (~95% of het. variants phased), and accurate haplotypes (>99.5% correctly phased het. variants).
Although completeness is defined as the base-pair span of the MVP block, resolution is defined as the fraction of phased heterozygous variants relative to the total variants spanned in the MVP block (Supplementary Fig. 3). These MVP blocks generated for each chromosome are of high resolution, as we could phase about 95% of the heterozygous variants on any given chromosome (Table 1). As 99.6% of variants are covered by at least one read, the inability to link the 5% of heterozygous variants is primarily due to the inability to link heterozygous variants to the MVP haplotype block. As a result, although the MVP block spans the majority of the chromosome, it has gaps that in total contain ~5% of the heterozygous variants.
To assess the accuracy of the heterozygous variants within the MVP block, we compared the predicted haplotypes generated de novo by HaploSeq analysis with the known haplotypes of the CAST and J129 alleles. We defined accuracy as the fraction of phased heterozygous variants that were correctly phased in the MVP block (Supplementary Fig. 3). Of the variants that were assigned to the MVP haplotype block, we observed >99.5% accuracy in distinguishing between the two known haplotypes (Table 1). Lastly, as we had previously demonstrated that the h-trans interaction probability increases with the genomic distance separating two sequencing reads (Fig. 2c), we incorporated the h-trans interaction probabilities into our HapCUT algorithm (Online Methods). These conditions did not sacrifice the completeness of the haplotypes we generated. Instead, we observed a further improvement in the accuracy of the variants in the MVP block with a modest reduction of the resolution of the variants phased (Supplementary Fig. 4a,b). In summary, these results demonstrate that HaploSeq analysis yields complete, high-resolution and accurate haplotypes for all autosomes.
Previous haplotyping efforts have often combined different shotgun sequencing methods to improve phasing. For instance, whole-genome sequencing has been combined with mate-pair sequencing24. To see if this approach would also improve haplotyping with proximity-ligation data, we simulated 20× coverage DNA sequencing data for conventional paired-end shotgun DNA sequencing (i.e., WGS), mate-pair sequencing, fosmids and proximity ligation. As expected, combining WGS with mate pair or fosmid data resulted in fragmented, incomplete haplotype blocks (Fig. 3b,c). In contrast, performing HaploSeq analysis using proximity ligation in combination with WGS data did not increase the completeness of the haplotypes generated (Fig. 3b) but did marginally improve their resolution (Fig. 3c), suggesting that adding WGS to HaploSeq analysis may be a viable strategy in cases where the resolution of haplotypes must be maximized.
Performance of HaploSeq depends on variant density
A distinct feature of the CAST×J129 ES cell line is the high density of heterozygous variants present throughout the genome. On average, there is a heterozygous variant every 150 bases, which is 7–10 times more frequent than in humans1,2 (Fig. 4a). As a first test of the feasibility of using HaploSeq to generate haplotypes in human cells, we sub-sampled heterozygous variants in the CAST×J129 data so that the variant density mimics that in human populations. We then tested how lower variant density affects the ability of HaploSeq to reconstruct haplotypes. Although lower variant density did result in fewer usable reads (Supplementary Fig. 5), we still observed complete haplotypes over each chromosome with only a marginal decrease in accuracy (from ~99.6% to ~99.2%) (Supplementary Fig. 6a). However, the MVP block generated using a variant density similar to that observed in the human genome had a lower resolution, with fewer variants phased relative to results obtained when the density of variants was higher. Approximately 32% of heterozygous variants were phased in the MVP block (Supplementary Fig. 6a), instead of 95% in the high-density case (Table 1). In summary, a low density of variants does not affect completeness or accuracy, but does substantially affect the resolution of chromosome-spanning haplotypes by HaploSeq analysis.
Figure 4.

Haplotype reconstruction in human GM12878 cells using HaploSeq. (a) The differences in variant frequency between mice (CAST×J129) and humans (GM12878) over the Hoxd13/HOXD13 gene. Also shown in the Hi-C read coverage (log10 scale) over these loci. Hi-C reads are more likely to contain variants in the high SNP density (mouse) case (shown as “SNP-covering reads”). This in turn allows these variants to be more readily connected to the MVP block. In the low variant density scenario (human), this is not the case, and as a result there are “gaps” where variants remain unphased relative to the MVP block. (b) UCSC Genome browser shot illustrating all variants (green track) and phased variants by HaploSeq (purple track) in chromosome 1. The track displays the number of heterozygous variants in each category and demonstrates that only a fraction of variants are phased (low resolution), owing to low variant density in humans. Top panel, a zoom-in of the browser, showing a binary value for presence (value 1) and absence of a variant (value 0) in that category. A value of 0 in the phased variant track represents unphased variants or “gaps,” whereas a value of 1 represents the group of variants that are part of the MVP block. (c) Hi-C–generated seed haplotypes span the centromere of metacentric chromosomes. Shown are two regions on either side of the centromere of chromosome 2. The two Hi-C generated seed haplotypes are arbitrarily designated as “A” and “B.” The actual haplotypes of the GM12878 individual learned from trio sequencing are shown below designated arbitrarily as “A” and “B.” The Hi-C–generated seed haplotypes match the actual haplotypes on both sides of the centromere. Some variants in the actual haplotype remain unphased, thus contributing to the “gaps” in the seed haplotype. In addition, the actual haplotypes based on trio sequencing may not contain all of the phased variants from reference 43. Therefore, the seed haplotype contains some phased variants not in the trio-phased haplotype (see the third variant in the AAK1 region for example).
HaploSeq analysis of a human individual
To realistically assess the ability of our method to phase haplotypes in humans, we performed HaploSeq on the GM12878 lymphoblastoid cell line. The complete haplotype of this cell line has been inferred by the 1000 Genomes Project from whole-genome sequencing data of a parent-child trio14 using WGS. We generated >262 million usable, 100-bp paired-end reads corresponding to ~17× coverage (Online Methods). HaploSeq generated chromosome-spanning haplotypes in all chromosomes of the GM12878 cells (Supplementary Fig. 6b and Fig. 4b,c). Of note, previous methods attempting haplotype reconstruction in humans have been unable to reconstruct haplotypes spanning across the highly repetitive centromeric regions of metacentric chromosomes4,23,25–28. Using HaploSeq, we generated haplotypes that accurately spanned the centromere in all metacentric chromosomes with the exception of chromosome 9, where an erroneous linkage causes switching of haplotype calls at the centromere. Chromosome 9 has both a large 15-Mbp, poorly mapped centromere region and relatively lower usable coverage (13.7×). We hypothesized that additional coverage might offer us a better chance in accurately spanning the centromere. Therefore, we combined our Hi-C data with previously generated Hi-C and tethered chromosome confirmation capture (TCC) data. TCC is a Hi-C variant using solid support ligation35 that generates similar data as a Hi-C experiment with slightly better ability to capture long-range chromatin interactions (Supplementary Fig. 7)35. Using this combined data set, we increased the coverage of chromosome 9 to ~15×, which allowed accurate phasing of the entire chromosome. In summary, we generated complete chromosome- spanning haplotypes for all human chromosomes including chromosome X, albeit at reduced resolution of ~22% (Fig. 4b and Supplementary Fig. 6b), from just 17× genome sequencing using HaploSeq analysis.
Combining HaploSeq and local conditional phasing
Although we generated chromosome-spanning haplotypes using HaploSeq, we were unable to achieve a high resolution of variants phased owing to the low variant density in a human population. We reasoned that the gaps in the MVP block containing unphased variants (Fig. 4b) could be probabilistically linked to the MVP block using linkage disequilibrium patterns derived from population-scale sequencing data. For this purpose, we used the HaploSeq-generated, chromosome-spanning haplotype as a ‘seed haplotype’ to guide the local phasing using the Beagle (v4.0)37 software and sequencing data from the 1000 Genomes Project15.
To initially assess the effectiveness of this approach, we simulated chromosome-spanning seed haplotypes in the GM12878 genome with different percentages of variants phased in the MVP block (Online Methods). Our simulation results suggest that we can accurately infer local phasing even at low-resolution seed haplotype inputs (3% error at 10% seed haplotype resolution; Fig. 5a). Owing to complex population structures, occasional mismatches occurred between phase predictions from local haplotypes predicted by Beagle and the HaploSeq-generated seed haplotype. To correct these mismatches, we filtered heterozygous variants with <100% agreement with the seed haplotype in a local neighborhood window surrounding the heterozygous variant. This filtering reduced the error rate to ~0.7% regardless of seed haplotype resolution (Fig. 5a). Consequently, the fraction of heterozygous variants for which we can infer local phasing increased with greater seed haplotype resolution (Fig. 5a). By contrast, altering the neighborhood window size did not substantially increase accuracy (Supplementary Fig. 8).
Figure 5.

HaploSeq analysis coupled with local conditional phasing permits high-resolution haplotype reconstruction in humans. (a) Local conditional phasing. The x axis is the chromosome span seed haplotypes resolution generated by simulation. The top panel shows the error rates of local conditional phasing using both an uncorrected (purple) and neighborhood corrected phasing (gold, window size = 3). Because of neighborhood correction, some variants cannot be locally inferred. The bottom panel shows the percentage of variants that remain unphased due to neighborhood correction as a function of resolution. All simulations are done using GM12878 chromosome 1. (b) Chromosome-spanning seed haplotype (MVP block) at varying parameters of read length and coverage. All simulations are done in GM12878 chromosome 1. (c) Different combinations of read length and coverage generate high-resolution seed haplotypes. Resolution metric depends on percentage of completeness. For example, for 250 bp reads at 30× coverage, resolution is 45% of the 90% variants spanned in haplotype. All simulations are done in GM12878 chromosome 1. (d) UCSC genome browser shot analogous to Figure 4b, illustrating phasing by local conditional phasing (LCP).
Encouraged by these results, we used the MVP chromosome-spanning haplotypes generated from HaploSeq analysis as seed haplotypes and performed local conditional phasing. Overall, we generated chromosome-spanning haplotypes with ~81% resolution at an average accuracy of ~98% (Table 2). Therefore, by coupling HaploSeq analysis and local conditional phasing, we achieved high-resolution and accurate chromosome-spanning haplotypes in humans.
Table 2.
High-resolution, accurate human haplotype reconstruction
| Chromosome | Percent enhanced MVP block resolution | Percent loss in resolution due to n.c. | Percent accuracy of variants phased in MVP block |
|---|---|---|---|
| Chr1 | 81.429 | 2.867 | 98.164 |
| Chr2 | 81.876 | 2.224 | 98.214 |
| Chr3 | 83.665 | 1.958 | 98.616 |
| Chr4 | 82.259 | 1.851 | 98.459 |
| Chr5 | 82.753 | 2.498 | 98.518 |
| Chr6 | 83.308 | 1.923 | 98.132 |
| Chr7 | 80.485 | 2.556 | 98.445 |
| Chr8 | 84.065 | 1.643 | 98.766 |
| Chr9 | 80.058 | 2.754 | 98.099 |
| Chr10 | 84.982 | 1.47 | 98.743 |
| Chr11 | 84.318 | 2.597 | 98.474 |
| Chr12 | 83.593 | 2.212 | 98.602 |
| Chr13 | 85.626 | 1.716 | 98.429 |
| Chr14 | 82.021 | 2.121 | 98.714 |
| Chr15 | 79.897 | 2.567 | 98.052 |
| Chr16 | 78.713 | 2.977 | 97.945 |
| Chr17 | 75.566 | 6.591 | 95.368 |
| Chr18 | 82.409 | 2.466 | 98.548 |
| Chr19 | 76.806 | 5.839 | 95.985 |
| Chr20 | 83.275 | 3.414 | 96.901 |
| Chr21 | 82.657 | 2.55 | 98.345 |
| Chr22 | 76.114 | 6.561 | 97.843 |
| ChrX | 72.419 | 5.981 | 96.489 |
The resolution of haplotype phasing using HaploSeq after local conditional phasing along with overall accuracy in GM12878 cells. With local conditional phasing, resolution increased from ~22% to ~81% on average (Supplementary Fig. 6b). The table also depicts resolution lost due to neighborhood correction (n.c.), which is, on average, ~3%. Apart from enhanced resolution, we also obtained accurate haplotypes, with an overall accuracy of ~98%.
Sequencing requirements for obtaining haplotypes by HaploSeq
From our local conditional phasing analysis, we deduced that a seed haplotype with ~20–30% resolution is sufficient to obtain accurate and high-resolution, chromosome-spanning haplotypes. A subsequent question therefore is, what are the minimal experimental requirements to achieve chromosome-spanning seed haplotypes with ~20–30% resolution? To investigate this, we simulated proximity-ligation sequencing data with varying read lengths and sequencing coverage. Based on our simulation, achieving chromosome-spanning haplotypes depends on obtaining a usable sequencing coverage of ~15× for most of the read lengths tested (Fig. 5b). However, chromosome-spanning seed haplotypes alone are not enough for achieving high-resolution haplotypes through local conditional phasing. In particular, the resulting sparse seed haplotype graph may limit the ability to generate final high-resolution haplotypes. To increase the resolution of the seed haplotype once complete seed haplotypes are obtained, one must increase coverage, either through higher sequencing depth or longer read lengths (Fig. 5c). We observed that 50- to 100-bp paired-end reads balanced completeness and resolution, and achieved the desired fraction of ~20–30% resolution at ~25–30× usable coverage. Although our simulations cannot address whether accuracy of predicted haplotypes depends on sequencing depth, we observed a relationship between haplotype accuracy and sequencing depth in the actual data. For instance, low coverage chromosomes such as 17 and 19 had a relatively lower accuracy. In particular, lower coverage might cause many variants to be linked with fewer edges, which in turn can propagate high-error structures to the entirety of chromosome-spanning haplotypes (Supplementary Fig. 9). Higher coverage can potentially increase accuracy even further, as observed in low-density CAST×J129 system. Therefore, 25–30× usable coverage with 100-bp paired-end reads is sufficient to achieve chromosome-spanning haplotypes with ~20–30% resolution and allow accurate local conditional phasing using HaploSeq analysis.
DISCUSSION
We describe a strategy to reconstruct chromosome-spanning haplo-types for an individual. Although the density of heterozygous variants contributes strongly to the resolution of the generated haplotypes, we show that this complication can be resolved by using local conditional phasing from population data15 (Fig. 5d). Compared with other haplotyping approaches that can reconstruct complete haplo-types21,29,30, our method is most suitable for a clinical and laboratory setting, where reagents and equipment required for HaploSeq are readily available. Furthermore, our method is more widely applicable than approaches based on sperm cell genotyping31, as it can generate whole-genome haplotypes from intact cells of any individual or cell line.
We anticipate that HaploSeq will be useful for personalized medicine. Determination of haplotypes in individuals has the potential to reveal novel haplotype-disease associations, some of which have already been identified on smaller scales38–40. In addition, complete haplotypes will be essential for understanding allelic biases in gene expression, which will contribute to knowledge of genetic and epigenetic polymorphisms in the population and their phenotypic consequences at a molecular level17–20. As a result, whole-genome haplotyping has applications across several fields, such as pharmacogenomics, genetic diagnostics, agricultural crop breeding and genetic engineering of animals. Lastly, although our approach currently works for diploid cells, experimental and computational improvements may allow for haplotype reconstruction in cells with higher ploidy, such as cancer cells. This may aid in our understanding of the consequences of the genetic alterations that are frequently seen during oncogenesis.
Proximity ligation was originally invented to study the spatial organization of chromosomes34. Here we show that it is also valuable for studying the genetic makeup of an individual. We demonstrate that proximity ligation–based approaches can not only tell which cis-regulatory element is physically interacting with which target gene, but also which alleles of these are linked on the same chromosome. In principle, proximity-ligation data can also be used for genotyping, along the same lines as WGS. Although variants far from restriction enzyme cut sites are less likely to be genotyped owing to biases from proximity-ligation approaches (such as Hi-C), population-based imputation22 of variants not yet genotyped can improve the performance of genotype calling. Because all this can be done using a single experiment, proximity-ligation methods such as HaploSeq have the potential to become a general tool for whole-genome analysis in the future.
ONLINE METHODS
Cell culture and experimental methods
The F1 Mus musculus castaneus × S129/SvJae mouse embryonic stem cell line (F123 line) was a gift from the laboratory of E. Heard and has been described previously44. These cells were grown in KnockOut Serum Replacement containing mouse ES cell media: DMEM 85%, 15% KnockOut Serum Replacement (Invitrogen), penicillin/streptomycin, 1× non-essential amino acids (Gibco), 1× GlutaMax, 1000 U/ml LIF (Millipore), 0.4 mM β-mercaptoethanol. F123 mouse ES cells were initially cultured on 0.1% gelatin-coated plates with mitomycin-C treated mouse embryonic fibroblasts (Millipore). Cells were passaged twice on 0.1% gelatin-coated feeder-free plates before harvesting. GM12878 cells (Coriell) were cultured in suspension in 85% RPMI media supplemental with 15% FBS and 1× penicillin/streptomycin.
Cells were harvested either in suspension (GM12878) or after trypsin treatment (F123 mouse ES cells). Formaldehyde fixation and Hi-C experiments were done as previously described34. Of note, Hi-C data sets were used in our experimental method, but in principle, other proximity ligation methods such as Tethered Chromosome Conformation Capture (TCC) could also be used. We chose Hi-C as the primary proximity ligation method used in HaploSeq because it is a simpler method than TCC. As a result, this implies that the libraries produced by Hi-C are sufficient for successful haplotyping using HaploSeq despite the somewhat greater noise in the data, an important factor in the utility of the method for future applications.
Genotyping
Variant calls and genotypes for GM12878 were downloaded from ref. 43 and these were used for haplotype reconstruction. To clarify, “GM12878” is the name of the lymphoblastoid cell line whereas “NA12878” is the identifier for the individual from whom this cell line was derived. We have chosen to use GM12878 throughout this manuscript for the sake of consistency and clarity. Phasing Information for GM12878 was downloaded from 1000 Genomes Project14. The phasing of GM12878 by the 1000 Genomes Project covers only a fraction of heterozygous variants genotyped (by ref. 43) in this individual’s genome. Among these, only ~82% of the variants have phasing information owing to heterozygosity in both parents.
For generating genotype calls for the hybrid CAST×J129 cells, we downloaded parental genome sequencing data from publicly available databases. For Mus musculus castaneus, we downloaded the genome sequence from the European Nucleotide Archive (accession number ERP000042). S129/SvJae genome sequencing data was downloaded from the Sequence Read Archive (accession number SRX037820). Reads were aligned to the mm9 genome using Novoalign (http://www.novocraft.com) and using samtools45, and we filtered out unmapped reads and PCR duplicates. The final aligned data sets were processed using the Genome Analysis Toolkit (GATK)46. Specifically, we performed indel realignment and variant recalibration. The GATK Unified Genotyper was used to make single-nucleotide polymorphism (SNP) and indel calls. We filtered out variants that did not meet the GATK quality filters or that were called as heterozygous variants, as the genome sequencing was performed in homozygous parental inbred mice. The genotype calls in the parents were used both to determine the extent of interactions in cis versus h-trans to learn the phasing of hybrid CAST×J129 cells a priori to haplotype reconstruction.
Hi-C read alignment
For Hi-C read alignment, we aligned Hi-C reads to the mm9 (mouse) or the hg18 (human) genome. In each case, we masked any bases in the genome that were genotyped as SNPs in either Mus musculus castaneus or S129/SvJae (for mouse) or GM12878 (for humans). These bases were masked to “N” in order to reduce reference bias mapping artifacts. Hi-C reads were aligned iteratively as single-end reads using Novoalign. Specifically, for iterative alignment, we first aligned the entire sequencing read to either the mouse or human genome. Unmapped reads were then trimmed by 5 bp and realigned. This process was repeated until the read successfully aligned to the genome or until the trimmed read was less than 25 bp long. Iterative alignment is useful for Hi-C data because certain reads will span a proximity-ligation junction and fail to successfully align to the genome due to gaps and mismatches. Iteratively trimming unmapped reads has the potential to allow these reads to align successfully to the genome when the trimming removes the part of the read that spans the ligation junction. After iterative alignment of reads as single ends is complete, the reads are manually paired using in-house scripts. Unmapped and PCR duplicate reads are removed. The aligned data sets are then finally subjected to GATK indel realignment and variant recalibration.
Analysis of interaction frequencies between homologous chromosomes
When we aligned the Hi-C data, a paired-end read could either have both ends mapped to the same chromosome (intra-chromosomal) or mapped to different chromosomes (inter-chromosomal). However, the initial mapping of the Hi-C data utilized a haploid reference genome and did not distinguish to which of the two homologous copies of a chromosome an individual sequencing read maps. As a result, read pairs that initially map as intrachromosomal should be broken down into reads that occur on the same homologous chromosome (which are truly in cis) and reads that map between the two homologous pairs (which we define in this manuscript as h-trans).
To determine the extent of reads that are in cis versus h-trans, we first distinguished to which allele an individual read mapped. This is done simply by identifying reads that overlap with variant locations in the genome and then determining which allele the sequenced base at the variant location corresponds to. Once this information is obtained, we can determine the frequency with which regions interact in cis versus h-trans (as shown in Fig. 2b). For Figure 2c and Supplementary Figure 2, we checked interacting variants (through reads) at any given insert size.
Usable coverage as defined by intra- and interchromosomal reads
For phasing using HapCUT, we utilize both intrachromosomal and interchromosomal reads. For interchromosomal reads, we consider each interchromosomal read pair as two single-end reads, as the paired information for such reads is not useful for phasing. In contrast, all intrachromosomal reads are considered for phasing. The probability of a single read to harbor more than one variant is small, especially in humans where the variant density is relatively low. This, in combination with the fact that only the paired intrachromosomal reads will have large insert sizes, means that the vast majority of reads that contribute to the success of haplotype phasing are the intra-chromosomal reads. Therefore, we define the “usable coverage” as the genomic coverage derived from intrachromosomal reads only.
Our Hi-C experiment generated ~22% interchromosomal reads in CAST×J129, whereas ~55% of the reads in GM12878 were interchromosomal. In other words, 620 M paired-end reads out of 795 M were useful in CAST×J129, with a usable coverage of 30×. In humans, only 262 M paired-end reads out of 577 M were useful, resulting in a usable coverage of 17×. Thus, we have a lower usable coverage in humans. In our experience, the fraction of all reads that are intrachromosomal versus interchromosomal in a Hi-C experiment may vary between experiments and across cell types.
Analysis of HaploSeq data using HapCUT
We used the HapCUT24 algorithm to perform the computational aspects of HaploSeq. This method was originally designed to work on conventional genome sequencing (WGS) or mate-pair sequencing data. HapCUT constructs a graph with the heterozygous variants as nodes and DNA fragment(s) connecting two nodes as edges. Therefore, only fragments with at least two heterozygous variants are useful for haplotype phasing. HapCUT extracts such ‘haplotype-informative’ fragments from a coordinate-sorted BAM file using a sorting method that stores each potential haplotype-informative read in a buffer until its mate is seen. We increased the buffer size to allow HapCUT handle large insert–sized proximity-ligation reads.
HapCUT uses a greedy max-cut heuristic to identify the haplotype solution for each connected component in the graph with the lowest score under the MEC scoring function. In particular, the original HapCUT algorithm used O(n) iterations to find the best cut for a component with n variants. Because Hi-C data resulted in chromosomal spanning haplotypes with a single large connected component, the default method took several days of computing time to phase the CAST×J129 genome. To reduce the computation time, we assessed the impact of reducing the number of max-cut iterations on the accuracy of phasing. For CAST×J129 system, we observed that increasing the number of max-cut iterations beyond 1,000 did not significantly improve the accuracy. For GM12878, we allowed up to 100,000 iterations. In summary, the higher the number of heterozygous variants in the largest connected component of the graph, the lower this parameter should be to make predictions within a reasonable time.
HapCUT uses the best cut for each component to update the current haplotype solution and the edge weights in the graph. This process is iterated multiple times until a combinatorial object function can no longer be improved. We used a maximum of 21 such iterations in CAST×J129 and 101 in GM12878 cells. Our parameters in GM12878 cells allowed HapCUT to obtain higher accuracy given the lower variant density and reduced sequence coverage compared to the mouse data. The modified version of HapCUT can be downloaded from https://sites.google.com/site/vibansal/software/hapcut. The source code is available as Supplementary Data.
Maximum insert size analysis
As previously mentioned the probability of a Hi-C read being in cis versus h-trans varies as a function of the distance between the two read pairs (Fig. 2c). At shorter genomic distances, the probability that an intrachromosomal read is in h-trans is very low. At large distances (>30 Mbp), this probability rises substantially and is in theory more likely to introduce erroneous connections for HapCUT to phase. To account for this, we used the Hi-C data for chromosomes 1, 5, 10, 15 and 19 in the CAST×J129 data and repeated haplotype reconstruction allowing variable maximum insert size values. We simply excluded any reads where the insert size between reads was greater than the allowable maximum insert size. We performed this analysis using the low variant density case, for this analysis because lower density was most amenable for applications in humans (Supplementary Fig. 4a,b). This step resulted in increase in accuracy of HaploSeq analysis with moderate reduction in resolution.
Insert size–dependent probability correction
A useful feature of the HapCUT algorithm is that it accounts for the base quality score at a variant location to calculate the score of a potential haplotype. In other words, if a sequencing read that links two variants and the base quality at one variant location is low, this read is given relatively lower weight by HapCUT in generating its final haplotype calls. Therefore, HapCUT can use this information to try to disregard potential sequencing errors from making erroneous haplotype connections. As we previously mentioned, in Hi-C data errors may also arise due to h-trans interactions, which are much more frequent than sequencing errors and show a distance-dependent behavior. Therefore, we attempted to account for the likelihood of an interaction being in cis versus h-trans based on the distance between the two reads. We used the CAST×J129 Hi-C data to identify reads that are in cis or h-trans. We binned the insert sizes into 50-kb bins and estimated the probability of a read being h-trans (#h-trans/ (#cis+#h-trans). We then used local regression (LOWESS) at 2% smoothing to predict h-trans probabilities at any given insert size. For every intrachromosomal read, we multiplied the cis probabilities (1 – h-trans) with the base qualities to account for the odds of this intrachromosomal read being a h-trans interaction. As a result, reads that are more likely to be h-trans are given lower weight by HapCUT in identifying the haplotype solution.
Adding h-trans interaction probabilities increases HaploSeq accuracy moderately, without having any affect on resolution. As a comparison, maximum insert size of 30 Mb had an error rate of 1.1% in chromosome 19 (Supplementary Fig. 4b). After adding h-trans probabilities, the error rate is 0.9% (Supplementary Fig. 6a), where error rate is defined as 1 – accuracy.
Local conditional phasing simulation
In order to study our ability to perform local phasing at different percentages of resolution, we performed a stepwise analysis. First, we generated seed haplotypes at different resolutions. Then, we used Beagle (v4.0)37 to perform local phasing under the guidance of the seed haplotype. Finally, we checked accuracy of local phasing by comparing it to phasing information known a priori from 1000 Genomes Project.
To simulate seed haplotypes at different resolutions, we first simulated seed genotypes. We used different combinations of read length and coverage to obtain seed genotypes of various resolutions. In particular, we used Hi-C intra-chromosomal read starting positions from H1 and H1-derived cells (unpublished data) to generate pairs of reads of a given read length and coverage. This allowed us to maintain the Hi-C data structure and the observed distribution of insert sizes in the simulated data. To generate the seed genotype, we constructed a graph with nodes representing heterozygous variants in GM12878 (chromosome 1) and edges corresponding to reads that cover multiple variants. This graph is essentially a genotype graph because we don’t know the phasing yet. Hence, the whole point of this graph is to provide a two subset of variants: one that is a part of the seed genotype and other that is not (which are the gaps to be inferred by local phasing), based on the resolution and Hi-C data structure. We generated seed genotypes at our required parameters of read length and coverage to attain a specific resolution. We used these seed genotypes for both local phasing (Fig. 5a) and to study the minimal requirements for generating seed haplotypes of enough resolution (Fig. 5b,c). These two analyses were done independently and in both cases, we repeated generating seed genotypes and downstream analysis ten times to note the average results.
To perform local conditional phasing, we need an a priori haplotype system to check accuracy of our local conditional phasing. Because a priori haplotype information from the trio covers only a fraction of heterozygous variants, we decided to perform local phasing simulation only on the trio subset. Specifically, we required every variant that was part of either seed genotype or “gaps” to be part of the 1000 Genomes-phased trio. We converted seed genotypes to seed haplotypes using the trio information while keeping “gap” variants as unphased. We then used local phasing conditioned on the seed haplotype to infer phasing of the gap variants using Beagle. We allowed homozygous variants to assist Beagle in making better predictions from the Hidden Markov Model.
To perform neighborhood correction for a seed haplotype unphased variant, we collected three variants each from both upstream and downstream, that are phased in seed haplotype. Then we checked if there was 100% correlation between the phasing present in the seed haplotype to what is predicted by Beagle. This provides an estimate of how well Beagle could have performed in this “local” region. If there is a 100% match, we consider the variant as conditionally phased. If there is not a 100% match, we disregarded the unphased variant in the final haplotype. We tried other window sizes such as 5 and 10 (Supplementary Fig. 8) and found no improvement in accuracy.
Local conditional phasing in human GM12878 cells
We coupled HaploSeq analysis and local conditional phasing to increase resolution in GM12878 cells. Local conditional phasing was performed as described earlier on genotypes that are common between GM12878 (ref. 43) and population samples. In addition, as the seed haplotype is not 100% accurate, we marked the seed haplotype phased variants that did not agree with local phasing. These marked variants were made “unphased” as these could be potential errors from HaploSeq. Hence, apart from using neighborhood correction for deciding whether a gap variant needs to be locally phased (as in the simulation), we also used this information to mark variants in the seed haplotype that could be potentially erroneous. This allowed a minor increase in accuracy after local phasing (Supplementary Fig. 9).
Overall HaploSeq accuracy was estimated as the fraction of heterozygous variants correctly phased in the MVP block after local phasing (Table 2 and Supplementary Fig. 9). In particular, we used only the variants phased in trio to estimate accuracy. For local phasing in chrX, we made the male haploid genotypes homozygous.
GM12878 cells have a lower variant density than CAST×J129 and a lower coverage added more constraints on the prediction model resulting in a relatively higher HaploSeq error rate of 2%, when compared to 0.8% in low density CAST×J129 case. A usable coverage of 25–30× (as shown in Fig. 5b,c) could help gain accuracy and potentially cover more rare variants in the seed haplotype. Currently, about 16% of the variants are not locally phased due to their absence in population. In particular, we used rsIDs to match variants, as our predictions were in hg18 whereas the 1000 genomes data were in hg19 format. These could be phased either by additional Hi-C data or even conventional genome sequencing data, which can potentially link gap variants to variants in seed MVP block. The important aspect in HaploSeq analysis is the ability to form seed chromosome-spanning haplotype, which cannot be made from conventional genome sequencing or mate-pair or fosmids.
Fosmid simulations
To simulate fosmid-based sequencing (Fig. 3b,c and Supplementary Fig. 1b), we emulated fosmid clones as paired-end sequencing, with insert sizes close to 40 kb. We reasoned that this approach is easier to simulate and yet maintains the data structure that fosmids add to haplotype reconstruction. For example, our simulation produces haplotype blocks of up to 1 Mb in humans (Supplementary Fig. 1b), a size that has been reported by other groups25–27.
Supplementary Material
Acknowledgments
We thank E. Heard for providing the CAST×J129 hybrid mouse ES cell line for this study. We thank V. Bafna for providing valuable suggestions in the course of the work. We are also grateful for the comments on this manuscript by K. Zhang. Funding for this study is provided by the Ludwig Institute for Cancer Research and the Roadmap Epigenome Project (U01 ES017166).
Footnotes
Accession codes. GEO: GSE48592.
Note: Any Supplementary Information and Source Data files are available in the online version of the paper.
AUTHOR CONTRIBUTIONS
B.R., S.S. and J.R.D. conceived the HaploSeq strategy. J.R.D. performed experiments and carried out the initial data processing. S.S. conducted haplotyping data analysis. V.B. and S.S. modified the HapCUT program for HaploSeq. S.S. and J.D. prepared the manuscript.
COMPETING FINANCIAL INTERESTS
The authors declare competing financial interests: details are available in the online version of the paper.
Reprints and permissions information is available online at http://www.nature.com/reprints/index.html.
References
- 1.Wheeler DA, et al. The complete genome of an individual by massively parallel DNA sequencing. Nature. 2008;452:872–876. doi: 10.1038/nature06884. [DOI] [PubMed] [Google Scholar]
- 2.Pushkarev D, Neff NF, Quake SR. Single-molecule sequencing of an individual human genome. Nat Biotechnol. 2009;27:847–850. doi: 10.1038/nbt.1561. [DOI] [PMC free article] [PubMed] [Google Scholar]
- 3.Kitzman JO, et al. Noninvasive whole-genome sequencing of a human fetus. Sci Transl Med. 2012;4:137ra76. doi: 10.1126/scitranslmed.3004323. [DOI] [PMC free article] [PubMed] [Google Scholar]
- 4.Levy S, et al. The diploid genome sequence of an individual human. PLoS Biol. 2007;5:e254. doi: 10.1371/journal.pbio.0050254. [DOI] [PMC free article] [PubMed] [Google Scholar]
- 5.Crawford DC, Nickerson DA. Definition and clinical importance of haplotypes. Annu Rev Med. 2005;56:303–320. doi: 10.1146/annurev.med.56.082103.104540. [DOI] [PubMed] [Google Scholar]
- 6.Petersdorf EW, Malkki M, Gooley TA, Martin PJ, Guo Z. MHC haplotype matching for unrelated hematopoietic cell transplantation. PLoS Med. 2007;4:e8. doi: 10.1371/journal.pmed.0040008. [DOI] [PMC free article] [PubMed] [Google Scholar]
- 7.NCI-NHGRI Working Group on Replication in Association Studies. et al. Replicating genotype-phenotype associations. Nature. 2007;447:655–660. doi: 10.1038/447655a. [DOI] [PubMed] [Google Scholar]
- 8.Cirulli ET, Goldstein DB. Uncovering the roles of rare variants in common disease through whole-genome sequencing. Nat Rev Genet. 2010;11:415–425. doi: 10.1038/nrg2779. [DOI] [PubMed] [Google Scholar]
- 9.Ng SB, et al. Exome sequencing identifies the cause of a mendelian disorder. Nat Genet. 2010;42:30–35. doi: 10.1038/ng.499. [DOI] [PMC free article] [PubMed] [Google Scholar]
- 10.Musone SL, et al. Multiple polymorphisms in the TNFAIP3 region are independently associated with systemic lupus erythematosus. Nat Genet. 2008;40:1062–1064. doi: 10.1038/ng.202. [DOI] [PMC free article] [PubMed] [Google Scholar]
- 11.International Consortium for Systemic Lupus Erythematosus Genetics et al. Genome-wide association scan in women with systemic lupus erythematosus identifies susceptibility variants in ITGAM, PXK, KIAA1542 and other loci. Nat Genet. 2008;40:204–210. doi: 10.1038/ng.81. [DOI] [PMC free article] [PubMed] [Google Scholar]
- 12.Zschocke J. Dominant versus recessive: molecular mechanisms in metabolic disease. J Inherit Metab Dis. 2008;31:599–618. doi: 10.1007/s10545-008-1016-5. [DOI] [PubMed] [Google Scholar]
- 13.International HapMap Consortium. et al. A second generation human haplotype map of over 3.1 million SNPs. Nature. 2007;449:851–861. doi: 10.1038/nature06258. [DOI] [PMC free article] [PubMed] [Google Scholar]
- 14.1000 Genomes Project Consortium. et al. A map of human genome variation from population-scale sequencing. Nature. 2010;467:1061–1073. doi: 10.1038/nature09534. [DOI] [PMC free article] [PubMed] [Google Scholar]
- 15.1000 Genomes Project Consortium et al. An integrated map of genetic variation from 1, 092 human genomes. Nature. 2012;491:56–65. doi: 10.1038/nature11632. [DOI] [PMC free article] [PubMed] [Google Scholar]
- 16.Meyer M, et al. A high-coverage genome sequence from an archaic Denisovan individual. Science. 2012;338:222–226. doi: 10.1126/science.1224344. [DOI] [PMC free article] [PubMed] [Google Scholar]
- 17.Gimelbrant A, Hutchinson JN, Thompson BR, Chess A. Widespread monoallelic expression on human autosomes. Science. 2007;318:1136–1140. doi: 10.1126/science.1148910. [DOI] [PubMed] [Google Scholar]
- 18.Kong A, et al. Parental origin of sequence variants associated with complex diseases. Nature. 2009;462:868–874. doi: 10.1038/nature08625. [DOI] [PMC free article] [PubMed] [Google Scholar]
- 19.Xie W, et al. Base-resolution analyses of sequence and parent-of-origin dependent DNA methylation in the mouse genome. Cell. 2012;148:816–831. doi: 10.1016/j.cell.2011.12.035. [DOI] [PMC free article] [PubMed] [Google Scholar]
- 20.McDaniell R, et al. Heritable individual-specific and allele-specific chromatin signatures in humans. Science. 2010;328:235–239. doi: 10.1126/science.1184655. [DOI] [PMC free article] [PubMed] [Google Scholar]
- 21.Fan HC, Wang J, Potanina A, Quake SR. Whole-genome molecular haplotyping of single cells. Nat Biotechnol. 2011;29:51–57. doi: 10.1038/nbt.1739. [DOI] [PMC free article] [PubMed] [Google Scholar]
- 22.Browning SR, Browning BL. Rapid and accurate haplotype phasing and missing-data inference for whole-genome association studies by use of localized haplotype clustering. Am J Hum Genet. 2007;81:1084–1097. doi: 10.1086/521987. [DOI] [PMC free article] [PubMed] [Google Scholar]
- 23.Peters BA, et al. Accurate whole-genome sequencing and haplotyping from 10 to 20 human cells. Nature. 2012;487:190–195. doi: 10.1038/nature11236. [DOI] [PMC free article] [PubMed] [Google Scholar]
- 24.Bansal V, Bafna V. HapCUT: an efficient and accurate algorithm for the haplotype assembly problem. Bioinformatics. 2008;24:i153–i159. doi: 10.1093/bioinformatics/btn298. [DOI] [PubMed] [Google Scholar]
- 25.Kitzman JO, et al. Haplotype-resolved genome sequencing of a Gujarati Indian individual. Nat Biotechnol. 2011;29:59–63. doi: 10.1038/nbt.1740. [DOI] [PMC free article] [PubMed] [Google Scholar]
- 26.Suk EK, et al. A comprehensively molecular haplotype-resolved genome of a European individual. Genome Res. 2011;21:1672–1685. doi: 10.1101/gr.125047.111. [DOI] [PMC free article] [PubMed] [Google Scholar]
- 27.Duitama J, et al. Fosmid-based whole genome haplotyping of a HapMap trio child: evaluation of Single Individual Haplotyping techniques. Nucleic Acids Res. 2012;40:2041–2053. doi: 10.1093/nar/gkr1042. [DOI] [PMC free article] [PubMed] [Google Scholar]
- 28.Kaper F, et al. Whole-genome haplotyping by dilution, amplification, and sequencing. Proc Natl Acad Sci USA. 2013;110:5552–5557. doi: 10.1073/pnas.1218696110. [DOI] [PMC free article] [PubMed] [Google Scholar]
- 29.Yang H, Chen X, Wong WH. Completely phased genome sequencing through chromosome sorting. Proc Natl Acad Sci USA. 2011;108:12–17. doi: 10.1073/pnas.1016725108. [DOI] [PMC free article] [PubMed] [Google Scholar]
- 30.Ma L, et al. Direct determination of molecular haplotypes by chromosome microdissection. Nat Methods. 2010;7:299–301. doi: 10.1038/nmeth.1443. [DOI] [PMC free article] [PubMed] [Google Scholar]
- 31.Kirkness EF, et al. Sequencing of isolated sperm cells for direct haplotyping of a human genome. Genome Res. 2013;23:826–832. doi: 10.1101/gr.144600.112. [DOI] [PMC free article] [PubMed] [Google Scholar]
- 32.Tewhey R, Bansal V, Torkamani A, Topol EJ, Schork NJ. The importance of phase information for human genomics. Nat Rev Genet. 2011;12:215–223. doi: 10.1038/nrg2950. [DOI] [PMC free article] [PubMed] [Google Scholar]
- 33.Dekker J, Rippe K, Dekker M, Kleckner N. Capturing chromosome conformation. Science. 2002;295:1306–1311. doi: 10.1126/science.1067799. [DOI] [PubMed] [Google Scholar]
- 34.Lieberman-Aiden E, et al. Comprehensive mapping of long-range interactions reveals folding principles of the human genome. Science. 2009;326:289–293. doi: 10.1126/science.1181369. [DOI] [PMC free article] [PubMed] [Google Scholar]
- 35.Kalhor R, Tjong H, Jayathilaka N, Alber F, Chen L. Genome architectures revealed by tethered chromosome conformation capture and population-based modeling. Nat Biotechnol. 2012;30:90–98. doi: 10.1038/nbt.2057. [DOI] [PMC free article] [PubMed] [Google Scholar]
- 36.Krueger C, et al. Pairing of homologous regions in the mouse genome is associated with transcription but not imprinting status. PLoS ONE. 2012;7:e38983. doi: 10.1371/journal.pone.0038983. [DOI] [PMC free article] [PubMed] [Google Scholar]
- 37.Browning BL, Browning SR. Improving the accuracy and efficiency of identity-by-descent detection in population data. Genetics. 2013;194:459–471. doi: 10.1534/genetics.113.150029. [DOI] [PMC free article] [PubMed] [Google Scholar]
- 38.He X, et al. Sherlock: detecting gene-disease associations by matching patterns of expression QTL and GWAS. Am J Hum Genet. 2013;92:667–680. doi: 10.1016/j.ajhg.2013.03.022. [DOI] [PMC free article] [PubMed] [Google Scholar]
- 39.Zeng D, Lin DY. Estimating haplotype-disease associations with pooled genotype data. Genet Epidemiol. 2005;28:70–82. doi: 10.1002/gepi.20040. [DOI] [PubMed] [Google Scholar]
- 40.Chapman JM, Cooper JD, Todd JA, Clayton DG. Detecting disease associations due to linkage disequilibrium using haplotype tags: a class of tests and the determinants of statistical power. Hum Hered. 2003;56:18–31. doi: 10.1159/000073729. [DOI] [PubMed] [Google Scholar]
- 41.Gnerre S, et al. High-quality draft assemblies of mammalian genomes from massively parallel sequence data. Proc Natl Acad Sci USA. 2011;108:1513–1518. doi: 10.1073/pnas.1017351108. [DOI] [PMC free article] [PubMed] [Google Scholar]
- 42.Kidd JM, et al. Mapping and sequencing of structural variation from eight human genomes. Nature. 2008;453:56–64. doi: 10.1038/nature06862. [DOI] [PMC free article] [PubMed] [Google Scholar]
- 43.DePristo MA, et al. A framework for variation discovery and genotyping using next-generation DNA sequencing data. Nat Genet. 2011;43:491–498. doi: 10.1038/ng.806. [DOI] [PMC free article] [PubMed] [Google Scholar]
- 44.Gribnau J, Hochedlinger K, Hata K, Li E, Jaenisch R. Asynchronous replication timing of imprinted loci is independent of DNA methylation, but consistent with differential subnuclear localization. Genes Dev. 2003;17:759–773. doi: 10.1101/gad.1059603. [DOI] [PMC free article] [PubMed] [Google Scholar]
- 45.Li H, et al. The Sequence Alignment/Map format and SAMtools. Bioinformatics. 2009;25:2078–2079. doi: 10.1093/bioinformatics/btp352. [DOI] [PMC free article] [PubMed] [Google Scholar]
- 46.McKenna A, et al. The Genome Analysis Toolkit: a MapReduce framework for analyzing next-generation DNA sequencing data. Genome Res. 2010;20:1297–1303. doi: 10.1101/gr.107524.110. [DOI] [PMC free article] [PubMed] [Google Scholar]
Associated Data
This section collects any data citations, data availability statements, or supplementary materials included in this article.