

Core promoters, generally defined as the regions that direct transcription initiation, consist of functional core promoter motifs (such as the TATA-box, initiator [Inr], and downstream core promoter element [DPE]) that confer specific properties to the core promoter. Kedmi et al. identified the Drosophila TBP (TATA-box-binding protein)-related factor 2 (TRF2) as an enriched factor that supports DPE-dependent transcription. Using microfluidic affinity analysis, they discovered that short TRF2-bound DNA oligos are enriched for Inr and DPE motifs.
Keywords: core promoter, RNA polymerase II transcription, DPE, TRF2, DNA binding
Abstract
Transcription of protein-coding genes is highly dependent on the RNA polymerase II core promoter. Core promoters, generally defined as the regions that direct transcription initiation, consist of functional core promoter motifs (such as the TATA-box, initiator [Inr], and downstream core promoter element [DPE]) that confer specific properties to the core promoter. The known basal transcription factors that support TATA-dependent transcription are insufficient for in vitro transcription of DPE-dependent promoters. In search of a transcription factor that supports DPE-dependent transcription, we used a biochemical complementation approach and identified the Drosophila TBP (TATA-box-binding protein)-related factor 2 (TRF2) as an enriched factor in the fractions that support DPE-dependent transcription. We demonstrate that the short TRF2 isoform preferentially activates DPE-dependent promoters. DNA microarray analysis reveals the enrichment of DPE promoters among short TRF2 up-regulated genes. Using primer extension analysis and reporter assays, we show the importance of the DPE in transcriptional regulation of TRF2 target genes. It was previously shown that, unlike TBP, TRF2 fails to bind DNA containing TATA-boxes. Using microfluidic affinity analysis, we discovered that short TRF2-bound DNA oligos are enriched for Inr and DPE motifs. Taken together, our findings highlight the role of short TRF2 as a preferential core promoter regulator.
Transcription of protein-coding genes is highly dependent on the RNA polymerase II (Pol II) core promoter. Core promoters, generally defined as the regions that direct transcription initiation, span from −40 to +40 relative to the +1 transcription start site (TSS). Core promoters contain functional subregions (termed core promoter elements or motifs, such as the TATA-box, TFIIB recognition elements [BREu and BREd], initiator [Inr], TCT motif, motif 10 element [MTE], and downstream core promoter element [DPE]) that confer specific properties to the core promoter (for review, see Smale 2001; Smale and Kadonaga 2003; Thomas and Chiang 2006; Deng and Roberts 2007; Heintzman and Ren 2007; Juven-Gershon et al. 2008b; Juven-Gershon and Kadonaga 2010; Kadonaga 2012; Lenhard et al. 2012). A synthetic core promoter (termed the super core promoter [SCP]) that contains a TATA, Inr, MTE, and DPE in a single promoter has been shown to yield high levels of transcription, implying that gene expression levels can be modulated via the core promoter (Juven-Gershon et al. 2006).
The set of basal transcription factors has been defined using TATA-dependent promoters (for review, see Thomas and Chiang 2006). Transcription of DPE-dependent genes, however, is fundamentally different from transcription of TATA-dependent genes. First and foremost, the set of basal transcription factors that is necessary to transcribe TATA-dependent promoters in vitro is insufficient to transcribe DPE-dependent promoters (Lewis et al. 2005; Goodrich and Tjian 2010). Moreover, enhancers with a preference for DPE-containing promoters or TATA-containing promoters have been discovered (Ohtsuki et al. 1998; Butler and Kadonaga 2001, 2002; Smale 2001). Furthermore, TBP, which is necessary for TATA-dependent transcription, down-regulates DPE-dependent transcription (Hsu et al. 2008). Additionally, NC2 and MOT1, which are positive regulators of DPE-dependent transcription, act by counteracting TBP, thus relieving its inhibition of DPE transcription (Willy et al. 2000; Hsu et al. 2008; van Werven et al. 2008).
DPE-dependent promoters can be transcribed using Drosophila high-salt nuclear extracts (Willy et al. 2000). To identify the factors that support DPE-dependent transcription, we used a biochemical complementation approach and fractionated high-salt nuclear extracts in search of proteins that would support DPE transcription. We discovered that TBP (TATA-box-binding protein)-related factor 2 (TRF2) is enriched in the fractions supporting DPE transcription. Drosophila trf2 encodes two protein isoforms that show similarity to the core domain of TBP: a 632-amino-acid protein (the “short TRF2,” which has been extensively studied) and a 1715-amino-acid protein in which the same short TRF2 sequence is preceded by a long N-terminal domain (Kopytova et al. 2006). We explored the functions of TRF2, which is the TRF with the least similarity to TBP, in transcriptional regulation and discovered that short TRF2 preferentially binds and activates DPE-containing promoters. This study highlights the role of short TRF2 as a preferential core promoter regulator and provides insights into the complexity of transcription initiation.
Results
TRF2 is enriched in protein fractions supporting DPE transcription
The known basal transcription factors are insufficient for in vitro transcription of DPE-dependent promoters (Lewis et al. 2005). Drosophila high-salt nuclear extracts have been shown to transcribe DPE-containing promoters (Willy et al. 2000). We used a biochemical complementation approach using a highly purified in vitro transcription system to which we added fractionated high-salt Drosophila embryo nuclear extracts and tested the ability of the added fraction to support transcription of a DPE-containing promoter. Using this assay, we enriched for a DPE-supporting activity through five chromatographic steps (Fig. 1A). As shown in Figure 1, B and C, transcription of a DPE-dependent promoter could be observed upon addition of glycerol gradient or Mini Q purified fractions, respectively. Mass spectroscopy analysis of active Mini Q fractions revealed the enrichment of TRF2 in the fractions supporting DPE transcription. In fact, we also observed an enrichment of TRF2 using a similar (but not identical) purification scheme (data not shown).
Figure 1.

Purification of a nuclear fraction supporting DPE transcription. (A) Scheme for the purification of a nuclear fraction supporting DPE transcription. (B) In vitro transcription of the DPE-dependent jockey core promoter using glycerol gradient fractions and the purified general transcription factors (RNA Pol II, TFIID, TFIIB, TFIIE, and TFIIF) that enable the transcription of a TATA-containing promoter but not of a DPE-containing promoter. The resulting transcripts were subjected to primer extension analysis. (C) In vitro transcription of the DPE-dependent jockey core promoter using MiniQ chromatography fractions and the purified general transcription factors, as in B.
The SCP, which contains a TATA-box, Inr, MTE, and DPE in a single core promoter, has previously been shown to be capable of engaging in high-affinity interactions with TFIID (Juven-Gershon et al. 2006; Cianfrocco et al. 2013). Independently of the biochemical complementation approach, we harnessed the SCP strategy to perform DNA affinity chromatography and searched for proteins that bind SCP DNA with a mutated TATA-box, as compared with SCP DNA containing mutations in either both the TATA-box and the DPE or both the MTE and DPE motifs. The DNA-bound protein fractions were subjected to mass spectrometry analysis. Although this analysis is not quantitative, we observed a relative enrichment of TRF2 in protein fractions that bound to SCP DNA with a mutated TATA-box, as compared with SCP DNA containing mutations in either both the TATA-box and the DPE or both the MTE and DPE motifs (Supplemental Table 1). Taken together, the biochemical complementation and the DNA affinity chromatography indicate that TRF2 is enriched in protein fractions that activate and bind DPE-containing promoter DNA.
Short TRF2 activates the natural fushi tarazu (ftz) and giant (gt) transcriptional control regions via the DPE motif and not the TATA-box
TRF2 is a TRF that has been shown to be involved in Pol II transcription (Rabenstein et al. 1999; Muller et al. 2007; Reina and Hernandez 2007; Torres-Padilla and Tora 2007; Akhtar and Veenstra 2011). The TBP residues required for TATA-box binding are not conserved in TRF2, and, indeed, TRF2 does not bind the TATA-box (Moore et al. 1999; Rabenstein et al. 1999; Teichmann et al. 1999). Moreover, Drosophila TRF2 was shown to bind polytene chromosomes at sites different from those bound by TBP, suggesting that they regulate different genes (Rabenstein et al. 1999; Isogai et al. 2007). Several studies have shown that TRF2 is important for embryonic development and differentiation (Dantonel et al. 2000; Kaltenbach et al. 2000; Veenstra et al. 2000; Martianov et al. 2001; Zhang et al. 2001; Bashirullah et al. 2007; Zhou et al. 2013). Furthermore, TRF2 was also implicated in DNA replication and proliferation (Hochheimer et al. 2002).
Interestingly, Drosophila trf2 gives rise to a single mRNA that encodes both a 632-amino-acid protein (the “short TRF2,” which has been extensively studied) and a 1715-amino-acid protein in which the same short TRF2 sequence is preceded by a long N-terminal domain containing coiled-coil motifs (Kopytova et al. 2006). It has been demonstrated previously that translation of the short TRF2 isoform is initiated at an internal in-frame AUG and is mediated by the IRES present in the coding region of trf2 mRNA (Kopytova et al. 2006). Both proteins show similarity to the C-terminal core domain of TBP. We therefore decided to characterize the effect of both short and long TRF2 on transcription of DPE-dependent promoters as compared with TATA-dependent promoters. To be able to discern the differences between expression of the short and long TRF2, we generated a long TRF2 expression plasmid in which we mutated the internal ATG (which is the first amino acid of the short TRF2 protein) from ATG (Met) to CTG (Leu, which has a structure similar to that of Met) so that it expresses only the long TRF2 isoform (henceforth, we refer to this isoform as long TRF2).
Each of the natural transcriptional control regions of ftz and gt contains a TATA-box, an Inr, and a DPE motif in their core promoters (Juven-Gershon et al. 2008a). The natural transcriptional control region of ftz contains a 1-kb genomic fragment containing the previously characterized ftz enhancer (Dearolf et al. 1989). Drosophila melanogaster Schneider S2R+ cells were cotransfected with a ftz natural enhancer and promoter containing a mutation in either the DPE (wtTATAmDPE) or the TATA-box (mTATAwtDPE) upstream of a firefly luciferase reporter gene in the presence of varying amounts of either short or long TRF2 expression plasmid (Fig. 2A). Cells were harvested 36–48 h post-transfection and assayed for dual-luciferase activity. Transfection of short TRF2 results in preferential activation of the mTATAwtDPE ftz promoter, while the activity of the wtTATAmDPE promoter is even slightly reduced upon short TRF2 transfection. Interestingly, transfection of the long TRF2 results in activation of both the mTATAwtDPE and the wtTATAmDPE ftz promoters (Fig. 2A). Similarly, short TRF2 preferentially activates the mTATAwtDPE-containing natural transcriptional control region of gt, while the activity of the wtTATAmDPE gt promoter is reduced upon short TRF2 transfection (Fig. 2B). Transfection of the long TRF2 results in activation of the mTATAwtDPE gt promoter. The wtTATAmDPE gt promoter is also activated upon long TRF2 transfection, albeit to lower levels as compared with the mTATAwtDPE gt promoter (Fig. 2B). Taken together, these results show that short TRF2 preferentially activates the ftz and gt DPE-dependent promoters, whereas the long TRF2 activates the DPE-dependent as well as the TATA-dependent ftz and gt promoters.
Figure 2.

The short TRF2 isoform, unlike the long TRF2 isoform, preferentially activates transcription of the ftz (A) and gt (B) DPE-dependent transcriptional control regions. (A) The reporter constructs contain the ftz enhancer and promoter sequences from −988 to +40 relative to the +1 start site and are identical except for mutation of the DPE or TATA, as depicted. Drosophila S2R+ cells were transfected with firefly luciferase reporter construct as well as a short TRF2 or a long TRF2 expression plasmid. Error bars represent the SEM. (B) The reporter constructs contain the gt enhancer and promoter sequences from −2031 to +40 relative to the +1 start site and are identical except for mutation of the DPE or TATA, as depicted. Drosophila S2R+ cells were transfected and assayed as in A. Error bars represent the SEM.
Depletion of endogenous TRF2 reduces DPE-dependent but not TATA-dependent transcription
Drosophila S2R+ cells express moderately high levels of TRF2 (FlyBase, http://www.flybase.org). To examine the effect of endogenous TRF2 on transcription of the ftz and gt promoters, we used RNAi to deplete TRF2. Four dsRNA probes directed against TRF2 with no predicted off-target effects were chosen (Fig. 3A). S2R+ cells were incubated with each dsRNA probe for 3 d and then transfected with a firefly luciferase reporter gene driven by either a wtTATAmDPE or a mTATAwtDPE ftz (or gt) natural enhancer and promoter. Cells were harvested 36–48 h following transfection and assayed for dual-luciferase activity (Fig. 3B,C). Successful TRF2 knockdown was verified by Western blot analysis using anti-TRF2 antibodies (kindly provided by Jim Kadonaga) (Supplemental Fig. 1).
Figure 3.

Depletion of TRF2 reduces DPE-dependent but not TATA-dependent transcription. (A) Schematic representation of the dsRNA probes used in the experiments. (B) Drosophila S2R+ cells were depleted of TRF2 by RNAi and then transfected with luciferase reporter genes driven by the ftz enhancer and promoter sequences. Error bars represent the SEM. (C) Drosophila S2R+ cells were depleted of TRF2 by RNAi and then transfected with luciferase reporter genes driven by the gt enhancer and promoter sequences. Error bars represent the SEM.
Depletion of endogenous TRF2 by each of the four dsRNA probes results in reduced transcription of the DPE-dependent ftz and gt promoters (mTATAwtDPE) (Fig. 3B,C). Transcription of the TATA-dependent ftz and gt promoters (wtTATAmDPE) is not reduced by RNAi of TRF2 (Fig. 3B,C). Each of the dsRNA probes affects transcription of the TATA-dependent gt promoters similarly. The activity of the TATA-dependent ftz promoter, however, varies in response to RNAi with different probes. Nevertheless, the effect of each of the probes on the DPE-dependent promoter is always stronger than on the TATA-dependent promoters. Hence, depletion of TRF2 from S2R+ cells specifically reduces DPE-dependent transcription.
TRF2-induced genes are enriched for Inr and DPE motifs
Short TRF2 has been shown to target several classes of TATA-less promoters (Isogai et al. 2007). To identify novel targets of the short TRF2 isoform as well as the long TRF2 isoform, we generated stable cell lines (based on S2R+ cells) with inducible expression of each isoform under the metallothionein promoter. RNA from short and long TRF2-induced cell lines as well as an uninduced short TRF2 cell line and control S2R+ cells treated with copper sulfate (to eliminate the induction of genes due to the copper sulfate treatment and not due to the induction of TRF2 by copper sulfate) was purified and subjected to microarray analysis. This analysis enabled the identification of common and differentially expressed TRF2-induced genes in these samples (see Supplemental Fig. 2 for a Venn diagram illustrating the overlap). The Venn diagram reveals that short TRF2 activates 137 unique genes (166 genes overall), whereas the long TRF2 activates 46 unique genes (65 genes overall). Eighteen genes were activated by both the short and long TRF2 isoforms (and not by uninduced short TRF2). We next wanted to examine the core promoter sequences of TRF2-induced genes for overrepresented motifs. To discover common motifs within all TRF2-induced genes, DNA sequences encompassing from −50 to +50 (relative to the +1 of the TSS) were analyzed by MEME (Bailey et al. 2009). MEME analysis performed on promoters that were activated only by long TRF2 has not identified any common motif. Remarkably, MEME analysis performed on promoters that were activated only by short TRF2 identified a highly represented 48-nucleotide (nt) motif, which starts around the TSS and continues downstream (Fig. 4A). The motif logo (identified in 65 of 176 promoter sequences examined) includes sequences that match the consensus of the Inr and the DPE with the strict spacing between the two motifs. Furthermore, sequence biases have been observed previously in putative DPE-containing genes in positions +17(T), +19(G), and +24(G) relative to the A+1 of the Inr (Kutach and Kadonaga 2000). Additionally, a G nucleotide at position +24 has been experimentally shown to contribute to DPE function (Kutach and Kadonaga 2000). As shown in Figure 4A, these three nucleotides (marked by asterisks) are overrepresented at these positions in the sequence motif identified in short TRF2-induced target genes. Hence, many short TRF2 target genes have putative Inr and DPE motifs.
Figure 4.
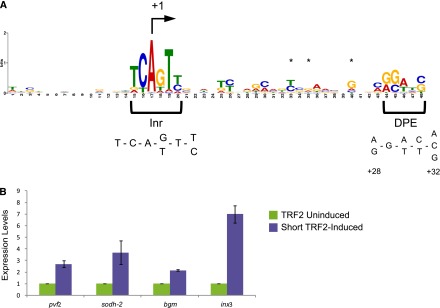
Microarray analysis of transcripts that were exclusively induced by short TRF2 reveals the enrichment of targets containing Inr and DPE motifs. (A) Overrepresentation of Inr and DPE motifs in the promoters of genes whose transcripts were exclusively induced by short TRF2, as revealed by MEME analysis (E-value 3.0 × 10⁻³⁰). No enriched motifs were identified in the promoters of genes whose transcripts were exclusively induced by long TRF2. (B) The expression levels of four endogenous short TRF2 targets whose promoters contain Inr and DPE motifs (pvf2, sodh-2, bgm, and inx3) are higher following the induction of short TRF2, as determined by real-time PCR analysis.
We repeated the microarray analysis using RNA purified from short and long TRF2-induced cell lines as well as an uninduced short TRF2 cell line and control S2R+ cells (wild type). This analysis enabled the identification of common and differentially expressed TRF2-induced genes in these samples, as depicted in the Venn diagram (see Supplemental Fig. 3 for the Venn diagram illustrating the overlap; see Supplemental Table 2 for a detailed list). Similar to the first microarray analysis, MEME analysis has not identified any common motif in the long TRF2-induced genes. Importantly, MEME analysis performed on promoters that were activated only by short TRF2 identified a highly represented motif, which starts around the TSS and continues downstream (Supplemental Fig. 4; Supplemental Table 3). The motif logo (identified in 67 of 180 promoter sequences examined) includes nucleotides that match the Inr and DPE consensus with the strict spacing between the two motifs as well as enriched +17(T), +19(G), and +24(G) positions. Taken together, two independent microarray analyses identified the Inr and DPE motifs in the core promoters of short TRF2-induced genes.
To validate these findings, we chose four genes (namely, PDGF- and VEGF-related factor 2 [pvf2], Sorbitol dehydrogenase-2 [sodh-2], bubblegum [bgm], and innexin 3 [inx3]) that contain Inr and DPE motifs in their core promoters and were identified in both microarray analyses as uniquely activated upon short TRF2 induction. To verify the induction of these genes in S2R+ cells by TRF2, we carried out a real-time PCR analysis. RNA from induced and uninduced cells was purified and reverse-transcribed into cDNA. Real-time PCR analysis was performed using primers that detect the endogenous genes. Short TRF2 induces the expression of each of these genes twofold to sevenfold, much more than the long TRF2 isoform (1.1-fold to 1.6-fold) (Fig. 4B; Supplemental Fig. 5). The fold induction observed by real-time PCR is in accordance with the fold induction observed in the microarray analyses.
To test whether the DPE motif identified in the core promoters of the short TRF2-induced genes pvf2, sodh-2, bgm, and inx3 is functional, we cloned their wild-type as well as mDPE-containing promoters (−10 to +40 relative to the A+1 of the Inr) upstream of the firefly luciferase gene. First, we examined the activity of the promoters by in vitro transcription with Drosophila embryo nuclear extracts followed by primer extension analysis. The promoters of all four genes were highly dependent on the DPE motif, as mutation of the DPE significantly reduced the activity of the promoters (Fig. 5A). We next tested whether TRF2 activates the transcription of these promoters via the DPE in transfected S2R+ cells. Cells were cotransfected, and the transcriptional activity of wild-type and mDPE reporter genes in the presence or absence of transfected TRF2 expression plasmid was assayed using dual-luciferase assays. The basal activity (in the absence of transfected TRF2) of pvf2, sodh-2, bgm, and inx3 is reduced upon mutation of the DPE (Fig. 5B). Transfected TRF2 moderately activates transcription of the wild-type promoters of pvf2, sodh-2, bgm, and inx3, while it does not activate the mDPE version of their promoters at all. Notably, the promoter constructs that are activated by transfected TRF2 encompass only the minimal core promoter sequence (from −10 to +40), suggesting that TRF2, like its relative, TBP, acts at the level of the core promoter. Taken together, TRF2 is able to activate multiple promoters containing a functional DPE motif.
Figure 5.

The core promoters of pvf2, sodh-2, bgm, and inx3 are activated by short TRF2 and are DPE-dependent. (A) The wild-type (wt) and mDPE versions of the indicated core promoters (from −10 to +40 relative to the A+1 start site) were subjected to in vitro transcription analysis with Drosophila embryo nuclear extracts. The resulting transcripts were detected by primer extension reverse transcription analysis. For the inx3 wild-type and mDPE-containing core promoters, a longer exposure length of the primer extension gel to film was used, as transcription from these promoters is significantly weaker compared with transcription of the other TRF2 targets tested. (B) Drosophila S2R+ cells were transfected with firefly luciferase reporter constructs driven by either a wild-type or mDPE promoter of the pvf2, sodh-2, bgm, and inx3 promoters as well as a short TRF2 expression plasmid, as indicated. The graph represents the average of three to 10 experiments for each promoter. Error bars represent the SEM.
Enrichment of initiator and DPE elements in DNA bound by TRF2-containing complexes in vitro
In order to test whether TRF2 binds to specific DNA elements, we used a microfluidic system of mechanically induced trapping of molecular interactions (MITOMI), which allows high-throughput sequence characterization of DNA–protein interactions (Fordyce et al. 2010; Glick et al. 2012). In vitro binding of S2R+ cellular extracts overexpressing induced Flag-HA-tagged TRF2 isoforms was analyzed using anti-Flag antibodies to pull down TRF2-containing complexes. We examined the enrichment of initiator and functional DPE elements in the in vitro bound DNA oligonucleotides. For each in vitro DNA-binding experiment of a TRF2 isoform, we ranked all 6-mers by their median binding intensities. We used the Wilcoxon rank-sum test to measure the enrichment of two different sets of elements: initiator and in vivo validated DPE elements (collected from different studies). Remarkably, the initiator was enriched in DNA oligonucleotides bound by both the short and long TRF2-containing complexes, whereas the in vivo validated DPE elements were significantly enriched in only the DNA bound by the short TRF2-induced extracts (Fig. 6). This is in accordance with our microarray results, in which short TRF2-induced genes were enriched for both Inr and DPE motifs (Fig. 4A; Supplemental Fig. 4), whereas no common motif has been identified in the long TRF2-induced genes. Similar conclusions were derived when testing enrichment in the ranked 6-mers using the Kolmogorov-Smirnov statistical test and when testing enrichment in a ranked list of all oligonucleotides (Supplemental Fig. 6; Supplemental Table 4).
Figure 6.

Enrichment of initiator and in vivo validated DPE elements among in vitro TRF2-bound 6-mers using Wilcoxon signed-rank test. The position-specific weight matrix logos above the graphs represent the enriched elements. Values above the red dashed line are significant (P-value < 0.05).
Calculation of protein–DNA interaction affinities
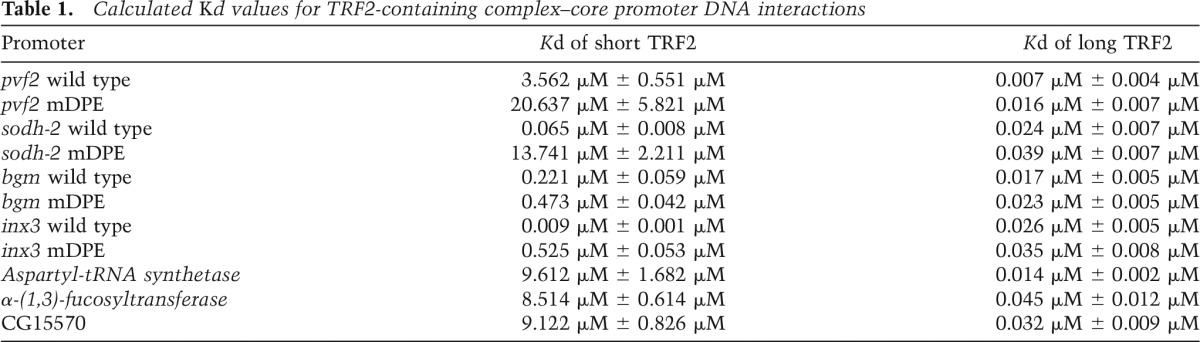
In order to quantify the interaction of TRF2 with the wild-type and mDPE promoters of short TRF2 target genes and calculate the Kd of the protein–DNA interactions, we generated a minilibrary of Cy5-labeled dsDNA promoters (−10 to +40), including the four short TRF2 targets that were analyzed by luciferase assays and primer extension analysis as well as three other promoters containing different core promoter elements. Using microfluidics and Flag-immobilized TRF2, we determined the Kd of protein–DNA interactions using either short or long TRF2-containing complexes. Remarkably, short TRF2 preferentially binds to the wild-type pvf2, sodh-2, bgm, and inx3 (Table 1; Supplemental Fig. 7). Short TRF2-containing complexes bind with significantly lower affinity to the mDPE-containing DNA as well as to the non-DPE-containing controls: Aspartyl-tRNA synthetase (−40 to +10, a promoter that contains only a TATA-box) or α-(1,3)-fucosyltransferase B (−10 to +40) or CG15570 (−10 to +40), neither of which contains known core promoter elements. The long TRF2-containing complexes bind promoter DNA with much higher affinity as compared with the short TRF2, albeit with no dependence on the core promoter composition; i.e., long TRF2-containing complexes display high affinity for wild-type and mDPE promoters and promoters that contain neither an Inr nor a DPE motif (Table 1; Supplemental Fig. 8). Taken together, short TRF2-containing complexes preferentially bind Inr- and DPE-containing promoters, whereas the long TRF2-containing complexes possess nonspecific DNA binding.
Table 1.
Calculated Kd values for TRF2-containing complex–core promoter DNA interactions
Discussion
The conserved short TRF2 isoform, unlike the long TRF2 isoform, activates transcription with a preference for DPE-dependent promoters
In this study, we demonstrated that the conserved short TRF2 protein preferentially activates DPE-dependent promoters. Using biochemical complementation, we discovered that TRF2 is enriched in Drosophila embryo protein fractions that activate transcription from a DPE-dependent core promoter. Furthermore, we used DNA affinity chromatography and demonstrated that TRF2 is enriched in protein fractions that bind DPE-containing promoter DNA. By luciferase reporter assays in transiently transfected Drosophila S2R+ cells, we show that short TRF2, as opposed to the long TRF2, preferentially activates the DPE-dependent ftz and gt reporters. We performed microarray analysis in search of novel TRF2 targets and discovered the enrichment of Inr- and DPE-containing promoters among short TRF2 up-regulated genes. MEME analysis has not identified overrepresented motifs in the long TRF2 up-regulated genes. RNAi followed by microarray analysis has revealed the enrichment of the DPE motif in TRF2 down-regulated genes (data not shown). Notably, the microarray analyses identified both direct and indirect TRF2 targets. In the future, it will be interesting to test specific targets and distinguish between direct and indirect TRF2 targets.
The human TRF2 protein is 186 amino acids long, of which amino acids 7–186 constitute the TBP core domain (Rabenstein et al. 1999). The short Drosophila TRF2 isoform, which constitutes the C terminus of the long Drosophila TRF2 isoform, is homologous to TBP and the human TRF2 as well as TRF2 from other species. The short TRF2 protein isoform is 632 amino acids long and has a theoretical pI of 8.0, whereas the long TRF2 isoform, which may be unique to Drosophila, is 1715 amino acids long and has a theoretical pI of 4.65. The long TRF2 isoform contains an aspartic-rich domain, a serine-rich domain, and a glutamine-rich helical domain that is typical to certain histone deacetylases. The functions of the long TRF2 (and whether these sequence domains contribute to its activity) remain to be discovered.
Short TRF2-containing complexes bind DPE-dependent promoters with higher affinity than promoters with mutated DPE
Although the core domain of Drosophila TRF2 is 39% identical to the core domain of Drosophila TBP, the TBP residues required for TATA-box binding are not conserved, and, indeed, the short TRF2 does not bind TATA-containing promoters (Moore et al. 1999; Rabenstein et al. 1999; Teichmann et al. 1999). A long-standing question has been: What are the DNA elements that TRF2 binds? Using microfluidics, we now identify protein–DNA interactions of TRF2-containing complexes. Furthermore, we calculated the affinities of interactions between TRF2-containing complexes and DNA in vitro. Mutation in the DPE of the four short TRF2 target promoters that were tested significantly reduces DNA binding. Interestingly, the long TRF2-containing complexes bind promoter DNA with high affinity, albeit without any preference for a wild-type promoter as compared with a mDPE-containing promoter DNA. Importantly, TRF2 has recently been demonstrated to mediate the transcription of ribosomal protein genes via the TCT motif and not the TATA-box (Wang et al. 2014). ChIP-seq (chromatin immunoprecipitation [ChIP] combined with deep sequencing) analysis of Drosophila embryos using anti-TRF2 antibodies indicate a peak of TRF2 occupancy in the vicinity of the TSS. We analyzed this ChIP-seq data set and discovered that, remarkably, the most enriched motif in the top TRF2-bound genes (quantile 0.9) is the DPE motif (Supplemental Fig. 9). MEME analysis of the least TRF2-bound genes (quantile 0.1) has not identified any enriched motifs. This suggests that DPE-containing promoters are direct targets of TRF2. Taken together, we discovered that TRF2 is a unique core promoter factor that is involved in DNA binding of DPE-containing promoters. Using microfluidics, we demonstrated sequence-specific DNA-binding of TRF2-containing complexes. Whether TRF2 binds DNA directly remains to be determined. It is likely that there are TRF2-associated factors that assist TRF2 in core promoter DNA binding in a manner similar to that of TBP-associated factors that, together with TBP, constitute the TFIID complex.
TRF2 is a basal transcription factor that is functionally important for DPE-dependent promoters
Transcriptional regulation is achieved by diversity in enhancers, core promoter composition, and the basal transcription machinery. An example for such diversity is the existence of a TRF family, which includes TRF1, TRF2, and TRF3. In this study, we discovered a connection between core promoter composition and the basal transcription factor TRF2. Remarkably, we observed a significant reduction of protein–DNA interaction when the DPE motif was mutated. It is of great interest that not only do the core promoters of many (although not all) short TRF2 target genes lack a TATA-box, they share Inr and DPE motifs. Moreover, we noted that nucleotides at specific positions located between the Inr and DPE, such as +17, +19, and +24 relative to the A+1, are overrepresented in the Inr- and DPE-containing short TRF2 targets. These positions were previously recognized as overrepresented in DPE-containing genes (Kutach and Kadonaga 2000). We further demonstrated that the core promoters of four short TRF2 target genes are functionally DPE-dependent and are activated by short TRF2. In a sense, TRF2 is acting in a manner antagonistic to TBP, which has been shown to down-regulate DPE transcription (Hsu et al. 2008).
We discovered that TRF2 mediates transcription of DPE-containing promoters. TRF2 has been shown recently to mediate the transcription of ribosomal protein genes via the TCT motif (Wang et al. 2014). Furthermore, TRF2 has been shown previously to play an important role in RNA Pol II transcription and has been shown to activate the TATA-less histone H1 promoter (Isogai et al. 2007). Hence, it is likely that TRF2 is important for multiple transcription systems that mediate important biological processes and pathways. Importantly, these findings support the notion that the basal transcription factors are not necessarily general transcription factors. Rather, they are active components that act in conjunction with the core promoters in the complex regulation of gene expression.
Materials and methods
In vitro transcription using a highly purified recombinant transcription system
In vitro transcription reactions of 250 ng of a supercoiled DPE-containing promoter (jockey) DNA template were carried out as previously described (Wampler et al. 1990). The purified general transcription factors that enable the transcription of a TATA-containing promoter, but not of a DPE-containing promoter (RNA Pol II, TFIID, TFIIB, TFIIE and TFIIF), were supplemented with fractionated Drosophila high-salt nuclear extracts, and transcription was analyzed. It is of note that no TFIIH was needed for the in vitro transcription of supercoiled DNA templates, as previously reported (Goodrich and Tjian 1994). The resulting transcripts were subjected to primer extension analysis with an M13 reverse-sequencing primer (AGCGGATAACAATTTCACACAGGA). RNA Pol II was purified from 0- to 12-h-old Drosophila embryos using DE-52, phosphocellulose, and Source15Q resins in a procedure similar to that of Hodo and Blatti (1977). TFIID was purified from Drosophila embryo high-salt nuclear extracts by Poros Heparin, Sephacryl S-300, and Source15Q resins in a procedure similar to that of Austin and Biggin (1996). Drosophila TFIIB, human TFIIF74 (RAP74/TFIIFα), human TFIIF30 (RAP30/TFIIFβ), and human TFIIE were synthesized in Escherichia coli and purified as previously described (Santoso and Kadonaga 2006).
In vitro transcription assays using Drosophila embryo nuclear extracts
Double-stranded oligonucleotides comprising core promoter sequences from −10 to +40 of the tested core promoters were inserted into the KpnI and EcoRI sites of a pGL3Basic vector with a modified multiple cloning site. Mutation of the DPE in the core promoters was identical to that used previously (Lim et al. 2004), where the mutant DPE contains CATA at +30 to +33 relative to A+1.
In vitro transcription reactions with Drosophila embryo nuclear extracts were carried out as previously described (Wampler et al. 1990) using 250 ng of supercoiled DNA templates with Drosophila high-salt nuclear extracts (Soeller et al. 1988). The resulting transcripts were subjected to primer extension analysis with a reverse luciferase primer (TCTTCCAGCGGATAGAATGGCGCC). Quantitation of reverse transcription products was carried out using ImageQuant and GelQuantNET. All experiments were carried out a minimum of three independent times to ensure reproducibility of the data.
Protein purification
Drosophila high-salt nuclear extracts were prepared from embryos that were collected from 0 to 12 h after egg deposition following the method of Soeller et al. (1988). Protein fractions supporting transcription of a DPE-dependent promoter were purified by following the scheme shown in Figure 1A. Column chromatography was carried out with an ÄKTA fast protein liquid chromatography (FPLC) system (GE Healthcare). The detailed methodology for the purification is available on request.
Mass spectrometry analysis
Sample preparation and multidimensional protein identification technology (MudPIT) analysis of protein complexes was performed as previously described (Washburn et al. 2001). Tandem mass spectrometry spectra were searched with the SEQUEST algorithm (Eng et al. 1994). Interestingly, all of the TRF2 peptides identified by mass spectrometry analysis are common to both the short and long isoforms. Hence, sequence coverage in Supplemental Figure 1 is shown for the short TRF2 isoform.
TRF2 expression vectors
Short TRF2 was cloned by PCR using EST clone LD27895. Long TRF2 was cloned from Drosophila embryo cDNA. Both TRF2 protein isoforms are encoded by the same mRNA (Kopytova et al. 2006). The short protein form has been reported to result from an internal translation initiation (Kopytova et al. 2006). To be able to discern the differences between expression of the long and the short isoforms, we generated a long TRF2 expression plasmid in which we mutated the internal ATG that is the first amino acid of the short TRF2 protein from ATG (Met) to CTG (Leu, which has a structure similar to that of Met) so that it expresses only the long TRF2 isoform. The mutation was generated using the QuikChange II site-directed mutagenesis kit (Stratagene). Both forms were expressed with an N-terminal Flag-HA tag using the pAc5.1 or pMT expression vectors (Life Technologies). All plasmid sequences were verified by sequencing.
Transient transfection and reporter gene assays
D. melanogaster Schneider S2R+ adherent cells were cultured in Schneider’s Drosophila medium (Biological Industries) that was supplemented with 10% heat-inactivated FBS. Cells were transfected in 24-well plates by using the Escort IV reagent (Sigma). For dual-luciferase assays, cells were plated at 0.6 × 10⁶ cells per well of a 24-well plate 1 day prior to transfection. Cells were transfected with the indicated amounts of a TRF2 expression vector that was supplemented, where necessary, with pAc control expression vector to give a total of 1 µg of DNA of expression vector. In addition, 60 ng of the firefly luciferase reporter constructs was cotransfected with 1 ng of the Actin5c-Renilla luciferase reporter. The medium was replaced the next morning, and cells were harvested 36–48 h post-transfection and assayed for dual-luciferase activities, as specified by the manufacturer (Promega). To correct for transfection efficiency, the firefly luciferase activity of each sample was normalized to the corresponding Renilla luciferase activity. Each transfection was performed in triplicate. The graphs represent an average of three to six independent experiments.
Generation of dsRNA probes
Four dsRNA probes directed against TRF2 were chosen based on http://www.dkfz.de/signaling/e-rnai3. Probe 1 was generated using the following primers: forward, 5′-ATAGGTACCGGCAACCGGCAGTAAAAATA-3′; and reverse, 5′-ATAACTAGTACTCCACATTTGATCCCTGC-3′. Probe 2 was generated using the following primers: forward, 5′-ATACTCGAGAACAGAAGGAGCAGCATCGT-3′; and reverse, 5′-ATAACTAGTTATTTTTACTGCCGGTTGCC-3′. Probe 3 was generated using the following primers: forward, 5′-ATAGGTACCAAGGAGAACCAATCGCCGAAT-3′; and reverse, 5′-ATAACTAGTATTAGAAGAACTTAAGCGATC-3′. Probe 4 was generated using the following primers: forward, 5′-ATACTCGAGCAATCTGACTTGAATCCCGG-3′; and reverse, 5′-ATAACTAGTTCATCTGAAGCTTGTCGCG-3′. DNA fragments corresponding to each dsRNA were subcloned into pBlueScript SK+. The dsRNA probes were generated by PCR amplification of the DNA using T7 and T3 primers followed by in vitro transcription using T7/T3 RNA polymerase (Megascript kit, Ambion). The resulting RNA products were annealed to generate the dsRNA probes.
RNAi-coupled reporter assays
For RNAi-coupled reporter assays, cells were treated with dsRNA for 3 d and then transfected with 60 ng of the firefly luciferase reporter and 1 ng of the Actin5c-Renilla control plasmid using the Escort IV reagent (Sigma). The medium was replaced the next morning, and cells were harvested 36–48 h post-transfection and assayed for dual-luciferase activities, as specified by the manufacturer (Promega). The protein concentration of cell lysates was measured using the BCA reagent (Pierce). To correct for transfection efficiency, the firefly luciferase activity of each sample was normalized to the corresponding Renilla luciferase activity and to the amount of total protein. Each transfection was performed in triplicate. The graphs represent an average of three to four independent experiments.
Generation of stable cell lines
Drosophila S2R+ cells were cotransfected with the pCoHygro plasmid (Life Technologies), and an expression vector of either the short or long TRF2 isoform was tagged with Flag and HA epitopes and driven by the metallothionein gene promoter that is inducible upon addition of copper sulfate to the cells. Cells were selected for several weeks in culture in the presence of 300 μg/mL hygromycin. The induction of TRF2 was verified by Western blot using anti-HA antibodies.
Microarray analysis
RNA from short and long TRF2-induced cell lines as well as an uninduced short TRF2 cell line and control S2R+ cells was purified using the PerfectPure kit (5 PRIME). Two-hundred nanograms of total RNA of each sample, in the presence of control RNAs (RNA spike-in kit, Agilent), was labeled with either Cy-3 or Cy-5 using the low-input quick amp labeling kit, two-color (Agilent) following the manufacturer’s protocol. In each microarray experiment, every sample was tested in duplicate. Equal amounts of labeled RNA were hybridized overnight to Agilent’s Drosophila microarray 4x44,000 at 60°C. Hybridization mixes were prepared using the gene expression hybridization kit from Agilent following the manufacturer’s protocol. Following hybridization, the slide was first washed with gene expression wash buffer 1 (Agilent) and then with gene expression wash buffer 2 (Agilent). This was followed by an acetonitrile wash, and, finally, the slides were placed in stabilization and drying solution (Agilent). The washed slides were scanned on an Agilent G2565BA microarray scanner.
The data from all arrays were first subjected to background correction and LOESS within-array normalization using Agilent Feature Extraction software (version 9.5.1.1, Agilent Technologies). The remaining analyses were performed in Partek Genomics Suite software (version 6.6, Partek, Inc.). The log expression ratios produced during the normalization step were analyzed. Data from two biological replicates were used to perform a one-way ANOVA. The normalized data were analyzed to identify genes with significantly up-regulated or down-regulated expression (false discovery rate [FDR], P-value < 0.05 with a cutoff of at least a 1.8-fold change for the first microarray, and FDR P-value < 0.05 with a cutoff of at least a twofold change for the second microarray). Using the FlyBase converter tool (http://www.flybase.org), we identified all of the transcripts that contain an induced microarray probe and initiate at different chromosomal positions. The promoters of these transcripts were analyzed by the MEME motif-finding algorithm (Bailey et al. 2009) to identify de novo motifs.
Reverse transcription and real-time PCR analysis
Total RNA from uninduced and induced Drosophila cell lines was purified using the PerfectPure RNA cultured cell kit (5 PRIME). One microgram of the total RNA was reverse-transcribed into cDNA using MMLV-RT (Promega). Quantitation was performed by real-time PCR (StepOnePlus, Life Technologies). The expression levels were compared with those of gapdh2. Primer sequences for real-time PCR are provided in Supplemental Table 5.
Microfluidic device fabrication
The two-layer device was designed in AutoCAD 2011 (Autodesk, Inc.), and each layer was reproduced as a chrome mask at 40,000 dpi (Fineline-Imaging). Flow and control molds were fabricated on 4-in silicon wafers using positive (SPR 220-7.0) and negative (SU-8) photoresists, respectively. The microfluidic devices were fabricated on silicone molds as described previously (Maerkl and Quake 2007; Fordyce et al. 2010; Glick et al. 2012). Briefly, each device consisted of two aligned PDMS layers: the flow and the control layer. PDMS (60 g) at a ratio of 5:1 was cast on the control mold and degassed. Inlet holes were then punched. PDMS (21 g) at a ratio of 20:1 was spin-coated on the flow mold. Both molds were semicured for 30 min at 80°C. PDMS was demolded, and inlets were punched for the control layer. Control and flow layers were then assembled and cured for 2 h at 80°C (Glick et al. 2012).
Design and preparation of the 8-mer DNA library
All possible 65,536 8-base-pair (bp) DNA sequences were assembled into a maximally compact de Bruijn sequence that was subsequently divided over 1457 oligonucleotides. Each 70-bp-long oligonucleotide contained 45 overlapping 8-mers, a 3-bp GC clamp at the 5′ end, and an identical 14-bp sequence at the 3′ end for Cy5 labeling and primer extension (Fordyce et al. 2010). Sequences were hybridized to a Cy5-labeled oligonucleotide and extended using a Klenow fragment (exo−) (New England Biolabs) to produce Cy5-labeled dsDNA (Fordyce et al. 2010). Cy5-labeled dsDNA was diluted to a final concentration of 1.25 μM. Each sample solution contained 0.125% of poly(ethylene glycol) (Aldrich) and D-trehalose dehydrate (Sigma) at 12.5 mg/mL in dH2O to prevent irreversible binding of the DNA to the glass as well as for visualization during alignment of the device to the DNA array. The oligos were spotted onto epoxy-coated glass substrates (CEL Associates) with a MicroGrid 610 (Bio Robotics) microarrayer using SMT-S75 silicone pins (Parallel Synthesis). Column and row pitch corresponded to the specific device. The device that we used contained 65 columns and 64 rows with a pitch of 281.25 µm by 562.5 µm, respectively. Finally, the arrays were aligned to the microfluidic device by hand under a stereoscope and bonded overnight on a heated plate at 80°C.
Binding of the TRF2-containing complex to the wild-type and mutant DPE minilibrary
Oligonucleotides encompassing promoters’ sequences were synthesized (IDT), hybridized to a Cy5-labeled oligonucleotide, and extended using a Klenow fragment (exo−) (New England Biolabs) to produce Cy5-labeled dsDNA (Fordyce et al. 2010). Cy5-labeled dsDNA was diluted to a final concentration of 2 μM. Next, seven twofold serial dilutions down to 0.0156 μM were prepared. Each sample solution contained 0.125% of poly(ethylene glycol) (Aldrich) and D-trehalose dihydrate (Sigma) at 12.5 mg/mL in dH2O. A control sample with no DNA was included. All samples were spotted on epoxy slides, and arrays were aligned to the microfluidic device as previously described. Promoter sequences used were −10 to +40 of the Inr and DPE-containing pvf2, sodh-2, bgm, and inx3 promoters; −10 to +40 of the promoters containing no known core promoter element α-(1,3)-fucosyltransferase B and CG15570; and −40 to +10 of the TATA-containing promoter Aspartyl-tRNA synthetase (see the Supplemental Material for promoter sequences).
Surface chemistry
To derivatize the slide surface, 1 µg/µL biotinylated-BSA (Thermo) was flown for 30 min through the device to allow binding of the BSA to the epoxy surface. On top of the biotinylated-BSA, 0.5 µg/µL Neutravidin (Pierce) was added for 30 min. The “button” valve was then closed, and 1 µg/µL biotinylated-PEG (Nanocs) was flown over for 30 min, passivating the rest of the device. Following passivation, the “button” valve was released, and a flow of 0.2 µg/µL anti-Flag biotinylated antibodies (Cell Signaling) was applied. The antibody bound specifically to the exposed Avidin surface under the “button,” creating an anti-Flag tag array. Hepes (50 mM; Biological Industries) was used for washing unreacted substrates between each of the different surface chemistry steps. Next, cell extracts from 1.5 × 10⁶ to 1.6 × 10⁶ cells overexpressing Flag-HA-TRF2 isoforms were loaded onto the device. TRF2-containing protein complexes were immobilized under the “button.” DNA chambers were flooded with buffer that solubilized the spotted DNA, allowing protein–DNA interactions. DNA that interacted with loaded proteins was captured beneath the button valve following a 1-h incubation period. Proteins were labeled with anti-HA Alexa Fluor 488 antibodies (Cell Signaling), which bound the corresponding epitope on the respective TRF2 isoform. Protein expression levels and interacting DNA signals were measured with a microarray scanner (LS Reloaded, Tecan) using a 532-nm laser and a 575-nm filter or a 633-nm laser and a 695-nm filter.
Printed DNA concentration
To determine the actual on-chip printed DNA concentration, Cy5-labeled oligos with known concentrations (0.039–5 μM) were introduced into the device. Cy5 intensity was measured with a microarray scanner (LS Reloaded, Tecan) using a 633-nm laser and a 695-nm filter, and a calibration curve was plotted. The concentration of DNA in each chamber was then calculated according to this standard curve.
Image and data analysis
Scanner images were analyzed using GenePix 7.0 (Molecular Devices). Two different images were analyzed: A FITC/Cy3 emission image was used to determine protein expression levels, while a Cy5 emission image was used to determine interacted DNA. The data from both images were extracted, and the interaction ratios between the DNA and protein signals under the “button” valve were calculated.
Inr and DPE functional element enrichment test
A list of DNA 6-mers together with their binding scores was deduced from all in vitro experiments of the same isoform. For each 6-mer, the median binding intensity of the oligonucleotides in which it appears was used as the binding score. We tested how high in the ranked 6-mer list the elements of interest were. These included initiator elements (four combinations) and a list of in vivo validated DPE elements (40 elements collected from Kutach and Kadonaga [2000], Juven-Gershon et al. [2008a], Zehavi et al. [2014], and our unpublished data). We used the Wilcoxon rank-sum test to measure the enrichment of the elements in the list. To visually illustrate the elements, we calculated a position-specific frequency matrix for each set and drew them using http://demo.tinyray.com/weblogo.
Acknowledgments
We thank Doron Ginsberg, Orit Shefi, Hila Shir, Yehuda Danino, and Miri Peley-Pinhasov for critical reading of the manuscript. Experiments depicted in Figure 1 and Supplemental Table 1 were performed in the laboratory of Jim Kadonaga (by T.J.-G.). We are indebted to Jim for his generous support and invaluable suggestions and comments. We thank Jim Kadonaga, Sascha Duttke, Yuan Wang, and George Kassavetis for sharing unpublished data and reagents. We thank Norbert Perrimon, Andreas Hochheimer, Robert Tjian, and Buyung Santoso for the generous gift of reagents. We thank Trish Willy and Sivan Henis-Korenblit for invaluable advice, and Sivan Goren for bioinformatics assistance. This work was supported by grants from the Israel Science Foundation to T.J.-G. (no. 798/10) and to R.S. (no. 317/13), the European Union Seventh Framework Programme (Marie Curie International Reintegration Grant) to T.J.-G. (no. 256491), and the National Institutes of Health to James T.Kadonaga (no. GM041249).
Footnotes
Supplemental material is available for this article.
Article published online ahead of print. Article and publication date are online at http://www.genesdev.org/cgi/doi/10.1101/gad.245670.114.
References
- Akhtar W, Veenstra GJ. 2011. TBP-related factors: a paradigm of diversity in transcription initiation. Cell Biosci. 1: 23. [DOI] [PMC free article] [PubMed] [Google Scholar]
- Austin RJ, Biggin MD. 1996. Purification of the Drosophila RNA polymerase II general transcription factors. Proc Natl Acad Sci 93: 5788–5792 [DOI] [PMC free article] [PubMed] [Google Scholar]
- Bailey TL, Boden M, Buske FA, Frith M, Grant CE, Clementi L, Ren J, Li WW, Noble WS. 2009. MEME suite: tools for motif discovery and searching. Nucleic Acids Res 37: W202–W208 [DOI] [PMC free article] [PubMed] [Google Scholar]
- Bashirullah A, Lam G, Yin VP, Thummel CS. 2007. dTrf2 is required for transcriptional and developmental responses to ecdysone during Drosophila metamorphosis. Dev Dyn 236: 3173–3179 [DOI] [PMC free article] [PubMed] [Google Scholar]
- Butler JEF, Kadonaga JT. 2001. Enhancer–promoter specificity mediated by DPE or TATA core promoter motifs. Genes Dev 15: 2515–2519 [DOI] [PMC free article] [PubMed] [Google Scholar]
- Butler JEF, Kadonaga JT. 2002. The RNA polymerase II core promoter: a key component in the regulation of gene expression. Genes Dev 16: 2583–2592 [DOI] [PubMed] [Google Scholar]
- Cianfrocco MA, Kassavetis GA, Grob P, Fang J, Juven-Gershon T, Kadonaga JT, Nogales E. 2013. Human TFIID binds to core promoter DNA in a reorganized structural state. Cell 152: 120–131 [DOI] [PMC free article] [PubMed] [Google Scholar]
- Dantonel JC, Quintin S, Lakatos L, Labouesse M, Tora L. 2000. TBP-like factor is required for embryonic RNA polymerase II transcription in C. elegans. Mol Cell 6: 715–722 [DOI] [PubMed] [Google Scholar]
- Dearolf CR, Topol J, Parker CS. 1989. The caudal gene product is a direct activator of fushi tarazu transcription during Drosophila embryogenesis. Nature 341: 340–343 [DOI] [PubMed] [Google Scholar]
- Deng W, Roberts SG. 2007. TFIIB and the regulation of transcription by RNA polymerase II. Chromosoma 116: 417–429 [DOI] [PubMed] [Google Scholar]
- Eng JK, McCormack AL, Yates JR. 1994. An approach to correlate tandem mass spectral data of peptides with amino acid sequences in a protein database. J Am Soc Mass Spectrom 5: 976–989 [DOI] [PubMed] [Google Scholar]
- Fordyce PM, Gerber D, Tran D, Zheng J, Li H, DeRisi JL, Quake SR. 2010. De novo identification and biophysical characterization of transcription-factor binding sites with microfluidic affinity analysis. Nat Biotechnol 28: 970–975 [DOI] [PMC free article] [PubMed] [Google Scholar]
- Glick Y, Avrahami D, Michaely E, Gerber D. 2012. High-throughput protein expression generator using a microfluidic platform. J Vis Exp doi: 10.3791/3849 [DOI] [PMC free article] [PubMed] [Google Scholar]
- Goodrich JA, Tjian R. 1994. Transcription factors IIE and IIH and ATP hydrolysis direct promoter clearance by RNA polymerase II. Cell 77: 145–156 [DOI] [PubMed] [Google Scholar]
- Goodrich JA, Tjian R. 2010. Unexpected roles for core promoter recognition factors in cell-type-specific transcription and gene regulation. Nat Rev Genet 11: 549–558 [DOI] [PMC free article] [PubMed] [Google Scholar]
- Heintzman ND, Ren B. 2007. The gateway to transcription: identifying, characterizing and understanding promoters in the eukaryotic genome. Cell Mol Life Sci 64: 386–400 [DOI] [PMC free article] [PubMed] [Google Scholar]
- Hochheimer A, Zhou S, Zheng S, Holmes MC, Tjian R. 2002. TRF2 associates with DREF and directs promoter-selective gene expression in Drosophila. Nature 420: 439–445 [DOI] [PubMed] [Google Scholar]
- Hodo HG 3rd, Blatti SP. 1977. Purification using polyethylenimine precipitation and low molecular weight subunit analyses of calf thymus and wheat germ DNA-dependent RNA polymerase II. Biochemistry 16: 2334–2343 [DOI] [PubMed] [Google Scholar]
- Hsu JY, Juven-Gershon T, Marr MT II, Wright KJ, Tjian R, Kadonaga JT. 2008. TBP, Mot1, and NC2 establish a regulatory circuit that controls DPE-dependent versus TATA-dependent transcription. Genes Dev 22: 2353–2358 [DOI] [PMC free article] [PubMed] [Google Scholar]
- Isogai Y, Keles S, Prestel M, Hochheimer A, Tjian R. 2007. Transcription of histone gene cluster by differential core-promoter factors. Genes Dev 21: 2936–2949 [DOI] [PMC free article] [PubMed] [Google Scholar]
- Juven-Gershon T, Kadonaga JT. 2010. Regulation of gene expression via the core promoter and the basal transcriptional machinery. Dev Biol 339: 225–229 [DOI] [PMC free article] [PubMed] [Google Scholar]
- Juven-Gershon T, Cheng S, Kadonaga JT. 2006. Rational design of a super core promoter that enhances gene expression. Nat Methods 3: 917–922 [DOI] [PubMed] [Google Scholar]
- Juven-Gershon T, Hsu JY, Kadonaga JT. 2008a. Caudal, a key developmental regulator, is a DPE-specific transcriptional factor. Genes Dev 22: 2823–2830 [DOI] [PMC free article] [PubMed] [Google Scholar]
- Juven-Gershon T, Hsu JY, Theisen JWM, Kadonaga JT. 2008b. The RNA polymerase II core promoter—the gateway to transcription. Curr Opin Cell Biol 20: 253–259 [DOI] [PMC free article] [PubMed] [Google Scholar]
- Kadonaga JT 2012. Perspectives on the RNA polymerase II core promoter. Wiley Interdiscip Rev Dev Biol 1: 40–51 [DOI] [PMC free article] [PubMed] [Google Scholar]
- Kaltenbach L, Horner MA, Rothman JH, Mango SE. 2000. The TBP-like factor CeTLF is required to activate RNA polymerase II transcription during C. elegans embryogenesis. Mol Cell 6: 705–713 [DOI] [PubMed] [Google Scholar]
- Kopytova DV, Krasnov AN, Kopantceva MR, Nabirochkina EN, Nikolenko JV, Maksimenko O, Kurshakova MM, Lebedeva LA, Yerokhin MM, Simonova OB, et al. 2006. Two isoforms of Drosophila TRF2 are involved in embryonic development, premeiotic chromatin condensation, and proper differentiation of germ cells of both sexes. Mol Cell Biol 26: 7492–7505 [DOI] [PMC free article] [PubMed] [Google Scholar]
- Kutach AK, Kadonaga JT. 2000. The downstream promoter element DPE appears to be as widely used as the TATA box in Drosophila core promoters. Mol Cell Biol 20: 4754–4764 [DOI] [PMC free article] [PubMed] [Google Scholar]
- Lenhard B, Sandelin A, Carninci P. 2012. Metazoan promoters: emerging characteristics and insights into transcriptional regulation. Nat Rev Genet 13: 233–245 [DOI] [PubMed] [Google Scholar]
- Lewis BA, Sims RJ 3rd, Lane WS, Reinberg D. 2005. Functional characterization of core promoter elements: DPE-specific transcription requires the protein kinase CK2 and the PC4 coactivator. Mol Cell 18: 471–481 [DOI] [PubMed] [Google Scholar]
- Lim CY, Santoso B, Boulay T, Dong E, Ohler U, Kadonaga JT. 2004. The MTE, a new core promoter element for transcription by RNA polymerase II. Genes Dev 18: 1606–1617 [DOI] [PMC free article] [PubMed] [Google Scholar]
- Maerkl SJ, Quake SR. 2007. A systems approach to measuring the binding energy landscapes of transcription factors. Science 315: 233–237 [DOI] [PubMed] [Google Scholar]
- Martianov I, Fimia GM, Dierich A, Parvinen M, Sassone-Corsi P, Davidson I. 2001. Late arrest of spermiogenesis and germ cell apoptosis in mice lacking the TBP-like TLF/TRF2 gene. Mol Cell 7: 509–515 [DOI] [PubMed] [Google Scholar]
- Moore PA, Ozer J, Salunek M, Jan G, Zerby D, Campbell S, Lieberman PM. 1999. A human TATA binding protein-related protein with altered DNA binding specificity inhibits transcription from multiple promoters and activators. Mol Cell Biol 19: 7610–7620 [DOI] [PMC free article] [PubMed] [Google Scholar]
- Muller F, Demeny MA, Tora L. 2007. New problems in RNA polymerase II transcription initiation: matching the diversity of core promoters with a variety of promoter recognition factors. J Biol Chem 282: 14685–14689 [DOI] [PubMed] [Google Scholar]
- Ohtsuki S, Levine M, Cai HN. 1998. Different core promoters possess distinct regulatory activities in the Drosophila embryo. Genes Dev 12: 547–556 [DOI] [PMC free article] [PubMed] [Google Scholar]
- Rabenstein MD, Zhou S, Lis JT, Tjian R. 1999. TATA box-binding protein (TBP)-related factor 2 (TRF2), a third member of the TBP family. Proc Natl Acad Sci 96: 4791–4796 [DOI] [PMC free article] [PubMed] [Google Scholar]
- Reina JH, Hernandez N. 2007. On a roll for new TRF targets. Genes Dev 21: 2855–2860 [DOI] [PubMed] [Google Scholar]
- Santoso B, Kadonaga JT. 2006. Reconstitution of chromatin transcription with purified components reveals a chromatin-specific repressive activity of p300. Nat Struct Mol Biol 13: 131–139 [DOI] [PubMed] [Google Scholar]
- Smale ST 2001. Core promoters: active contributors to combinatorial gene regulation. Genes Dev 15: 2503–2508 [DOI] [PubMed] [Google Scholar]
- Smale ST, Kadonaga JT. 2003. The RNA polymerase II core promoter. Annu Rev Biochem 72: 449–479 [DOI] [PubMed] [Google Scholar]
- Soeller WC, Poole SJ, Kornberg T. 1988. In vitro transcription of the Drosophila engrailed gene. Genes Dev 2: 68–81 [DOI] [PubMed] [Google Scholar]
- Teichmann M, Wang Z, Martinez E, Tjernberg A, Zhang D, Vollmer F, Chait BT, Roeder RG. 1999. Human TATA-binding protein-related factor-2 (hTRF2) stably associates with hTFIIA in HeLa cells. Proc Natl Acad Sci 96: 13720–13725 [DOI] [PMC free article] [PubMed] [Google Scholar]
- Thomas MC, Chiang CM. 2006. The general transcription machinery and general cofactors. Crit Rev Biochem Mol Biol 41: 105–178 [DOI] [PubMed] [Google Scholar]
- Torres-Padilla ME, Tora L. 2007. TBP homologues in embryo transcription: who does what? EMBO Rep 8: 1016–1018 [DOI] [PMC free article] [PubMed] [Google Scholar]
- van Werven FJ, van Bakel H, van Teeffelen HA, Altelaar AF, Koerkamp MG, Heck AJ, Holstege FC, Timmers HT. 2008. Cooperative action of NC2 and Mot1p to regulate TATA-binding protein function across the genome. Genes Dev 22: 2359–2369 [DOI] [PMC free article] [PubMed] [Google Scholar]
- Veenstra GJ, Weeks DL, Wolffe AP. 2000. Distinct roles for TBP and TBP-like factor in early embryonic gene transcription in Xenopus. Science 290: 2312–2315 [DOI] [PubMed] [Google Scholar]
- Wampler SL, Tyree CM, Kadonaga JT. 1990. Fractionation of the general RNA polymerase II transcription factors from Drosophila embryos. J Biol Chem 265: 21223–21231 [PubMed] [Google Scholar]
- Wang YL, Duttke SH, Chen K, Johnston J, Kassavetis GA, Zeitlinger J, Kadonaga JT. 2014. TRF2, but not TBP, mediates the transcription of ribosomal protein genes. Genes Dev 28: 1550–1555 [DOI] [PMC free article] [PubMed] [Google Scholar]
- Washburn MP, Wolters D, Yates JR 3rd. 2001. Large-scale analysis of the yeast proteome by multidimensional protein identification technology. Nat Biotechnol 19: 242–247 [DOI] [PubMed] [Google Scholar]
- Willy PJ, Kobayashi R, Kadonaga JT. 2000. A basal transcription factor that activates or represses transcription. Science 290: 982–984 [DOI] [PubMed] [Google Scholar]
- Zehavi Y, Kuznetsov O, Ovadia-Shochat A, Juven-Gershon T. 2014. Core promoter functions in the regulation of gene expression of Drosophila dorsal target genes. J Biol Chem 289: 11993–12004 [DOI] [PMC free article] [PubMed] [Google Scholar]
- Zhang D, Penttila TL, Morris PL, Teichmann M, Roeder RG. 2001. Spermiogenesis deficiency in mice lacking the Trf2 gene. Science 292: 1153–1155 [DOI] [PubMed] [Google Scholar]
- Zhou H, Grubisic I, Zheng K, He Y, Wang PJ, Kaplan T, Tjian R. 2013. Taf7l cooperates with Trf2 to regulate spermiogenesis. Proc Natl Acad Sci 110: 16886–16891 [DOI] [PMC free article] [PubMed] [Google Scholar]