Abstract
Background:
Category vs. dimension is a classic debate in psychiatry. Applying age of onset of dependence (AOOD) to categorize opioid dependence into early- (EO) and late-onset (LO) types provides a unique opportunity to critically examine this debate.
Aim:
To study if EO and LO subjects differ significantly on ‘validating variables’ from five explanatory domains: Clinical (severity), genetic (family history), psychological (sensation-seeking and impulsivity), neuropsychological (attention–concentration and executive functions), and neurophysiological (P300-evoked response potential).
Materials and Methods:
In a cross-sectional design, 60 ICD-10 DCR-diagnosed opioid-dependent male subjects (30 with AOOD≤20 years and 30 with AOOD≥22 years) comprised the two index groups (EO and LO, respectively), with their respective age-matched control groups (EOC and LOC). They were administered an extensive battery of instruments and tests based on the above domains.
Results:
The two groups differed significantly on only three out of nearly 30 variables tested. However, there emerged a clear and consistent pattern of continuum of scores across the groups and across all the variables: The EO subjects were the most impaired or affected, the LO subjects were intermediate, and the control groups fared the best. Further, nine test variables correlated significantly and meaningfully with AOOD when the dichotomy was abolished and the sample was combined into one.
Conclusions:
These results suggest that, in this particular case, the variable AOOD is more meaningful when it is used as a dimension rather than for generating categories perforce.
Keywords: Age of onset, category, dependence, dimension, opioid
INTRODUCTION AND RATIONALE OF STUDY
The category-vs.-dimension debate is an old one in academic psychiatry. Termed as the classic debate, it seeks to gain a more profound understanding of the nature and causes of psychiatric disorders.[1] The ‘category’ position asserts that it is possible to categorize (or sub-categorize) psychiatric disorders into meaningful groups, or categories, that are mutually exclusive, jointly exhaustive, reliable, and valid. On the other hand, the ‘dimension’ position contends that it is difficult, if not impossible, to artificially ‘carve nature at its joints’ and that, instead, there are inherent dimensions that capture more information useful for characterizing natural phenomena. In other words, there is no ‘this’ or ‘that’ of different things, but rather ‘more’ or ‘less’ of an underlying continuum or dimension. The value of dimensions in psychiatric classifications is being endorsed by the proposed revisions in DSM-5 (www.dsm5.org). Nonetheless, the value of categories of psychiatric disorders or their subgroups lies in their essential utility for the clinician. Thus, the classic debate continues.
The study of opioid dependence provides a unique opportunity to critically examine this classic category-vs.-dimension debate. Drug dependence is a complex disorder that includes cognitive, behavioral, and physiological signs and symptoms. Like most complex disorders, it is heterogeneous and multifactorial in etiology. The clinical heterogeneity of substance use disorders is reflected in their varied prevalence, clinical presentation, severity, vulnerability, sequelae, and comorbidity. This heterogeneity impedes attempts to determine the etiology of drug dependence, apply suitable treatments, and predict outcomes over time.
One way of reducing this substantial heterogeneity is through adopting a categorical (typological) approach. With regard to the typologies of substance abuse, a large number of univariate and a limited number of multivariate methods for subtyping alcoholism have been proposed.[2] Despite differences in methodology and terminology, many of these schemes tend to converge toward a common two-subtype model for alcoholism. One type of alcoholism is characterized by later onset, fewer vulnerability factors (as indicated by fewer first-degree family members with a history of alcoholism, and fewer antecedent conduct problems), slower progression of symptoms, fewer complications, less psychological impairment, and better prognosis. The other subtype is characterized by the opposite features.
Although less extensive than for alcoholism, attempts to subtype drug abusers have focused on single domains such as gender, personality, family history, criminal or other antisocial behavior, and age-of-onset of drug dependence. Again, not all of these efforts involved a formal test of a typologic approach. Finally, attempts at multivariate typology of drug abusers have shown that the type A–type B distinction generalizes across users of various substances such as opioids, cocaine, and marijuana.[3]
Of these diverse methods, a simple, intuitively understandable, clinician-friendly, and easy-to-use variable to categorize substance dependence is the age of onset of dependence (AOOD) criterion. Indeed, it is one of the most consistently identified common elements in almost all multivariate typologies of substance dependence. Based on this, a previous study at our center[4] showed that opioid-dependent subjects can be classified by cluster analysis into two subtypes: Early-onset (EO) (mean age at onset of opioid dependence 21 years) and late-onset (LO) (mean age at onset 27 years). The EO group is characterized by significantly younger current age, more urban and unemployed subjects, younger ages at onset of opioid use and dependence, higher severity of opioid use, higher lifetime use of sedatives and tobacco, younger ages at onset of dependence on alcohol and cannabis, higher sensation seeking, and higher global psychopathology. Other less differentiating features may be higher family history of psychiatric illness (including substance abuse), longer duration of opioid use and dependence, and a greater lifetime use of cannabis. However, it must be noted that this subtyping was done by k-means cluster analysis in which 17 variables were included; thus, most of the variables that differentiated the two subgroups were actually designated to define the subgroups because of the forced subtyping procedure (cluster analysis).
On the other hand, it is also conceivable that age of onset of opioid dependence is actually a dimension along which opioid dependence is normally distributed on a continuum. In other words, rather than generating forced categories of EO vs. LO (in which an opioid-dependent person may belong to either the EO or the LO category), age of onset of dependence may be an inherent dimensional characteristic of an opioid-dependent individual, which defines his or her relative standing on a continuum of neuropsychobiological characteristics of opioid dependence itself. If so, this dimension can serve as a useful information holder and a marker for the neuropsychobiology of opioid dependence.
Thus, the current study was planned to critically examine the category-vs.-dimension debate using AOOD as an example of a potential ‘candidate’ variable in the case of opioid dependence.
Essentially, we tested a sample of opioid-dependent males and age-matched controls on a large number of clinical, genetic, psychological, neuropsychological, and neurophysiological variables, which were associated with opioid dependence (the ‘validating’ variables). The validating variables were chosen as follows: (a) Clinical (severity of opioid dependence), (b) genetic loading (family history), (c) psychological (sensation seeking and impulsivity – both strongly associated with substance abuse),[5,6] (d) neuropsychological (attention–concentration and several frontal lobe ‘executive’ functions, which have been reported to impaired in opioid dependence),[7,8] and (e) neurophysiological (P300-evoked response potential – a marker for information processing that has been considered an important endophenotype in the genetic study of substance abuse, including opioid dependence).[9,10]
Our working hypothesis was as follows: If the ‘category’ approach is valid, then the EO and LO categories should differ significantly on most of these validating variables. On the other hand, if the ‘dimension’ approach is more appropriate, then the subgroups should not differ significantly on most of these variables, but there should be a consistent pattern in which the scores on the validating variables should be in a predictable ascending or descending order among the three groups, with the EO group being the maximally affected, the LO group intermediate, and the control group being the least affected. To cite a concrete example, the amplitude of the validating neurophysiological variable P300 should be lowest in the EO group, intermediate in the LO group, and highest (i.e., normal) in the control group. Similarly, the validating neuropsychological variable executive functions (as measured by Wisconsin Card Sorting Test) should be lowest in the EO group, intermediate in the LO group, and highest (i.e., normal) in the control group. Further, there should be a significant correlation between AOOD and at least some of the validating variables, when the entire opioid-dependent sample is considered as a whole, without force-splitting it into EO and LO groups.
MATERIALS AND METHODS
A cross-sectional design was followed. The study protocol was approved by the Institute Research Committee. Written informed consent was obtained from all subjects.
Sample
Two index groups of 30 opioid-dependent subjects each with EO and LO opioid dependence (index groups) were selected from inpatients in the ward and outpatients attending the Drug De-addiction and Treatment Centre (DDTC), Department of Psychiatry, Nehru Hospital, PGIMER, Chandigarh.
For the normal control group, two samples were obtained (n=15 each), which were age- and sex-matched with EO and LO groups (EOC and LOC groups, respectively). The subjects in each group were selected on the basis of the following inclusion and exclusion criteria:
Index groups
Two groups – EO and LO: Based on their AOOD. In EO: ≤20 years and LO: ≥22 years. AOOD was ascertained using a validated questionnaire (see later). The cut-off point was based on the previous work at our department.[4] Because distribution of AOOD tended to peak around 21 years, subjects with AOOD of 21 years were excluded from the study, in order to obtain more homogeneous subgroups.
Inclusion criteria
Patients fulfilling the ICD-10 diagnostic criteria for research (International Classification of Disorders 10th edition, Diagnostic Criteria for Research (ICD-10 DCR)) for opioid dependence
Duration of abstinence at least 1 week
Short Opiate Withdrawal Scale Score mean score <1 (to ensure that the test results were not influenced by withdrawal).
Exclusion criteria
Uncooperative subjects
Patients with mental retardation (on the basis of clinical evaluation), pervasive developmental disorder, affective disorder, or psychotic illness at time of assessment on clinical evaluation
Patients with current alcohol dependence (in the last one year)
Patients with hearing impairments (those unsuitable for participating in an evoked response potential study)
Patients with chronic severe physical illness such as uncontrolled diabetes mellitus, hypertension, etc.
Age-matched control groups
Inclusion criteria
There were two control groups each comprising 15 healthy males who were matched for age with the two index groups
They were free from any mental health problem (as assessed by GHQ-12 score < 2) at the time of assessment.
Exclusion criteria
Uncooperative subjects
Subjects with mental retardation (on basis of clinical evaluation), pervasive developmental disorder, psychotic, or affective illness at the time of assessment
Subjects with hearing impairments
Patients with chronic severe physical illness such as uncontrolled diabetes mellitus, hypertension, etc.
Instruments and tests
Socio-demographic sheet
Developed at the department, it was used to elicit and record specified details such as age, marital status, education, occupation, income, religion, locality, and family type.
Clinical profile sheet
This sheet was used to record historical and observational information under the following headings: Substance dependence data, which included class of substance, exact substance, duration of use, dependence and abstinence, Short Opiate Withdrawal Scale score, and Severity Of Dependence Questionnaire score.
Family interview for genetic studies
It was used to collect information about relatives in pedigrees.[11] Initially, with the help of a pro-band or a family member, a pedigree tree was drawn, including the pro-band, parents, siblings, and spouse. Further information collection was done in three parts: (i) General screening questions, (ii) The Face Sheet, and (iii) A symptom checklist. This scale was used to assess family history of psychiatric disorders in patients as well as controls to look for differences. We wanted to establish it as a biological subtype rather than only a clinical subtype and FIGS generated relevant clinical family data. Later a family history density was calculated as the ratio of the number of first-degree relatives (FDRs) affected to the total number of FDRs.
Questionnaire for ascertaining age at onset of substance dependence
Developed at Department of Psychiatry, PGIMER, Chandigarh, it has been made using the six criteria for substance dependence in the ICD-10 DCR (WHO, 1993).[12] This 21-item scale was used to assess age at onset of opioid dependence. It has high reliability and validity for both alcohol and opioid subgroups.
Severity of opiate dependence questionnaire
Devised by Sutherland, it assesses the quantity and pattern of opiate use, physical withdrawal aspects, withdrawal drug usage, and rapidity of reinstatement after a period of abstinence, history of opiate use, narrowing of drug repertoire, tolerance, and subjective sense of habit severity.[13] It consists of 15 items with scoring from 0 to 3. This scale was applied to characterize our sample in order to see whether the two groups differed in severity of opioid dependence and if yes how it could confound the results.
In addition, abstinence was self-reported and also ensured by urinary laboratory examination (thin-layer chromatography) to rule out the presence of any opiate.
Short opiate withdrawal scale
A self-administered scale, it consists of 10 opiate withdrawal symptoms scored as none, mild, moderate, and severe.[14] A mean SOWS score of 1 indicates mild, 2 moderate, and 3 severe withdrawal. A score <1 mean score was taken as the cut-off in the present study.
General health questionnaire – 12-item version
This 12-item version of the original GHQ with its ease of self-administration and validity has been used as a screening measure in primary care and community settings.[15] Both the English and Hindi versions have good reliability and similar psychometric properties. A score of less than 2 indicates that the subject is free from any psychiatric illness. In the present study, this scale was used to assess the presence of any psychiatric morbidity in the control groups.
Attention and concentration subtest of memory scale of PGI battery of brain dysfunction
This test for immediate memory comprised two subtests, that is, digit forward test (a relatively pure measure of attention and memory) and digit backward test (also requires manipulation of information in memory).[16]
Wisconsin card sorting test
This test measures ‘executive functioning’ requiring the ability to develop and maintain, across changing stimulus conditions, an appropriate problem-solving strategy, in order to achieve a future goal.[17] It consists of four stimulus cards and a set of two decks with 64 cards each. The subject is instructed to match each consecutive response card from the deck with each of the stimulus cards without being told the correct sorting principle. After 10 consecutive correct responses to the initial sorting principle, the principle is changed without warning, requiring the subject to use the feedback to develop a new sorting strategy. The test proceeds this way through a number of shifts in set. The original scoring rules were later modified in that the first response in the new set was not counted as a perseveratory error. This modification of the test was used as it gives a better measure of perseveration.
Trail making test
It is a test for executive functioning for speed for attention, sequencing, mental flexibility, visual search, and motor functioning.[18] It consists of parts A and B. Only the more complex part-B was used in this study.
Barratt's impulsiveness scale
This self-administered scale measures attentional, motor, and non-planning impulsiveness, and generates a total score.[19] The 30 items are scored on a 1-4 scale (rarely/never, occasionally, often, almost always/always). A higher score indicates higher impulsiveness.
Modified sensation seeking scale
This self-administered scale has 40 items, each with two choices ‘A’ and ‘B’, scored as 1 or 0; a higher score indicates higher sensation seeking.[5] It consists of four subscales (each having 10 items): Thrill and Adventure Seeking (TAS), Experience Seeking (ES), Boredom Susceptibility (BS), and Disinhibition (DIS). It has been adapted and validated for use in India.[5]
Neurophysiological testing: The P300-evoked response potential
The auditory P300 ERP was recorded using the Medtronic keypoint system.[9,10] The machine records the ERP tracing at the central and parietal sites, and has an inbuilt facility to reject artifacts. Stimuli were presented through binaural earphones at 70-100 dB. Testing was done using the auditory ‘oddball’ paradigm and a total of 500 stimuli at a frequency of 0.3-1 Hz were presented with a 15% oddball stimulus. The standard tone was delivered at 1000 Hz and the ‘oddball’ tone at a frequency of 2000 Hz. The data were bandpass-filtered in the range 0.2 Hz to 2 kHz. The data were digitized with 12 bits of resolution at a rate of 256 samples per second.
Procedure
Subjects fulfilling the selection criteria were approached and written informed consent was obtained from those who agreed to be a part of the study. Clinical and socio-demographic details were obtained from the subjects, attendants, and medical records. Abstinence from opiates was ensured by urinary thin-layer chromatography examination, and lack of opiate withdrawal was confirmed by a mean score of <1 on SOWS at intake. A one-time assessment of the subjects included in the study was carried out. The subjects were administered the test instruments in an invariate order, starting from demographic and clinical data collection, through the entire range of the test instruments. The extensive range of testing mandated usually two consecutive sessions over two days.
The test ERP was carried out at the neurophysiology laboratory of the neurology department of PGIMER, Chandigarh. All tests were done between 9.00 am and 1.00 pm in a sound-proof chamber to control the circadian effects on P300 amplitude. None of the subjects had any caffeinated drink or any tobacco use on the day of testing. Auditory stimuli were presented via binaural headphones. ERP was recorded via Ag/AgCl electrodes. ERP tracings were recorded at vertex (CZ) and parietal (PZ) electrodes referenced to A1 and A2 electrodes fixed at the left and right ear lobules, respectively, and a frontal electrode served as the ground. Impedance was kept at less than 5 kΩ and the electrodes were connected to amplifiers to be suitably amplified. The subject was presented with 500 stimuli, with 15% oddball stimuli. The tracings obtained were averaged in the machine. The P300 waveform was located by identifying by locating the peak within a time window of 250-420 ms post stimulus. The amplitude of the waveform was measured in microvolts (μv) corresponding to the absolute value of the electrical potential attained from the trough of the preceding, opposite waveform (peak-to-peak). This was done via the cursors provided in the software. The measurement of peak-to-peak amplitude of P300 has been used in cognition research corrects for the frontal negative shift that occurs in some individuals and is recommended for multi-peaked P300s. Latency was measured in milliseconds from point of stimulus to attainment of peak voltage. This procedure has been standardized in our earlier study.[9]
RESULTS
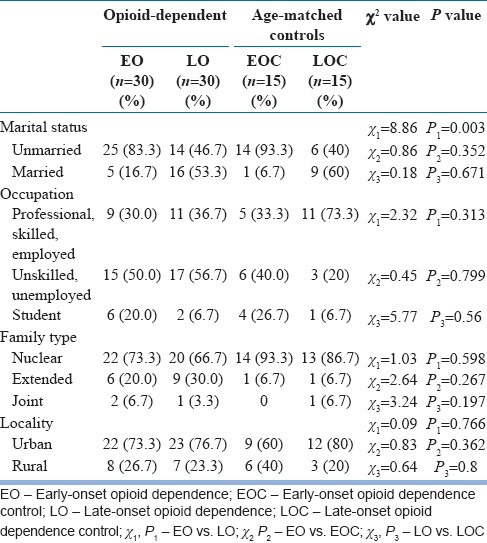
Tables 1 and 2 show the sociodemographic variables for the groups (Table 1 for continuous and Table 2 for nominal variables). Most subjects from the four groups were in their third decade of life, were unmarried, and belonged to Hindu nuclear families of urban background. As expected, EO subjects were younger than LO subjects, and hence less often married and working compared with the latter.
Table 1.
Comparison of socio-demographic profile of the subjects
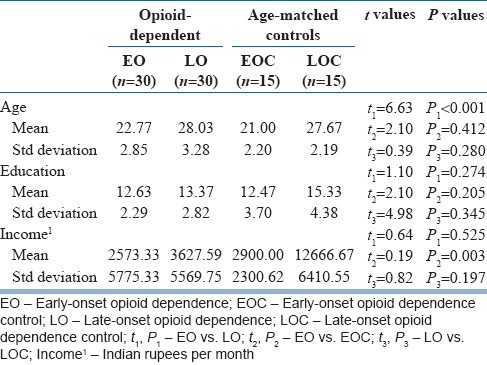
Table 2.
Comparison of socio-demographic profile (contd.)
Tables 3 and 4 show the substance use profiles of the groups (Table 3 for nominal and Table 4 for continuous variables). The majority (70%) of the subjects in the EO and LO groups were dependent on semi-synthetic/synthetic opioids. The most commonly used opioids were dextropropoxyphene and heroin. The EO group had an earlier and greater use of other associated substances such as alcohol, cannabis, and nicotine, or a combination of these; however these differences were not significant. The EO group had been dependent for a mean period of 4 years and the LO group for about 3.5 years; again, the difference was not significant.
Table 3.
Comparison of substance use profile of subjects
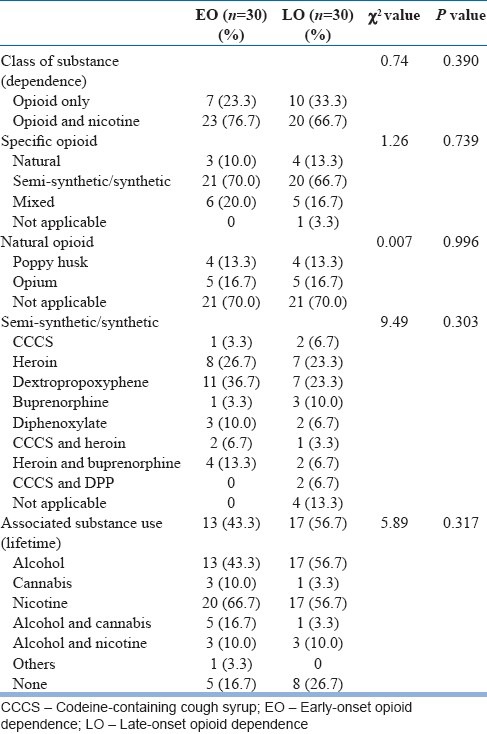
Table 4.
Comparison of substance use profile of the EO and LO groups (contd.)

Table 4 also shows the group difference on the first validating variable of severity of opioid dependence as measured by SODQ: The EO group was significantly more severely dependent on opioids than the LO group.
Table 5 shows the comparison of family history of psychiatric disorders in FDRs of the subjects. Differences were not statistically significant. However, a pattern can be noticed for a trend that was observed recurrently throughout the findings to follow in the later sections: That is, family history of psychiatric disorders (mostly substance use disorders) was most common in the EO group (46.7%) followed by the LO group (33.3%) and least common in the control groups (26.7% each).
Table 5.
Comparison of family history of psychiatric disorders in FDRs of the subjects

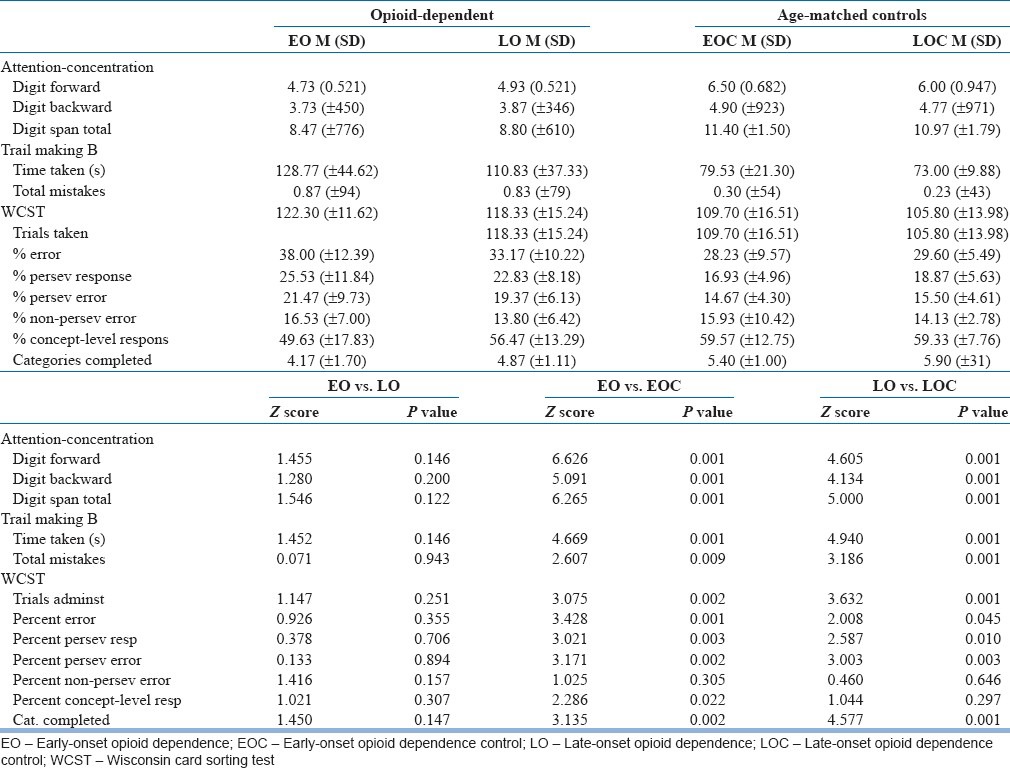
Tables 6 and 7 show the psychological and neuropsychological characteristics of the subjects, respectively.
Table 6.
Psychological characteristics of the subjects
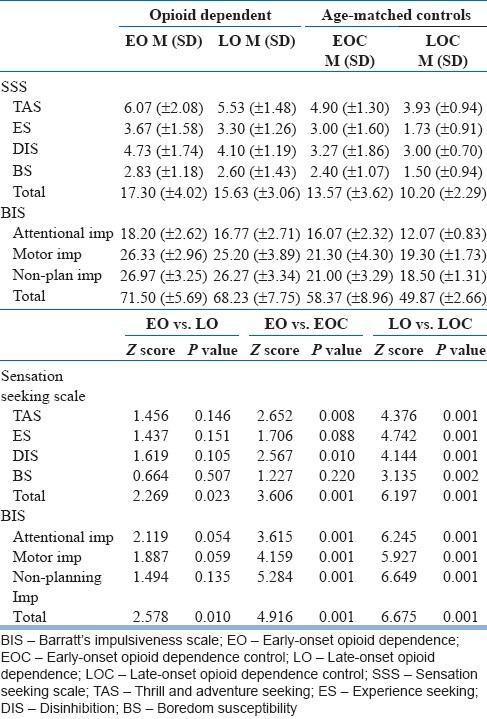
Table 7.
Profile of neuropsychological variables of the subjects
In the psychological tests [Table 6], compared with the LO group, the EO group scored significantly higher on total score on the Sensation Seeking Scale (SSS), and also higher than the EOC group for the subscales Thrill and Adventure seeking, Disinhibition, and total score. There were also more sensation-seeking subjects in the LO group than in the LOC group for all the subscales.
On Barratt's Impulsiveness Scale (BIS), difference was significant between the EO and LO groups for Total Score, and between the EO and EOC, and LO and LOC groups, for all subscales and Total Score.
There are three striking observations here. First, both the opioid-dependent groups scored significantly higher than their respective control groups on virtually all the psychological scales and subscales. This suggests that, as a group, opioid-dependent people are more sensation-seeking and impulsive than their control groups irrespective of the age factor. Thus, age per se cannot explain the psychological characteristics of opioid-dependent subjects. Second, the EO and LO groups themselves differed significantly from each other only on the total scores of SSS and BIS, and not on any of the subscale scores, that is, only on 2 out of 9 scores. Third, and most importantly from the point of view of our study, just like in the case of family history, again there was a continuum of scores – the EO group was the most sensation-seeking and impulsive and the LO group was intermediate, whereas the control groups were the least sensation-seeking and impulsive. It is to be noted that this pattern was consistent across all the subscale scores of SSS and BIS.
Coming to the neuropsychological profile [Table 7], on the attention and concentration test and Trail Making B test, the EO subjects scored poorer compared with the LO group, although no statistical difference was seen; however, the differences were significant between the EO vs. EOC and LO vs. LOC groups. Similarly, on the Wisconsin Card Sorting Test, the EO subjects scored poorer compared with the LO subjects, although no statistical difference was seen; however, the differences were significant between EO vs. EOC on all the variables studied except percent non-perseveratory errors and between the LO and LOC on all except percent non-perseveratory errors and percent conceptual level responses.
Again, very similar observations can be made as before. First, both opioid-dependent groups scored significantly higher than their respective control groups on most of the neuropsychological tests and various test scores. This suggests that, as a group, opioid-dependent people are more neuropsychologically impaired (attention–concentration and frontal executive functions) than the control groups irrespective of the age factor. Thus, age per se cannot explain the neuropsychological characteristics of opioid-dependent subjects. Second, the EO and LO groups themselves did not differ significantly from each other on any of the tests. Third, and most importantly from the point of view of our study, just like in the case of family history and psychological variables, again there was a continuum of scores – the EO group was the most neuropsychologically impaired and the LO group was intermediate, whereas the control groups were the least impaired. It is to be noted that, as previously, this pattern was consistent across all test scores of neuropsychological functioning.
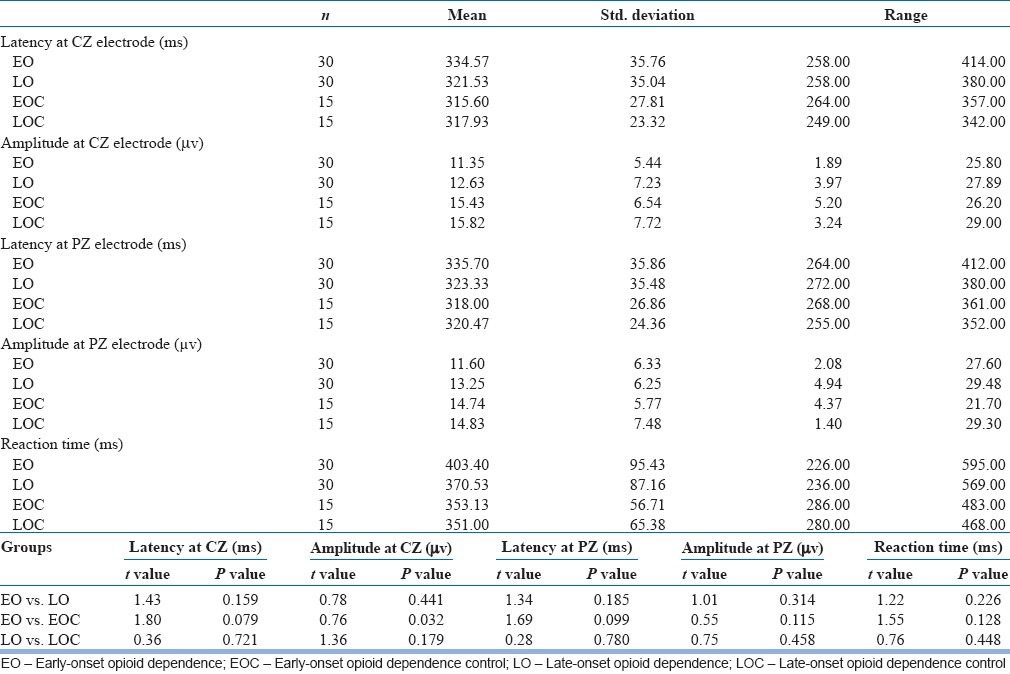
Next, Table 8 shows the neurophysiological profile of the subjects as evidenced by P300 ERP in terms of latency and amplitude of the P300 wave. This time there was hardly any significant difference between any of the groups on any of the tests, except a significant difference between the EO and its control group on P300 amplitude at CZ. However, despite these non-significant differences, our third observation (as above) still held good even here: The EO group displayed longest latencies and smallest amplitudes of P300 at both electrode placements, the LO group was intermediate, and the control groups showed the shortest latencies and biggest amplitudes of the wave in response to the oddball stimulus. Thus, yet again, a consistent pattern in information-processing capacity across the groups was observed – EO faring the worst, LO intermediate, and the control groups the best.
Table 8.
Comparison of event-related potential P300 variables of the subjects
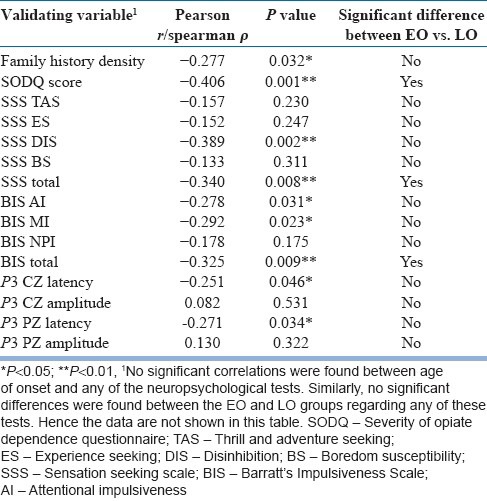
Finally, Table 9 shows the correlation between age of onset of opioid dependence and the validating variables in the combined opioid dependent sample (n=60), and also presents for side-by-side comparison the summary results obtained on the same variables from the EO–LO dichotomy (from previous tables). The idea behind this exercise was that, if age of onset is a useful dimension to characterize opioid dependence, then it should have significant correlation with a number of validating variables, irrespective of any sub-grouping. It was seen that age of onset was indeed significantly and meaningfully correlated with nine such variables: Family history density, SODQ score, SSS disinhibition subscale and total score, two impulsivity subscales and total score, and the latency of P300 at both electrode placements. All these correlations were in the negative direction, which made biological sense, for example, an earlier age of onset of opioid dependence is associated with a higher family loading, higher sensation seeking and impulsivity, higher severity, and longer information-processing time. On the other hand, significant differences were found between the EO and LO groups only on three variables, SODQ, SSS total, and BIS total. However, no significant correlations were found between age of onset and any of the neuropsychological tests. Similarly, no significant differences were found between the EO vs. LO groups on any of these tests. Hence these data are not shown in this table.
Table 9.
Correlation between age of onset of opioid dependence and validating variables (n=60), and comparison with results obtained from the EO-LO dichotomy (from previous tables)
DISCUSSION
Like all substance use disorders, and, indeed, all psychiatric disorders, opioid dependence is a heterogeneous condition. Heterogeneity creates confusion and impedes our understanding of the condition. The two basic ways to reduce this heterogeneity are, first, a categorical (or typological) approach, and second, a dimensional (or continuum) approach. Both approaches have their plus and minus points, hence the classic debate continues. We aimed to critically examine this debate by placing opioid dependence under the investigational microscope, as a ‘test case’.
We chose AOOD as the pivot on which to spin the debate for three reasons. First, there is evidence, from both alcohol and opioid dependence research, to suggest that it is a central element that underlies several typologic approaches such as Cloninger's type-I–type-II and Babor's type-A–type-B multivariate typologies, and our own past work documenting its usefulness in the typology of opioid dependence. Second, it is relatively easy to operationalize and intuitively sensible. Third, this element can be utilized to both generate categories as well as lend itself to a dimensional examination. One cannot afford to have this luxury, for example, with cluster analysis-based typologies (such as type-A–B) or inherently dicohotomizing variables (such as family history or psychopathology based positive vs. negative subtypes).
When our sample of opioid-dependent subjects was dichotomized into EO and LO categories based on this variable, the two groups were differentiated utilizing an extensive array of validating variables spanning the entire biopsychosocial domains (clinical, genetic, psychological, neuropsychological, and neurophysiological). If the category approach is more meaningful, then the two groups should be significantly different from each other regarding most of these variables. We included two separate, age-matched, control groups in the study design to ensure that the observed differences were not merely a function of age of the subjects (for example, findings on P300 and some psychological and neuropsychological variables can change with advancing age). However, there were rather few significant differences (specifically, three out of nearly 30 scores tested on five domains) between the two groups. This fact compromises the value of a categorical approach as used in this study.
On the other hand, if a dimensional approach is more useful, then the scores on the validating variables should lie on a continuum where, irrespective of statistical significance, the pattern of scores across the groups is more important – the EO group should be the most severely affected, the controls the least, and the LO group lying intermediate. This is exactly what was found in our study for all the validating variables applicable to the index and the control groups: Family history, both psychological domain variables (sensation seeking and impulsivity), both neuropsychological domain variables (attention–concentration and several executive functions), and neurophysiological domain variable (information-processing speed and extent as indicated by P300 ERP latency and amplitude). Furthermore, when the artificial categories were abolished and correlation exercises were conducted on the total sample of opioid-dependent subjects, at least one test score from four of the five specific domains was significantly – and meaningfully – correlated with AOOD (neuropsychological domain variables being the only exception).
There are several caveats that must be kept in mind while interpreting the results. First, although we took special care in ascertaining AOOD using a validated and previously used instrument, it is by definition a construct based on retrospective recall, with its accompanying problems. Second, it may be argued that the small sample size was responsible for many non-significant differences between the EO and LO groups, that is, a type-II error. While this possibility cannot be ruled out, the fact remains that many differences (especially on SSS and BIS, and their numerous subscales) came out to be significant between the index and the respective control groups, which had an even smaller number (n=15 in both EOC and LOC). Further, although no prior sample size was calculated because of the exploratory nature of the study without defining any single study variable as the primary outcome variable a priori (without which the sample size cannot be calculated), post-hoc power calculations using the major study variables yielded power estimations in the range 70%-85% for the various variables, thus generally falling within acceptable limits. Third, one may question the choice of the validating variables. Admittedly, this had to be arbitrary. Our aim was to select at least one important variable from all explanatory domains – clinical, genetic, psychological, neuropsychological, and neurophysiological. Fourth, it would have been very valuable to generate a prospective course and outcome data as well, which could have further informed this debate. Finally, it must be remembered that our opioid-dependent sample came from clinic-attending, treatment-seeking, and reasonably motivated patients. Thus, these results should not be automatically assumed to be applicable to the entire population of opioid-dependent subjects.
Within these caveats, then, returning to the central question raised in our study, the findings suggest that it may not be appropriate to categorize opioid dependence into forced categories of EO and LO. This does not mean, however, that AOOD is a useless concept. On the contrary, AOOD emerges as a very important organizing principle in understanding opioid dependence – from clinical, genetic, psychological, neuropsychological, and neurophysiological perspectives. As such, it is a valuable concept but its value is enhanced when it is used as a dimension rather than for generating categories perforce. At least on this count, dimensional approach wins the debate over a categorical approach!
Footnotes
Source of Support: Nil
Conflict of Interest: None declared
REFERENCES
- 1.Kraemer HC, Noda A, O’Hara R. Categorical versus dimensional approaches to diagnosis: Methodological challenges. J Psychiatr Res. 2004;38:17–25. doi: 10.1016/s0022-3956(03)00097-9. [DOI] [PubMed] [Google Scholar]
- 2.Gupta N, Basu D. The ongoing quest for sub-typing substance abuse: Current status. Indian J Psychiatry. 1999;41:289–99. [PMC free article] [PubMed] [Google Scholar]
- 3.Basu D, Ball SA, Feinn R, Gelernter J, Kranzler HR. Typologies of drug dependence: Comparative validity of a multivariate and four univariate models. Drug Alcohol Depend. 2004;73:289–300. doi: 10.1016/j.drugalcdep.2003.11.004. [DOI] [PubMed] [Google Scholar]
- 4.De B, Mattoo SK, Basu D. Role of age at onset of opioid dependence in subtyping opioid dependent educated male patients. Am J Addict. 2003;12:336–45. [PubMed] [Google Scholar]
- 5.Basu D, Varma VK, Malhotra S, Malhotra A. Sensation seeking scale: Indian adaptation. Indian J Psychiatry. 1993;35:155–8. [PMC free article] [PubMed] [Google Scholar]
- 6.Petry NM, Bickel WK, Arnett M. Shortened time horizons and insensitivity to future consequences in heroin addicts. Addiction. 1998;93:729–38. doi: 10.1046/j.1360-0443.1998.9357298.x. [DOI] [PubMed] [Google Scholar]
- 7.Fishbein DH, Krupitsky E, Flannery BA, Langevin DJ, Bobashev G, Verbitskaya E, et al. Neurocognitive characterizations of Russian heroin addicts without a significant history of other drug use. Drug Alcohol Depend. 2007;90:25–38. doi: 10.1016/j.drugalcdep.2007.02.015. [DOI] [PMC free article] [PubMed] [Google Scholar]
- 8.Brand M, Roth-Bauer M, Driessen M, Markowitsch HJ. Executive functions and risky decision-making in patients with opiate dependence. Drug Alcohol Depend. 2008;97:64–72. doi: 10.1016/j.drugalcdep.2008.03.017. [DOI] [PubMed] [Google Scholar]
- 9.Singh SM, Basu D, Kohli A, Prabhakar S. Auditory P300 event-related potentials and neurocognitive functions in opioid dependent men and their brothers. Am J Addict. 2009;18:198–205. doi: 10.1080/10550490902786975. [DOI] [PubMed] [Google Scholar]
- 10.Singh SM, Basu D. The P300 event-related potential and its possible role as an endophenotype for studying substance use disorders: A review. Addict Biol. 2009;14:298–309. doi: 10.1111/j.1369-1600.2008.00124.x. [DOI] [PubMed] [Google Scholar]
- 11.Nurnberger JI, De Paulo JR, Gershon ES. University Of Washington: St. Louis; 1994. Family interview for genetic studies. NIMH Genetic Interview Group. [Google Scholar]
- 12.Gupta N, Basu D. Questionnaire for ascertaining age at onset of substance dependence: A preliminary study. Indian J Soc Psychiatry. 1997;13:26–35. [Google Scholar]
- 13.Sutherland G, Edwards G, Taylor C, Phillips G, Gossop M, Brady R. The measurement of opiate dependence. Br J Addict. 1986;81:485–94. doi: 10.1111/j.1360-0443.1986.tb00360.x. [DOI] [PubMed] [Google Scholar]
- 14.Gossop M. The development of a short opiate withdrawal scale (SOWS) Addict Behav. 1990;15:487–90. doi: 10.1016/0306-4603(90)90036-w. [DOI] [PubMed] [Google Scholar]
- 15.Gautam S, Nijhawan M, Kamal P. Standardization of Hindi version of Goldberg's General Health Questionnaire. Indian J Psychiatry. 1987;29:63–6. [PMC free article] [PubMed] [Google Scholar]
- 16.Pershad D, Verma SK. Agra: Agra Psychological Corporation; 1990. PGI battery of brain dysfunction. [Google Scholar]
- 17.Robinson AL, Heaton RK, Lehman RA, Stilson DW. The utility of the Wisconsin Card Sorting Test in detecting and localizing frontal lobe lesions. J Consult Clin Psychol. 1980;48:605–14. doi: 10.1037//0022-006x.48.5.605. [DOI] [PubMed] [Google Scholar]
- 18.Hay S. Trail making test norms for psychiatry patients. Percept Mot Skills. 1995;80:187–94. doi: 10.2466/pms.1995.80.1.187. [DOI] [PubMed] [Google Scholar]
- 19.Patton JH, Stanford MS, Barratt ES. Factor structure of the Barratt Impulsiveness Scale. J Clin Psychol. 1995;51:768–74. doi: 10.1002/1097-4679(199511)51:6<768::aid-jclp2270510607>3.0.co;2-1. [DOI] [PubMed] [Google Scholar]


