

Abstract
Methylprednisolone (MPL) pharmacokinetics was examined in adrenalectomized (ADX) and normal rats to assess the feasibility of intramuscular (i.m.) dosing for use in pharmacodynamic studies. Several study phases were pursued. Parallel group studies were performed in normal and ADX rats given 50 mg/kg MPL (i.v. or i.m.) and blood samples were collected up to 6 h. Data from studies where normal rats were dosed with 50 mg/kg MPL i.m. and killed over either 6 or 96 h were combined to determine muscle site and plasma MPL concentrations. Lastly, ADX rats were dosed with 50 mg/kg MPL i.m. and killed over 18 h to assess hepatic tyrosine aminotransferase (TAT) dynamics. MPL exhibited bi-exponential kinetics after i.v. dosing with a terminal slope of 2.1 h−1. The i.m. drug was absorbed slowly with two first-order absorption rate constants, 1.26 and 0.219 h−1 indicating flip-flop kinetics with overall 50% bioavailability. The kinetics of MPL at the injection site exhibited slow, dual absorption rates. Although i.m. MPL showed lower bioavailability compared with other corticosteroids in rats, TAT dynamics revealed similar i.m. and i.v. response profiles. The more convenient intramuscular dosing can replace the i.v. route without causing marked differences in pharmacodynamics.
Keywords: methylprednisolone, corticosteroids, pharmacokinetics, intramuscular injection, tyrosine aminotransferase
Introduction
Synthetic corticosteroids (CS) are widely used as anti-inflammatory and immunomodulatory agents in the treatment of various life-threatening diseases. Long-term therapy, however, may cause severe gene-mediated metabolic side effects [1,2]. For the past two decades the authors have been involved in developing mechanistic pharmacokinetic/pharmacodynamic/pharmacogenomic (PK/PD/PG) models for CS to gain quantitative understanding of various molecular mechanisms involved in their metabolic effects [3-6].
Most of our previous studies used ADX rats [5-7]. Due to the absence of endogenous corticosterone (CST), this model facilitates the assessment of various pharmacodynamic/toxicodynamic factors affected by drug treatment. Although normal rats are the more physiologically relevant model, challenges are encountered in distinguishing the effects of exogenous steroids from endogenous CST. This becomes a particular concern when the drug is administered intravenously, usually requiring the placement of a jugular vein cannula. This causes stress to the animals producing an increase in endogenous CST. Other routes such as penile and tail vein injections require anesthesia or restraint of animals and considerable technical expertise for reproducible dosing [8]. Therefore, other parenteral routes such as intramuscular (i.m.), intraperitoneal (i.p.) and subcutaneous (s.c.) dosing warrant consideration. The i.p. route produces hepatic first-pass metabolism leading to low bioavailability [9], risk for infection, and/or intestinal adhesions [8]. For many drugs, s.c. administration results in slower and less reproducible delivery compared with the i.m. route [10].
Methylprednisolone (MPL), an intermediate acting CS, was used to study various genomic and proteomic dynamic responses [4-7,11]. While the PK of MPL has been well studied after i.v. administration [12,13], the absorption characteristics of MPL are not well characterized after i.m. injection. The main objectives of this study were to (1) compare the PK of MPL in ADX and normal rats after i.v. and i.m. administration, (2) determine the bioavailability of MPL after i.m. injection, (3) determine the release kinetics of MPL from the injection site, and (4) compare the dynamics of hepatic tyrosine aminotransferase (TAT) mRNA and activity, highly studied biomarkers of CS [5-7,14], after i.v. and i.m. administration of MPL in ADX rats.
Material and Methods
Animals
Normal and adrenalectomized male Wistar rats were purchased from Harlan-Sprague-Dawley Inc. (Indianapolis, IN). The animals were housed in our University Laboratory Animal Facility and acclimatized under constant temperature (22°C) and humidity with a controlled 12 h/12 h light/dark cycle for at least 1 week. All rats had access to rat chow and drinking water (0.9% NaCl was included in drinking water for ADX rats). The protocol adhered to the Principles of Laboratory Animal Care (National Institute of Health publication 85-23, revised 1985) and was approved by the University at Buffalo Institutional Animal Care and Use Committee.
Experimental
Comparison of PK in normal and ADX rats (Study 1)
Eight ADX and eight normal rats, weighing 250–325 g, underwent right external jugular vein cannulation under ketamine/xylazine anesthesia. Cannula patencies were maintained with heparinized saline (42U heparin/ml saline). After 24 h of recovery from the surgery, four of each type of rats were given 50mg/kg methylprednisolone succinate (Solu-Medrol®, Pharmacia & Upjohn Company, Kalamazoo, MI) either i.v. via the jugular vein cannula or by i.m. injection in the left hind haunch (gluteus muscle). Blood samples were collected via the cannula at 0.083, 0.25, 0.5, 1, 2, 3 and 4 h. The animals were killed at 6 h and blood was collected in EDTA containing syringes.
Determination of injection site drug (Study 2)
Twenty-one normal male Wistar rats (275–300 g) were given MPL-succinate by i.m. injection in the left hind haunch. Animals were killed at 0.083, 0.25, 0.75, 1, 2, 4 and 6 h (n = 3 at each time point). Blood was collected and portions of the gluteus muscles (1.5–2.5 g) were excised from the injection site, flash frozen in liquid nitrogen and stored at −80°C until analysis for MPL.
Pharmacodynamic study (Study 3)
Twenty-four ADX male Wistar rats (250–300 g) were given MPL-succinate by i.m. injection in the left hind haunch and killed at 1, 2, 4, 6, 8, 12 and 18 h (n = 3 at each time point). Three rats, injected with saline, served as controls. Blood was collected; plasma was harvested and stored at −20°C until analysis. For the TAT enzymatic assay approximately 1 g of liver was rapidly excised for preparation of supernatants. The remaining liver tissue was flash-frozen in liquid nitrogen and stored at −80°C until further analysis.
‘Giant rat’ study in normal rats (Study 4)
This study was performed primarily to determine the effects of MPL on CST suppression as well as to examine its effect on various pharmacodynamic biomarkers related to carbohydrate, protein and lipid metabolism. Fifty-four normal male Wistar rats, weighing 275–325 g, were acclimatized to a strict 12 h/12 h light/dark regimen for a period of 2 weeks. After acclimatization, the animals were dosed with 50mg/kg MPL-succinate i.m. Injections were given at the nadir of their endogenous CST circadian rhythm (1.5–3.5 h after lights on). The animals were killed at 0.25, 0.5, 0.75, 1, 2, 4, 5, 6, 7, 8, 12, 24, 36, 48, 60, 72, 84 and 96 h (n = 3 at each time point). Blood was collected, then plasma was harvested and stored at −80°C until further analysis.
Concentrations of MPL-succinate for injection were prepared using sterile technique with the diluent provided by the manufacturer to keep the injection volume below 100 μl. Animals were killed by aortic exsanguinations under ketamine/xylazine anesthesia. Blood was collected in EDTA containing syringes (from the abdominal aorta for destructive sampling), centrifuged immediately at 2000 × g at 4°C for 15 min to obtain plasma which was stored at −20°C until analysis.
Drug assay
Plasma samples were thawed at room temperature and immediately kept on ice until extraction of the drug. Dexamethasone was used as an internal standard. Samples (0.025–0.5 ml) were extracted with methylene chloride. The organic phase was then evaporated to dryness under purified air and reconstituted with mobile phase for injection. Concentrations of MPL were determined by normal phase liquid chromatography (HPLC) with a lower limit of quantification of 10 ng/ml [15].
To determine MPL in the injection site, muscle tissues were ground into powder in liquid nitrogen. Tissues were weighed and homogenized with 10 X PBS (Invitrogen Inc., Auckland, NZ). For construction of the standard curve, various concentrations of methylprednisolone (Sigma-Aldrich, St Louis, MO) in ethanol were added to homogenized muscle tissues from control rats to provide a concentration range of 50–1000 ng/ml. Standards and samples were extracted using methylene chloride for HPLC assay [15].
TAT mRNA and activity assays
Hepatic TAT mRNA was quantified using a quantitative real-time reverse transcriptase-polymerase chain reaction (QRT RT-PCR) assay. The details of the general procedure of this assay are described elsewhere [16,17]. The specific sequences for the FAM-labeled probes, forward and reverse primers, and concentration of magnesium chloride for determination of TAT mRNA are given in Table 1. The inter- and intra-assay variability was less than 15%.
Table 1.
Reaction conditions for quantitative real-time reverse transcriptase-polymerase chain reaction (QRT RT-PCR)
| Oligonucleotide | Concentration | Sequence 5′-3′ |
|---|---|---|
| Forward primer | 300nM | GACATGGTGTTTTCAGATTGCAA |
| Reverse primer | 300nM | CAGGACAGGATGGGAACATTG |
| FAM-labeled probe | 100nM | TACGAACCACTGGCCAACCTCAGCA |
| MgCl2 | 3mM | — |
| DNTP | 1mM | — |
Hepatic TAT activity was determined by the method of Diamondstone and reported as the change in absorbance (ABS) at 331 nm over time (dABS/dt) [18]. These absorbance values were normalized for protein content in the crude liver supernatant using the Lowry assay [19].
Pharmacokinetic analysis
A non-compartmental analysis (NCA) was performed on the concentration-time profiles of MPL from individual rats to compare the PK of MPL (both i.v. and i.m. groups) between normal and ADX rats (WinNonlin 5.0, Pharsight Corp., Mountain View, CA). The maximum plasma concentration (C0 for i.v. and Cmax for i.m.) and the corresponding time (Tmax) were directly obtained from the observed data. The areas under the plasma-concentration time curves (AUC(0–Tlast)) were obtained using the linear/log trapezoidal method from time 0 to the last time point of observation (Tlast). The terminal slope (λz) was determined by linear regression of the terminal phase of the log-linear concentration-time profile (using the last three time points). The terminal half-life (T1/2_λz) was calculated from ln(2)/λz. The area under the curve (AUC(Tlast-∞)) from the last quantifiable concentration (Clast) to time infinity was extrapolated using Clast/λz. The total AUC (AUC(0-∞)) was calculated as the sum of AUC(0-Tlast) and AUC(Tlast-∞). Clearance (CL or CL/F: i.m.) was determined by dose/AUC(0-∞). The apparent volume of distribution (Vc or Vc/F) was calculated using the dose/(λz · AUC(0-∞)). The bioavailability (F) after i.m. administration was calculated as (AUC(0-∞)_i.m./AUC(0-∞)_i.v.). The PK parameters following i.v. and i.m. dosing were compared using unpaired t-tests using GraphPad Prism software (GraphPad Software Inc., San Diego, CA). Statistical significance was determined at a level of p <0.05. All values are represented as mean ± SD.
A two-compartment mammillary model with two absorption components from the injection site was used to describe the PK of MPL in plasma as well as at the injection site (Figure 1). The equations and initial conditions describing the model are:
| (1) |
| (2) |
| (3) |
| (4) |
| (5) |
where A, C and D are the amount, concentration and dose in the corresponding compartments designated by the subscripts P, T and MUS representing plasma, tissue (distribution) or injection site (absorption) compartments; kel is the first-order elimination rate constant from the central compartment, Vc is the central volume of distribution, k12 and k21 are the first-order inter-compartmental distribution rate constants, F is the overall i.m. bioavailability and Fr and (1–Fr) are the fractions of dose absorbed through two absorption pathways described by two first-order rate constants, ka1 and ka2 with corresponding volumes of Va1 and Va2. The subscripts, (i.v.) and (i.m.) indicate the intravenous and intramuscular administration routes.
Figure 1.
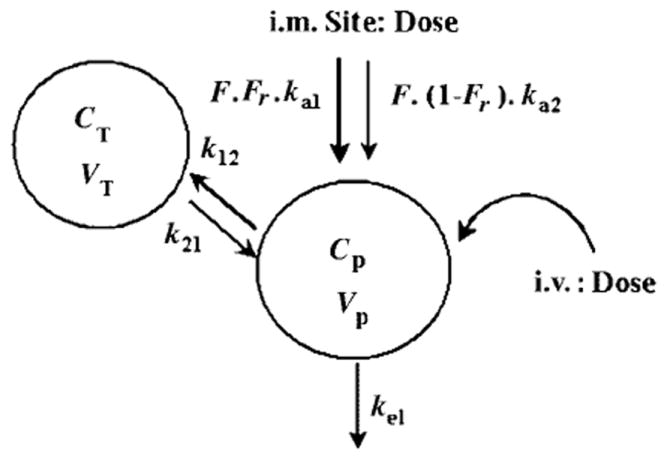
Pharmacokinetic model for methylprednisolone; the symbols are described in the text and Table 3
The individual plasma concentrations of MPL from the i.m. groups (Study 2 and 4) and i.v. groups (Study 1) were fitted simultaneously to Equations (1)-(4) to obtain estimations of kel, Vc, k12, k21, ka1, ka2, F and Fr. Subsequently, Va1 and Va2 were estimated by fitting the average muscle site concentrations to Equation (5). The ADAPT II [20] program was employed with the Maximum Likelihood method. The variance model used was:
| (6) |
where ϒ represents the predicted value, V(σ, θ, ti) is the variance of the ith point, θ represents the structural parameters, and σ1 and σ2 are the variance parameters that were fitted. The choice of model was based on model fitting criteria such as visual inspection of the fitted curves, Akaike Information Criteria (AIC), Schwartz Criteria (SC), weighted sum of squared residuals and CV% of the parameter estimates.
To obtain 95% confidence intervals (CI) of the model predictions, 1000 simulations were performed using the estimated model parameters, variability of the estimated parameters and residual variability of the data. As a further predictive check, additional concentration-time data from ADX rats after 50 mg/kg i.v. MPL were obtained from a published study [7].
TAT dynamics
The areas under the effect curves (AUEC) vs time and their standard deviations for hepatic TAT mRNA and activity were calculated using Bailer’s method [21]. The degrees of freedom were determined using the Bailer-Satterthwaite method [22] to compare the i.v. with the i.m. group using unpaired t-tests. Statistical significance was determined at a level of p < 0.05.
Results
Comparison of PK in normal and ADX rats
The mean plasma concentration-time profile of methylprednisolone in normal and ADX rats from Study 1 are shown in Figure 2. By visual inspection, no significant difference between ADX and normal rats was observed after i.v. and i.m. dosing. This observation was corroborated by the parameter values from non-compartmental analysis, shown in Table 2. The terminal half-lives for ADX and normal rats after i.m. dosing were longer (normal and ADX: 1.1 h) compared to i.v. dosing (normal: 0.5 h; ADX: 0.33 h) suggesting the existence of flip-flop absorption kinetics. The PK profiles for ADX and normal rats after i.m. dosing were similar. In terms of AUC and Cmax values, the ADX and normal rats were comparable for both i.v. and i.m. dosing (normal: AUC: 14.5 μg h/ml; ADX: 11.0 μg h/ml). However, in both animal models, i.v. dosing resulted in significantly higher (approximately twice) mean AUC and Cmax values compared with i.m. dosing (normal: AUC: 5.08 μg h/ml; ADX: 5.27 μg h/ml). Consequently, the bioavailabilities in both groups were estimated to be less than 50% (normal: 0.35; ADX: 0.48).
Figure 2.
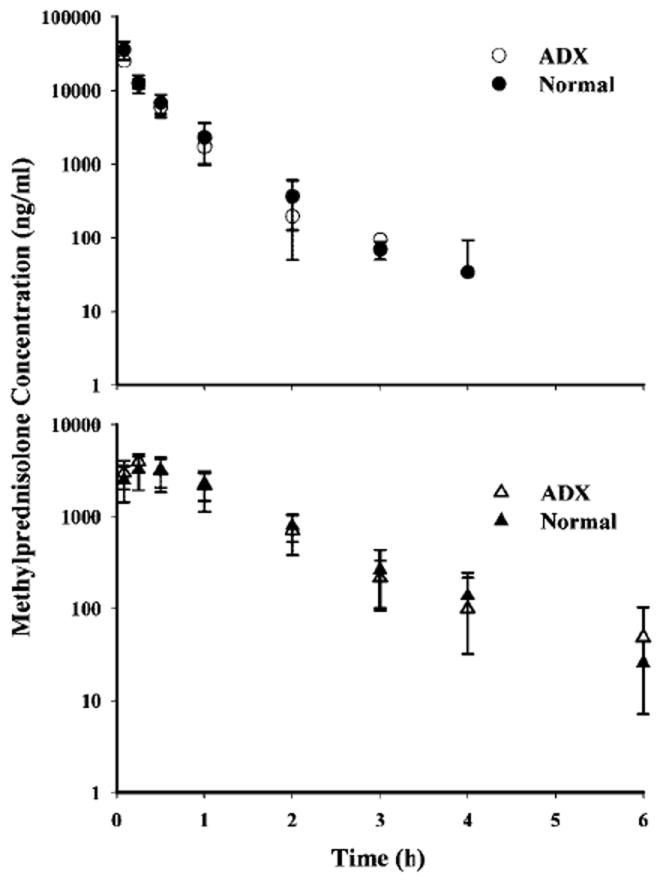
Pharmacokinetic profiles of methylprednisolone (50 mg/kg) after i.v. (top panel) and i.m. (bottom panel) administration in ADX and normal rats. Symbols depict mean observed data (four rats) ± SD
Table 2.
Pharmacokinetic parameters for methylprednisolone after i.v. and i.m. administration from non-compartmental analysis
| Parameters | Definition | i.v.
|
i.m
|
||
|---|---|---|---|---|---|
| ADX | Normal | ADX | Normal | ||
| λz (h−1) | Terminal slope | 2.14 (0.40) | 2.10 (0.40)a | 1.12 (1.02) | 0.66 (0.17)a |
| T1/2λz(h) | Terminal half-life | 0.33 (0.06) | 0.50 (0.12) | 1.1 (0.82) | 1.1 (0.28) |
| Cmax or C0 (μg/ml) | Maximum/initial concentrations | 36.2 (5.7) | 62.0 (23.4) | 4.2 (0.83) | 3.2 (1.2) |
| AUC0-∞ (μg.h/ml) | Area under the curve | 11.0 (1.6)b | 14.5 (2.1)c | 5.27 (0.82)b | 5.08 (1.141)c |
| CL (1/h/kg) | Clearance | 4.6 (0.5) | 3.5 (0.5) | — | — |
| CL/F (1/h/kg) | Apparent clearance | — | — | 9.68 (1.69) | 10.3 (2.7) |
| Vc (1/kg) | Central volume | 2.2 (0.2) | 2.6 (0.9) | — | — |
| Vc/F (1/kg) | Apparent central volume | — | — | 16.4 (13.1) | 16.9 (8.4) |
| F | Bioavailability | — | — | 0.48 (0.13) | 0.35 (0.22) |
(Values represent the mean ± SD);
p <0.01,
p <0.001,
p <0.01.
Compartmental analysis of MPL in normal rats
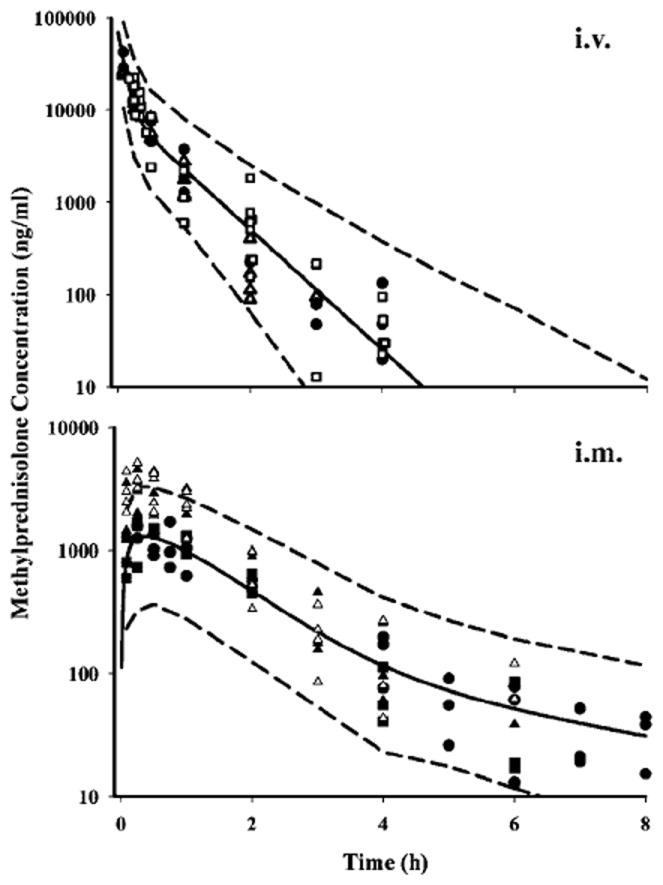
The time course of methylprednisolone plasma concentrations in normal rats are shown in Figure 3 along with mean and 95% confidence interval (CI) of the model predictions. MPL could not be detected in plasma after 4 h in any of the rats from the i.v. dose group, whereas drug was detectable up to 8 h in the animals from the i.m. group from all studies (serial sampling: Study 1; destructive sampling: pooled from Studies 2 and 4). Both i.v. and i.m. profiles of MPL were well captured with the two-compartment model shown in Figure 1, with reasonable variability of the estimated parameters (Table 3). Two first-order absorption processes, one with a faster absorption rate (1.255 h−1, 23.2% CV) than the other (0.219 h−1, 53.6% CV) were optimal to describe the release of MPL from the injection site. The terminal slope (λz: 2.1 h−1, 28.6% CV) was longer than the two absorption rate constants combined indicating absorption rate limited elimination (flip-flop kinetics) after i.m. dosing as expected from the non-compartmental analyses. The value of Fr indicates that about 72.5% of the drug in the muscle site can be released in the circulation via the faster absorption pathway (1.255 h−1), whereas the remaining fraction is released via a slower absorption pathway (0.219 h−1). The overall bioavailability of MPL, 0.214 (16.4% CV) in rats, pooled from Studies 2 and 4, was lower than that obtained from Study 1 (0.35–0.48 by NCA). The clearance (4.01/h/kg, calculated from kel · Vc) and Vc (0.719l/kg, 39.5% CV) values were quite similar to previously reported values (Clearance: 3.48l/h/kg and Vc: 0.73l/kg) in ADX rats after single doses of MPL [6].
Figure 3.
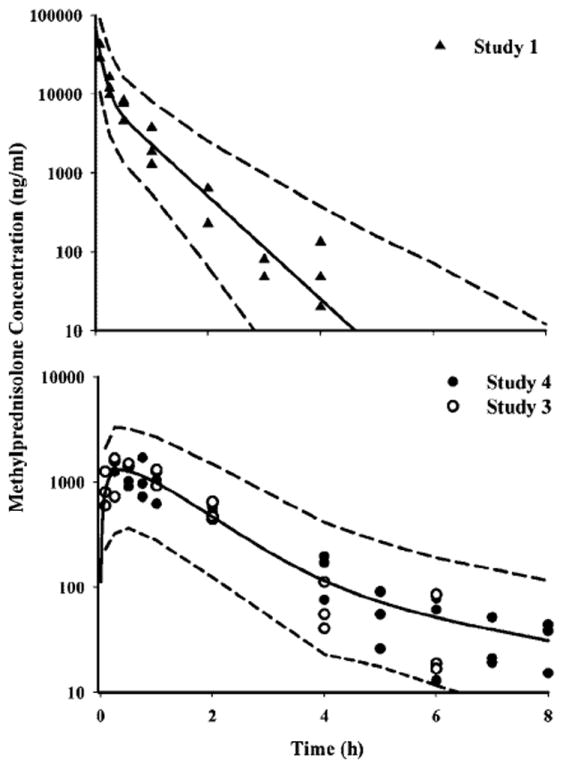
Pharmacokinetic profiles of MPL after i.v. (top panel) and i.m. (bottom panel) administration. Symbols depict the observed data, solid lines represent the mean predictions, and the dashed lines reflect the 95% CI of the predictions
Table 3.
Pharmacokinetic parameters from model fittings
| Parameters | Definition | Value | CV% |
|---|---|---|---|
| kel (h−1) | Elimination rate constant | 5.57 | 28.6 |
| Vc (ml/kg) | Central volume | 718.7 | 39.5 |
| k12 (h−1) | Distribution rate constant | 3.61 | 50.8 |
| k21 (h−1) | Distribution rate constant | 2.84 | 21.3 |
| ka1 (h−1) | Absorption rate constant | 1.255 | 23.2 |
| ka2 (h−1) | Absorption rate constant | 0.219 | 53.6 |
| F | Bioavailability | 0.214 | 16.4 |
| Fr | Fraction absorbed by ka1 | 0.725 | 11.3 |
| CLp (l/h/kg) | Clearance | 4.0 | 15.9 |
| Va1 (l/kg) | Injection site volume | 0.02 | 30.6 |
| Va2 (l/kg) | Injection site volume | 0.68 | 73.6 |
The concentrations of MPL at the injection site over time are shown in Figure 4 along with the mean and 95% CI of the model predictions. These concentrations (μg/ml range) are much higher than in plasma (ng/ml range) over the 6 h period. Despite variability in the data, the model was able to capture the general trend of the data well. The estimated volume of distribution of MPL in the injection site adds up to approximately 0.70l/kg which is close to the reported water content (0.74–0.756l/kg) in rat muscle [23-25].
Figure 4.
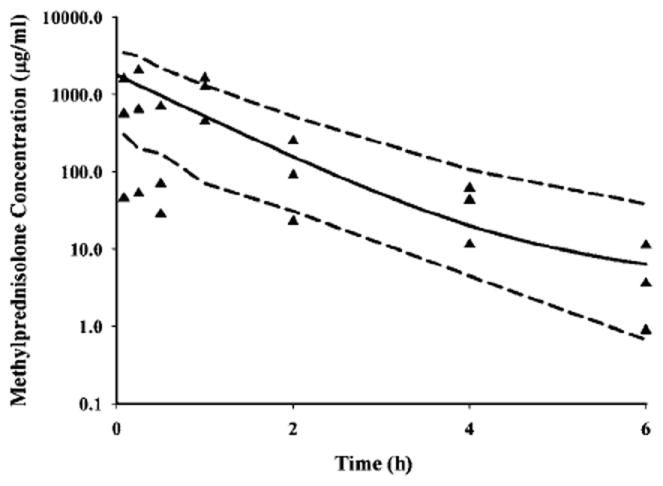
Pharmacokinetic profile of MPL in the injection site after 50 mg/kg dosing of MPL in normal rats. Symbols depict individual observed data from rats, solid line represents the mean predictions, and the dashed lines reflect the 95% CI of the predictions
Simulations of the mean ± 95% CI of the model predictions after i.v. and i.m. administration of MPL are shown in Figure 5. Data from various studies described in this report as well as from the literature [7] are also shown in order to examine the predictability of our model. The initial MPL concentrations in the i.m. dosed group from Study 1 (serial sampling) were visibly higher than Studies 2 and 4 (destructive sampling) yielding a higher bioavailability by NCA in the first group; otherwise all data fell within the 95% CI of the model predictions.
Figure 5.
Simulated (based on model in Figure 1) pharmacokinetic profiles of MPL after i.v. (● Study 1-normal, Δ Study 1-ADX, □ data from Sun et al. [19]) and i.m. (Δ Study 1-normal, ▲ Study 1-ADX, ■ Study 2, ● Study 4) administration. Symbols depict the observed data ± SD, solid lines represent the mean prediction and the dashed lines reflect the 95% CI of 51 the predictions
Tyrosine aminotransferase dynamics
Hepatic TAT mRNA and activity dynamics after i.v. and i.m. administration of 50 mg/kg MPL are shown in Figure 6. The i.v. profiles were from a previously published report [6]. Regardless of the route of MPL administration, TAT mRNA and activity showed marked increases. TAT mRNA started to increase at 4 h post-dosing with a peak at 6 h and returned to the baseline by 12 h in both cases. TAT activity dynamics after i.m. dosing showed a somewhat delayed onset and a prolonged effect compared with i.v. dosing. In both cases TAT activity returned to the baseline by 18 h.
Figure 6.
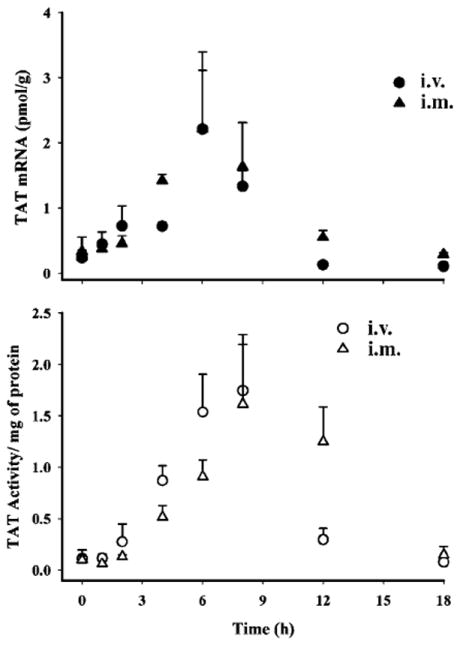
Pharmacodynamics of tyrosine aminotransferase mRNA (top panel) and activity (bottom panel) in ADX rats after i.v. or i.m. administration of 50 mg/kg MPL. Symbols depict the observed data ± SD
The areas under the effect curves (Table 4) for TAT mRNA and activity were calculated by Bailer’s method to assess the difference in net response between the i.v. and i.m. groups. Since destructive sampling is usually performed for all of our pharmacodynamic studies, the samples are considered sparse. Bailer’s method [21] represents an appropriate technique when such sampling is done and data are available for multiple subjects at various time points. On the other hand, the Bailer-Satterthwaite method [22] is an extension which provides estimation of variances in this type of study design. The latter method was used to determine the degrees of freedom for each group in this study.
Table 4.
Area under the curve analysis for TAT dynamics
For TAT mRNA, the AUEC for the i.m. group (10.22 ± 0.97 pmol/g h; p <0.01) was significantly greater than the i.v. group (7.39 ± 0.77 pmol/g h). For TAT activity, the AUEC value after i.m. (9.06 ± 0.91 ΔA/mg protein h) was slightly higher (not statistically significant) than the i.v. group (7.70 ± 0.72 ΔA/mg protein h). Despite the apparent incomplete bioavailability of the drug following i.m. dosing the net overall responses from both routes were comparable.
Discussion
One of the complexities in examining normal rats as animal models to characterize CS genomic effects is the presence of endogenous CST. A parenteral route other than i.v. was needed to avoid surgery-induced stress. Intramuscular injection was our primary choice since it is a commonly used route of dosing, and it shows almost complete bioavailability of MPL (with phosphate or succinate prodrug administration) in humans [26,27]. In addition, studies in rats with other CS, e.g. dexamethasone, showed high bioavailability (86%) via this route [8].
Although the PK of MPL has been well characterized in rats after i.v. injection [6,7,12-14], not much information is available for rats after i.m. dosing. Thus the objectives of this study were to determine the absorption kinetics from the injection site and i.m. bioavailability of MPL in order to assess influences on pharmacodynamics.
Most of the parenteral corticosteroids are formulated as water-soluble prodrugs due to their poor solubility in water. Upon entry into the body, the prodrug should undergo rapid and complete hydrolysis by enzymes. However, the use of these prodrugs may have an analytical issue associated with ex vivo hydrolysis after sample collection resulting in overestimation of CS concentrations at early time points. This issue was resolved for dexamethasone phosphate by use of EDTA as an anticoagulant [28] due to its chelating property for metal ions required by the enzymes as cofactors. However, the issue of instability is more complicated for the MPL-sodium succinate prodrug (provided as a lyophilized powder) especially when given to rats for two reasons. First, this prodrug not only undergoes enzymatic hydrolysis by carboxylesterases [13,29] but is also subject to chemical hydrolysis in solution [30,31]. Second, the bioavailability of MPL from MPL-succinate is incomplete in rats (10% compared with 80–90% in humans), thereby increasing the chance of ex vivo hydrolysis [13]. The measures taken to minimize possible ex vivo hydrolysis of MPL-succinate were: (1) use of EDTA as an anticoagulant when collecting blood, (2) rapid centrifugation of blood after collection at 4°C, (3) storage of plasma and muscle samples at −20°C and −80°C, (4) avoidance of repeated freeze-thaw cycles, and (5) use of cold temperature (4°C) prior to drug extraction into methylene chloride for measurement by HPLC.
Methylprednisolone PK profiles following i.v. administration were similar in normal and ADX rats with a terminal half-life life of 20–30 min, which agrees with previous reports [6,7,12,13]. Despite undergoing reversible metabolism (active methylprednisolone ↔ inactive methylprednisone) and dose-dependent changes in clearance [12,13], the PK of MPL at a 50mg/kg i.v. dose as well as i.m. dosing could be captured with a two-compartmental linear mammillary model. To describe the absorption kinetics from the injection site, two different rate constants yielded superior fitting results compared with a single rate constant based on usual model fitting criteria. Since MPL-succinate is much more hydrophilic than MPL, the faster absorption pathway may be attributed to the direct entry of the prodrug into the circulation through the intercellular aqueous media which subsequently is hydrolysed by carboxylesterases in the blood. On the other hand, the slower absorption pathway may be due to the passage of MPL (hydrolysed by enzymes in the muscle) through the transcellular pathway [10,32].
Unlike in humans [26,27], the bioavailability of MPL via i.m. dosing in rats is incomplete (less than 50%). More surprisingly, dexamethasone, a related compound, showed relatively simpler kinetics with i.m. injection [8]. Similar properties were observed in a study where a series of β-blockers were given i.m. to pigs. The extent of release was postulated to be dependent on the relative lipophilicity of the compounds. The more lipophilic the compound, the lower was the bioavailability (50% for more lipophilic alprenolol compared with 100% for atenolol) within the observed time period [33]. Interestingly the log P value for MPL (1.82) was slightly higher than log P for DEX (1.72) [34], which may partially contribute to a higher affinity of MPL to the muscle site. The duration of sampling (last observation) and the assay sensitivity influence the calculation of bioavailability after i.m. dosing. The length of the experiment which was only until 6 h (designed based on the half-life from i.v. dosing) may simply result in mono- or bi-exponential release kinetics as opposed to a poly-exponential one, which may represent the true situation. Other factors such as molecular size, pKa, initial drug concentrations, and injection site and depth also govern the release compounds from i.m. injection sites [10,33].
Most of our studies involve ‘giant rat’ experiments with killing groups of animals to obtain serial blood and tissue samples. In these studies, one rat yields one data point. Measurements from all rats were pooled to obtain the complete time course of drug kinetics and dynamics. The PK modeling included data only from such studies (2 and 3). Although the PK properties should be the same irrespective of sampling strategy, it was apparent that the concentrations at the early time points in the rats from the destructive sampling group (Studies 2 and 4) were lower compared with the serial sampling group (Figure 5). Due to the use of anesthesia (to kill the rats for sampling blood and tissues) the physical activity in the former group was minimal compared with the latter group in which blood was collected via a jugular vein cannula allowing somewhat free movement of the rats. Physical activity may significantly affect both the absorption rate as well as the extent of absorption from injection sites [33,35,36]. Also, anesthesia can impair blood flow to the injection site, consequently reducing the extent of absorption of MPL from the muscle site at the early time points.
The bioavailability of MPL is probably not as low as generated in these calculations which assume linear disposition. Although not evident from these bi-exponential i.v. profiles, MPL exhibits nonlinear PK when examined over a wider range of doses [12]. Either accounting for the nonlinear disposition or using an i.v. infusion to match the absorption process is needed to obtain better estimates of the fraction absorbed [37].
Since it is difficult to obtain the entire gluteus muscle from the injection site, only portions of the muscle were used to obtain the muscle MPL concentrations. Thus recovery of drug from the absorption site may be incomplete. Although simultaneous fittings of MPL concentrations from both plasma and injection sites would be ideal, variability of the estimated parameters mandated a piece-wise fitting approach, i.e. modeling of the plasma data from i.v. and i.m. groups, followed by modeling of the injection site concentrations.
Because of the low i.m. bioavailability, it was questionable whether it is indeed an appropriate route for study of MPL PK/PD in rats. Therefore we opted to examine the effect of this low bioavailability on the dynamics of a biomarker of CS, hepatic tyrosine aminotransferase. ADX rats were studied in order to avoid the interference of endogenous CST and for direct comparison with published i.v. data in ADX rats. Both the simulations based on pharmacodynamic parameters from our fifth-generation model of CS [5,14] (results not shown) as well as experimental results (Figure 6 and Table 4) showed comparable effects of i.v. and i.m. MPL on TAT at mRNA and activity. Although MPL PK after i.m. and i.v. dosing were dissimilar in several respects, both routes of administration produced similar pharmacodynamic effects. Therefore, the more convenient and less stress-inducing i.m. route can be used in studies on normal animals to assess pharmacodynamics.
References
- 1.Belvisi MG, Brown TJ, Wicks S, Foster ML. New glucocorticosteroids with an improved therapeutic ratio? Pulm Pharmacol Ther. 2001;14:221–227. doi: 10.1006/pupt.2001.0284. [DOI] [PubMed] [Google Scholar]
- 2.Schacke H, Docke WD, Asadullah K. Mechanisms involved in the side effects of glucocorticoids. Pharmacol Ther. 2002;96:23–43. doi: 10.1016/s0163-7258(02)00297-8. [DOI] [PubMed] [Google Scholar]
- 3.Boudinot FD, D’Ambrosio R, Jusko WJ. Receptor- mediated pharmacodynamics of prednisolone in the rat. J Pharmacokinet Biopharm. 1986;14:469–493. doi: 10.1007/BF01059656. [DOI] [PubMed] [Google Scholar]
- 4.Haughey DB, Jusko WJ. Receptor-mediated methylprednisolone pharmacodynamics in rats: steroid-induced receptor down-regulation. J Pharmacokinet Biopharm. 1992;20:333–355. doi: 10.1007/BF01062462. [DOI] [PubMed] [Google Scholar]
- 5.Ramakrishnan R, DuBois DC, Almon RR, Pyszczynski NA, Jusko WJ. Fifth-generation model for corticosteroid pharmacodynamics: application to steady-state receptor down-regulation and enzyme induction patterns during seven-day continuous infusion of methylprednisolone in rats. J Pharmacokinet Pharmacodyn. 2002;29:1–24. doi: 10.1023/a:1015765201129. [DOI] [PMC free article] [PubMed] [Google Scholar]
- 6.Sun YN, DuBois DC, Almon RR, Jusko WJ. Fourth-generation model for corticosteroid pharmacodynamics: a model for methylprednisolone effects on receptor/gene-mediated glucocorticoid receptor down-regulation and tyrosine aminotransferase induction in rat liver. J Pharmacokinet Biopharm. 1998;26:289–317. doi: 10.1023/a:1023233409550. [DOI] [PubMed] [Google Scholar]
- 7.Sun YN, DuBois DC, Almon RR, Pyszczynski NA, Jusko WJ. Dose-dependence and repeated-dose studies for receptor/gene-mediated pharmacodynamics of methylprednisolone on glucocorticoid receptor down-regulation and tyrosine aminotransferase induction in rat liver. J Pharmacokinet Biopharm. 1998;26:619–648. doi: 10.1023/a:1020746822634. [DOI] [PubMed] [Google Scholar]
- 8.Samtani MN, Jusko WJ. Comparison of dexamethasone pharmacokinetics in female rats after intravenous and intramuscular administration. Biopharm Drug Dispos. 2005;26:85–91. doi: 10.1002/bdd.435. [DOI] [PMC free article] [PubMed] [Google Scholar]
- 9.Lukas G, Brindle SD, Greengard P. The route of absorption of intraperitoneally administered compounds. J Pharmacol Exp Ther. 1971;178:562–564. [PubMed] [Google Scholar]
- 10.Zuidema J, Kadir F, Titulaer HAC, Oussoren C. Release and absorption rates of intramuscularly and subcutaneously injected pharmaceuticals (II) Int J Pharm. 1994;105:189. [Google Scholar]
- 11.Almon RR, Dubois DC, Jin JY, Jusko WJ. Pharmacogenomic responses of rat liver to methylprednisolone: an approach to mining a rich microarray time series. AAPS J. 2005;7:E156–E194. doi: 10.1208/aapsj070117. [DOI] [PMC free article] [PubMed] [Google Scholar]
- 12.Haughey DB, Jusko WJ. Bioavailability and nonlinear disposition of methylprednisolone and methylprednisone in the rat. J Pharm Sci. 1992;81:117–121. doi: 10.1002/jps.2600810203. [DOI] [PubMed] [Google Scholar]
- 13.Kong AN, Jusko WJ. Disposition of methylprednisolone and its sodium succinate prodrug in vivo and in perfused liver of rats: nonlinear and sequential first-pass elimination. J Pharm Sci. 1991;80:409–115. doi: 10.1002/jps.2600800502. [DOI] [PubMed] [Google Scholar]
- 14.Ramakrishnan R, DuBois DC, Almon RR, Pyszczynski NA, Jusko WJ. Pharmacodynamics and pharmacogenomics of methylprednisolone during 7-day infusions in rats. J Pharmacol Exp Ther. 2002;300:245–256. doi: 10.1124/jpet.300.1.245. [DOI] [PubMed] [Google Scholar]
- 15.Haughey DB, Jusko WJ. Analysis of methylprednisolone, methylprednisone and corticosterone for assessment of methylprednisolone disposition in the rat. J Chromatogr. 1988;430:241–248. doi: 10.1016/s0378-4347(00)83159-x. [DOI] [PubMed] [Google Scholar]
- 16.Samtani MN, Pyszczynski NA, Dubois DC, Almon RR, Jusko WJ. Modeling glucocorticoid-mediated fetal lung maturation: II. Temporal patterns of gene expression in fetal rat lung. J Pharmacol Exp Ther. 2006;317:127–138. doi: 10.1124/jpet.105.095869. [DOI] [PubMed] [Google Scholar]
- 17.Yao Z, DuBois DC, Almon RR, Jusko WJ. Modeling circadian rhythms of glucocorticoid receptor and glutamine synthetase expression in rat skeletal muscle. Pharm Res. 2006;23:670–679. doi: 10.1007/s11095-005-9608-3. [DOI] [PMC free article] [PubMed] [Google Scholar]
- 18.Diamondstone T. Assay of tyrosine aminotransferase by conversion of p-hydroxyphenylpyruvate to p-hydroxybenzaldehyde. Anal Biochem. 1966;16:395–401. [Google Scholar]
- 19.Lowry OH, Rosebrough NJ, Farr AL, Randall RJ. Protein measurement with the Folin phenol reagent. J Biol Chem. 1951;193:265–275. [PubMed] [Google Scholar]
- 20.D’Argenio DZ, Schumitzky A. ADAPT II User’s Guide: Pharmacokinetic/pharmacodynamic Systems Analysis Software. Biomedical Simulations Resource; LA: 1997. [Google Scholar]
- 21.Bailer AJ. Testing for the equality of area under the curves when using destructive measurement techniques. J Pharmacokinet Biopharm. 1988;16:303–309. doi: 10.1007/BF01062139. [DOI] [PubMed] [Google Scholar]
- 22.Nedelman JR, Gibiansky E, Lau DT. Applying Bailer’s method for AUC confidence intervals to sparse sampling. Pharm Res. 1995;12:124–128. doi: 10.1023/a:1016255124336. [DOI] [PubMed] [Google Scholar]
- 23.Poulin P, Theil FP. A priori prediction of tissue: plasma partition coefficients of drugs to facilitate the use of physiologically-based pharmacokinetic models in drug discovery. J Pharm Sci. 2000;89:16–35. doi: 10.1002/(SICI)1520-6017(200001)89:1<16::AID-JPS3>3.0.CO;2-E. [DOI] [PubMed] [Google Scholar]
- 24.Poulin P, Theil FP. Prediction of pharmacokinetics prior to in vivo studies. 1. Mechanism-based prediction of volume of distribution. J Pharm Sci. 2002;91:129–156. doi: 10.1002/jps.10005. [DOI] [PubMed] [Google Scholar]
- 25.Reinoso RF, Telfer BA, Rowland M. Tissue water content in rats measured by desiccation. J Pharmacol Toxicol Methods. 1997;38:87–92. doi: 10.1016/s1056-8719(97)00053-1. [DOI] [PubMed] [Google Scholar]
- 26.Antal EJ, Wright CE, III, Gillespie WR, Albert KS. Influence of route of administration on the pharmacokinetics of methylprednisolone. J Pharmacokinet Biopharm. 1983;11:561–576. doi: 10.1007/BF01059057. [DOI] [PubMed] [Google Scholar]
- 27.Daley-Yates PT, Gregory AJ, Brooks CD. Pharmacokinetic and pharmacodynamic assessment of bioavailability for two prodrugs of methylprednisolone. Br J Clin Pharmacol. 1997;43:593–601. doi: 10.1046/j.1365-2125.1997.00598.x. [DOI] [PMC free article] [PubMed] [Google Scholar]
- 28.Samtani MN, Jusko WJ. Stability of dexamethasone sodium phosphate in rat plasma. Int J Pharm. 2005;301:262–266. doi: 10.1016/j.ijpharm.2005.06.003. [DOI] [PMC free article] [PubMed] [Google Scholar]
- 29.Hattori K, Kamio M, Nakajima E, Oshima T, Satoh T, Kitagawa H. Characterization of steroid hormone ester hydrolyzing enzymes in liver microsomes. Biochem Pharmacol. 1981;30:2051–2056. doi: 10.1016/0006-2952(81)90222-7. [DOI] [PubMed] [Google Scholar]
- 30.Anderson BD, Conradi RA, Spilman CH, Forbes AD. Strategies in the design of solution-stable, water-soluble prodrugs III: influence of the pro-moiety on the bioconversion of 21-esters of corticosteroids. J Pharm Sci. 1985;74:382–387. doi: 10.1002/jps.2600740404. [DOI] [PubMed] [Google Scholar]
- 31.Anderson BD, Taphouse V. Initial rate studies of hydrolysis and acyl migration in methylprednisolone 21-hemisuccinate and 17-hemisuccinate. J Pharm Sci. 1981;70:181–186. doi: 10.1002/jps.2600700217. [DOI] [PubMed] [Google Scholar]
- 32.Zuidema J, Pieters FAJM, Duchateau GSMJE. Release and absorption rate aspects of intramuscularly injected pharmaceuticals. Int J Pharm. 1988;47:1. [Google Scholar]
- 33.Kadir F, Zuidema J, Pijpers A, Vulto A, Verheijden JHM. Drug lipophilicity and release pattern of some [beta]-blocking agents after intra-adipose injection in pigs. Int J Pharm. 1990;64:171. [Google Scholar]
- 34.Mager DE, Jusko WJ. Quantitative structure-pharmacokinetic/pharmacodynamic relationships of corticosteroids in man. J Pharm Sci. 2002;91:2441–2451. doi: 10.1002/jps.10231. [DOI] [PubMed] [Google Scholar]
- 35.Evans EF, Proctor JD, Fratkin MJ, Velandia J, Wasserman AJ. Blood flow in muscle groups and drug absorption. Clin Pharmacol Ther. 1975;17:44–47. doi: 10.1002/cpt197517144. [DOI] [PubMed] [Google Scholar]
- 36.Mundie TG, Pamplin CL, III, Phillips YY, Smallridge RC. Effect of exercise in sheep on the absorption of intramuscular atropine sulfate. Pharmacology. 1988;37:132–136. doi: 10.1159/000138456. [DOI] [PubMed] [Google Scholar]
- 37.Jusko WJ, Koup JR, Alvan G. Nonlinear assessment of phenytoin bioavailability. J Pharmacokinet Biopharm. 1976;4:327–336. doi: 10.1007/BF01063122. [DOI] [PubMed] [Google Scholar]