

Short abstract
Study objectives were to develop, validate, and apply a method to measure three-dimensional (3D) internal strains in intact human discs under axial compression. A custom-built loading device applied compression and permitted load-relaxation outside of the magnet while also maintaining compression and hydration during imaging. Strain was measured through registration of 300 μm isotropic resolution images. Excellent registration accuracy was achieved, with 94% and 65% overlap of disc volume and lamellae compared to manual segmentation, and an average Hausdorff, a measure of distance error, of 0.03 and 0.12 mm for disc volume and lamellae boundaries, respectively. Strain maps enabled qualitative visualization and quantitative regional annulus fibrosus (AF) strain analysis. Axial and circumferential strains were highest in the lateral AF and lowest in the anterior and posterior AF. Radial strains were lowest in the lateral AF, but highly variable. Overall, this study provided new methods that will be valuable in the design and evaluation surgical procedures and therapeutic interventions.
Keywords: intervertebral disc, biomechanics, internal strain, axial compression, magnetic resonance imaging, annulus fibrosus, image registration
Introduction
The intervertebral disc functions to permit motion, distribute load, and dissipate energy in the spine. It performs these functions through its highly heterogeneous structural organization and biochemical composition consisting of several tissue substructures: the central gelatinous nucleus pulposus (NP), the surrounding fiber-reinforced layered AF, and the cartilaginous endplates that are positioned between the NP and vertebral endplates [1]. Disruption of any of the disc's tissues through aging, degeneration, or injury will not only alter the affected tissue mechanical properties but also the mechanical behavior of adjacent tissues and, ultimately, the overall disc segment function. Thus, there is a need to measure disc tissue and segment mechanics in the intact disc segment so that interactions between tissue structures are not disrupted. Such measurements would be valuable to study mechanisms of disc function and of disc degeneration, to design functional tissue engineered discs, and to develop and evaluate surgical procedures and therapeutic implants.
Disc mechanical behavior has been quantified through a number of measures including external displacements [2–5] and internal pressure [6–9]; however, these do not fully establish internal tissue mechanics. Internal disc mechanics have also been measured through marker insertion or disc bisection [10–14]. These studies have provided important data about disc mechanical function and how it changes with degeneration. Yet the disc is composed of soft hydrated, pressurized, and fibrous tissues that may deform separately from the inserted markers and may depressurize when bisected. Thus, it has remained a challenge to quantify internal disc mechanics.
Magnetic resonance imaging (MRI) before and after an applied load, combined with image registration, is a promising method to quantify internal disc mechanics. Important advances have been made using MRI to measure internal disc deformation in a 2D plane [15–19]. Strains within several AF regions (e.g., anterior, posterior, and lateral) were measured under applied axial compression, and the effect of loading position, degeneration, and nucleotomy was determined [16–18], demonstrating inhomogeneous strains across AF regions and differential effects of nucleotomy that depend on the initial state of degeneration [16–18]. A nonrigid image registration method was employed by [19] to calculate midsagittal strain after creep loading. Displacement encoded MRI, an image tagging method that enables direct displacement measurements from MRI data, was used in Ref. [15] to calculate strain across the entire disc under cyclic loading. While these are important advances, the 2D nature of recent MRI-based studies do not account for out-of-plane deformation nor provide the 3D strain components that are key to evaluating disc mechanical function.
The objectives of this study were to develop, validate, and apply a method to measure 3D internal deformations in intact human discs subjected to axial compression. This was achieved by using a custom-built loading device that permitted long relaxation times outside of the MRI scanner and maintained compression and hydration during imaging, by acquiring MR images at a high resolution (300 μm isotropic), and by applying state-of-the-art image registration methods.
Methods
Specimen Preparation.
Human lumbar spines were procured, thawed, and scanned intact in a 3T whole-body MRI scanner (Trio, Siemens Medical Solutions) using the spine array RF coil. To assess degenerative grade, a T2-weighted midsagittal image was acquired [20] and to determine the NP T2 relaxation time, a T2-mapping sequence was used [21–23]. To minimize anatomical and degenerative variability, grade 3 [20] L4-L5 discs were selected (n = 9), resulting in an average age of 57 ± 12 yr, an average NP T2 relaxation time of 88.1 ± 16.6 ms, and an even gender distribution (5 females and 4 males). The L4-L5 lumbar spine was then dissected into a bone–disc–bone segment, the posterior elements removed, and the vertebral bodies potted in polymethyl methacrylate bone cement. Each sample was hydrated in a refrigerated phosphate-buffered saline (PBS) bath overnight and equilibrated to room temperature prior to testing.
Mechanical Loading and Image Acquisition.
A custom-built nonmagnetic loading frame (Fig. 1(a)) was constructed to interface with an Instron 8874 for load application. The loading frame incorporated locking bolts to maintain axial compression applied using the Instron, a sliding tank to maintain hydration and was designed to integrate with a two-piece RF coil (Helmholtz transmit, curved 4-channel receive array) [24] in a 7T whole-body MRI scanner (Magnetom, Siemens Medical Solutions) (Fig. 1(b)). The loading frame was fabricated using polyvinyl chloride and Delrin plastics. A cylindrical sliding tank (diameter = 7.87 cm) made of acrylic held the disc and grips and allowed easy replacement of the PBS fluid (used while in the Instron) with 2% agarose gel (used while in the MRI scanner). The agarose gel maintained hydration during imaging and prevented image distortion at tissue edges due to the tissue–air mismatch in magnetic susceptibility [25]. The disc–agarose unit was covered in plastic wrap throughout imaging to prevent dehydration. Sufficient space was maintained between the sliding tank and the outer walls of the frame in order for the RF coil array to be placed between them in the scanner and ports for wires were made within the outer frame walls (Fig. 1(b)).
Fig. 1.
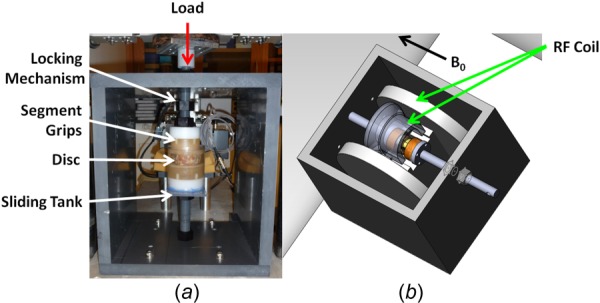
(a) Loading frame interfaced with Instron (red arrow), showing locking mechanism, segment grips, disc, and sliding tank (white arrows). (b) Loading frame integrated with RF coil (green arrows) in MRI. B 0 = direction of magnetic field.
Mechanical loading followed by MR image acquisition was performed under four conditions: reference (50 N preload), 5%, 10%, and 15% applied grip–grip compressive strain, as follows. The sample was placed in a PBS bath within the loading frame and installed in the Instron, which was used for load application. For the reference condition, a 50 N preload was applied to ensure contact of the loading fixtures and held for 20 min, after which locking bolts were tightened to secure the position. The sample + frame then was removed from the Instron, and the PBS was removed and replaced with agarose.
The sample + frame was then placed in the 7T MRI scanner and the 4-channel RF coil array placed to wrap around the sample (Fig. 1(b)). High-resolution (300 μm isotropic) MR images were acquired with a T2-weighted 3D turbo spin echo sequence (TR/TE = 3000/34 ms, matrix = 256 × 256 × 32, turbo factor = 7, fat suppression). Scan time was 2.8 h per disc per load.
After acquisition of the preload images, the agarose was replaced with PBS and the sample + frame was returned to the Instron. The Instron crosshead was returned to the preload position and the locking bolts were then loosened. A 5% grip–grip compressive strain, based on midsagittal disc height, was applied at a slow rate of 0.1 mm/s [2] and held for 2.5 h of load-relaxation within the Instron. Average disc height was calculated by dividing the midsagittal disc space area by the anterior–posterior width from the preloaded reference image as previously described [26]. The position was again locked, PBS was replaced with agarose, and the sample + frame was returned to the MRI scanner for imaging under the loaded condition using the same imaging parameters as for the preload condition. These steps were repeated for 10% and 15% applied strain, always returning the Instron to the final displacement position of the previously applied load.
Image Processing and Registration.
Image processing was performed prior to image registration. First, bone–disc–bone segmentations were generated for all images by masking out nonessential regions in the images, including agarose, surrounding musculature, and most of the vertebral body. Because the imaging sequence was not optimized for bone contrast, deformation and strain analysis were not performed within the bone regions. This segmentation for each image set was performed using the 3D image edge-based snake tool in ITK-SNAP [27], followed by manual correction of missed regions and sections that bled into the disc space. Second, to aid the alignment of similar features during registration, each image set was normalized to its maximum intensity value and the image sets were then histogram-matched. A representative resultant image set for a disc in the axial, coronal, and sagittal planes is shown in Fig. 2(a).
Fig. 2.
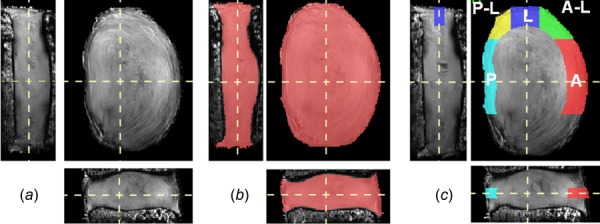
Images ((a)–(c)) are oriented to show coronal (left), axial (top-right), and sagittal (bottom) planes. (a) Representative MRI data set. (b) The volume used for strain analysis (pink). (c) AF regions of interest defined in the midaxial plane: A = anterior (red), A–L = anterior–lateral (green), L = lateral (blue), P–L = posterior–lateral (yellow), P = posterior (aqua).
Registration between reference (preload) and deformed (5%, 10%, and 15% compression) disc image sets was performed with advanced normalization tools (ANTs) [28–31]. The resultant registration defines a warp field (Fig. 3), which prescribes how the reference image transforms into the deformed image, and consequently, the inverse warp field prescribes how the deformed image transforms into the reference image. Applying the warp field to the reference image creates a transformed–deformed image that appears identical to the deformed image; this approach can be applied in reverse using the inverse warp field. Lagrangian strain components were derived directly from the computed transformations [32–34]. ANTs performance has been validated in human brain MRI registration [35] and lung mapping [36], achieving top ranking in open competitions.
Fig. 3.
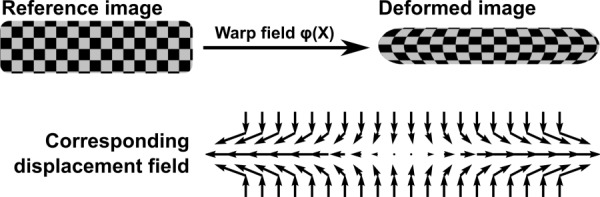
Pictorial representation of the image registration process, resultant warp field, and displacement map. The reference image is registered to the deformed image defining a warp field that prescribes how structures within the reference image are mapped to the deformed image. The deformation gradient tensor is applied to calculate the Lagrangian strain tensor.
The procedure for using ANTs was as follows. An initial affine registration was applied which accounts for rigid body motion. A nonrigid registration was then performed using a symmetric diffeomorphic transformation model [28]. This transformation model was selected because it is invertible and is able to preserve topology and local neighborhood relations. Mean squared difference (MSQ) was employed as the similarity metric in the registration because of monomodality and strong pixel intensity resemblance between the reference and deformed images. This metric performs the sum of the squared differences between corresponding intensity values between the reference (I 1) and deformed (I 2) image (Eq. (1)) such that φ is the iteratively updated warp field. To account for outliers, the MSQ equation was clipped by treating the equation linearly for intensity differences between the reference and deformed image that were greater than 0.01
| (1) |
A directly manipulated free-form deformation (DMFFD) regularization technique was utilized based on prior successful experience with its use in MR images [29–31]. Preliminary experiments yielded 6 × 6 × 6 as the ideal number of splines for DMFFD regularization based on overlap statistics.
Registration Validation.
Registration was validated with three different assessments: disc volume, lamellar structure, and axial strain. Disc volume and lamellar structure were evaluated using standard statistical assessment methods [35]. Disc volume validation was performed to assess gross morphology, ensuring registrations captured volumetric changes between the reference and deformed images. Lamellar structure validation was performed to verify registrations tracked internal AF displacements. Finally, axial strain validation was performed to verify the strains calculated from the registration were as expected.
Disc volume and lamellar structure registration validation was performed by first identifying and labeling the matched features that are present in both the reference and deformed images—these labels are assumed to be the gold standard against which the registration is compared. Labeling these features entails manual segmentation using ITK-SNAP [27]. Labeling is highly labor intensive, therefore, for these assessments a subset of samples was used for registration validation (n = 3). For disc volume, a label image representing the entire disc was created by manually removing all pixels containing bone from each image set. For lamellar structure, labels representing the boundaries between adjacent AF lamellae were identified in 3D. Sobel edge detection was performed in 3D with a custom matlab script to first identify AF boundaries (Fig. 4(a)). These boundaries were then used to guide the identification of matched labels in the reference and deformed image sets (Figs. 4(b) and 4(c)). Five lamellar labels were identified around the circumference of each disc.
Fig. 4.
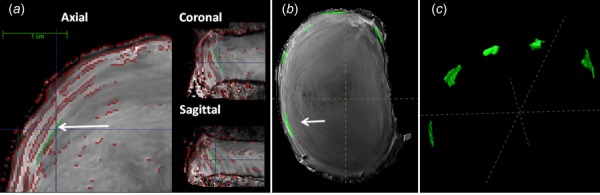
(a) Generation of lamellar structure labels using Sobel edge detection (red), shown in three planes. A representative label is shown in green. (b) and (c) Five identified lamellar labels, shown in midaxial view and as 3D projections, respectively. Labels identified by white arrows.
Once the five lamellar labels were identified in the reference and deformed images (5%, 10%, and 15% compression), the inverse warp field was applied to the deformed image labels to reconstruct the labels in the reference image. The reconstructed reference labels were then overlaid on the original reference labels to assess overlap statistics. Disc volume and lamellar structure were statistically evaluated for target overlap and average Hausdorff [35]. Target overlap is the amount of overlap between the two images, where 100% represents a perfect registration. Average Hausdorff is the average pixel distance between matching label pixel boundaries, converted to length using 1 pixel = 300 μm image resolution, where 0 μm average Hausdorff represents a perfect registration. For disc volume, nine comparisons were made, three compression levels (5%, 10%, and 15%) across three samples. For lamellar structure, 45 comparisons were made, five labels per disc at three compression levels across three samples.
Finally, the axial strain was validated using all samples (n = 9). Axial strain within the entire AF was averaged from the registration at each applied compression level. Manual segmentation of change in disc height was used to determine the axial strain for comparison to the axial strain from registration. The disc height was manually segmented in the midsagittal and midcoronal planes in the reference and deformed images. Axial strain was calculated as the change in disc height between the reference and deformed image divided by the reference image disc height. For each sample, the axial strain was the average of the midsagittal and midcoronal strain. Comparison between the axial strain from the registration and manual segmentation was made using Pearson's correlation. Significance set at p ≤ 0.05 and a trend defined by 0.05 < p ≤ 0.10.
The resultant applied strain measured from midaxial disc was compared between groups, preload to 5%, 5–10%, and 10–15% compression. Difference between incremental strain groups was assessed by a one-way ANOVA with repeated measures and posthoc comparisons with Tukey's test. Significance sets at p ≤ 0.05 and a trend is defined by 0.05 < p ≤ 0.10.
Strain Analysis.
Strain was calculated on a voxel-by-voxel basis from the warp field, φ, as follows. The warp field prescribes how features are mapped from the reference (X) to deformed (x) configuration [32,34] in Eq. (2), where V is the displacement field
| (2) |
Next, the deformation gradient tensor (F) was calculated from the warp field φ(X) as
| (3) |
Finally, the Lagrangian strain tensor (E) was calculated from the deformation gradient tensor. All of these analyses are performed within the ANTs software package [32,34]. The Lagrangian strain tensor is initially calculated in the Cartesian coordinate system. These Cartesian strain components were then transformed into a local disc coordinate system and regional segmentation of the disc was performed, as described below.
To transform the Cartesian coordinate system, a local disc coordinate system was established based on the disc's outer contour (Fig. 5). The outer contour was defined by tracing the projection of the disc into the x–y plane and its origin defined as the disc's centroid. For each voxel, the contour was scaled to find a similar contour that intersected the voxel's (x, y) position. The local coordinate system (B) was defined by the circumferential basis vector (e θθ) defined by the contour's tangent, the local radial basis vector (err) was defined by the contour's normal, and the local axial basis vector (ezz) remained unchanged from the primary spine axis. The Cartesian strain tensor (E) at each voxel in the x–y plane was then transformed into disc specific strain tensor (E′) having components of circumferential strain (E θθ), radial strain (Err), and axial strain (Ezz) using the transformation equation
Fig. 5.
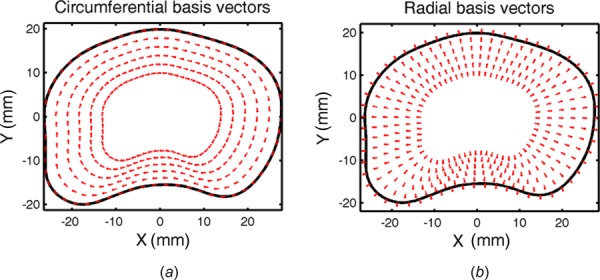
Transformation of Cartesian coordinates to local disc coordinates using the disc's outer contour, scaled to intersect each voxel: (a) circumferential basis vectors defined by the contour's tangent and (b) radial basis vectors defined by the contour's normal. Note the complex vector directions imposed by the lamellar curvature.
| (4) |
The disc was next segmented to establish volumes of interest for averaging local strains. First, to eliminate artifacts that occur in the registration at the bone–disc boundary [37], the disc area was removed by two pixels depth (0.6 mm) at the superior and inferior boundaries using the image erosion function in matlab maintaining the bone–disc boundary contour. Next, to remove any remaining strain outliers, the intersection of axial, circumferential, and radial strain values that were ±2 standard deviations from the mean were eliminated, providing the final segmented disc for strain analysis (Fig. 2(b)). Finally, the AF was defined by excluding regions where Sobel 3D edge detection did not locate lamellar edge boundaries. The AF segmentation outer boundary followed the outer disc contour and the AF inner boundary was defined by the inner most medially detected AF lamellar edge. To ensure no NP material fell within this segmentation, the NP region was defined to occupy 28% of the disc cross section, positioned at the disc's centroid with a 3% posterior translation, and mirrored the outer contour [26]. To achieve relatively homogenous strain regions, the midaxial height, defined as the middle third of the disc height after segmentation, represented the AF region of interest. The AF was then divided into anterior, anterior–lateral, lateral, posterior–lateral, and posterior [10] regions (Fig. 2(c)). The lateral region furthest from the RF coil was excluded because of reduced image contrast. Mean axial, circumferential, and radial disc strain values were calculated for each region at the midaxial disc height. Variance between regions was assessed by a one-way ANOVA and posthoc comparisons with Tukey's test for 5%, 10%, and 15% compression. Significance was set at p ≤ 0.05 and a trend defined by 0.05 < p ≤ 0.10.
Results
In this study, 3D image registration of the human intervertebral disc in axial compression loading was performed, the registration was validated, and then strain analysis in compression was performed. The high-resolution isotropic MR images provided excellent visualization of the AF lamellar architecture (Figs. 2, 4, and 6), features essential for successful registration.
Fig. 6.
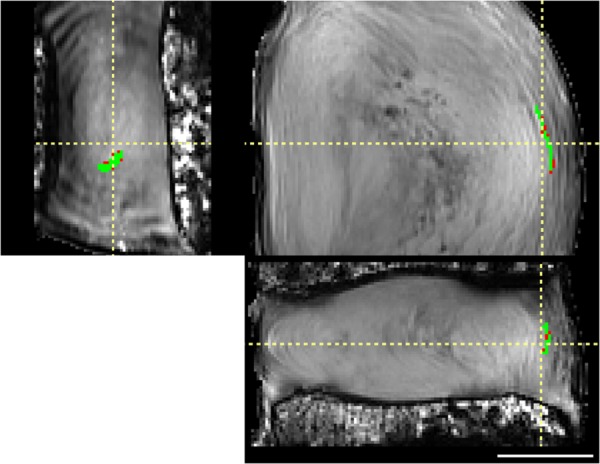
Registration of a representative lamellar label (green), shown in coronal (left), axial (top-right), and sagittal (bottom) views. Difference between original and registered label is small (red), demonstrating good registration. Scale bar = 1 cm.
Registration Validation.
Registration was validated with three different assessments: disc volume, lamellar structure, and axial strain. Disc volume and lamellar structure were statistically evaluated for target overlap and average Hausdorff. These are standard assessment methods and were compared against the previous successful registration of human brain [29]. The disc volume was registered with a target overlap of 94.4 ± 0.92%. This target overlap is similar to the best registration achieved in human whole brain of 95.8% [29]. The disc volume was registered with an average Hausdorff of 0.030 ± 0.006 mm. Excellent overlap was achieved internally between the original and reconstructed AF labels (Fig. 6). The lamellar structure was registered with a target overlap of 65.2 ± 12.4%. This target overlap is similar to the registration achieved in human brain subcortical structures of 66.9% [29]. The lamellar structure was registered with an average Hausdorff of 0.12 ± 0.06 mm.
The axial strain was validated by comparing the axial strain calculated by ANTs, averaged across the entire AF, to axial strain measured directly from the change in disc height on the MR images. This validated not only the registration methods but also the strain analysis calculations. There was a linear correlation between the axial strain from the registration and the manually measured strain (R 2 = 0.79, p < 0.001, Fig. 7). No statistical difference was found between each of the achieved strain increments: preload to 5%, 5–10%, and 10–15% compression (p = 0.34).
Fig. 7.
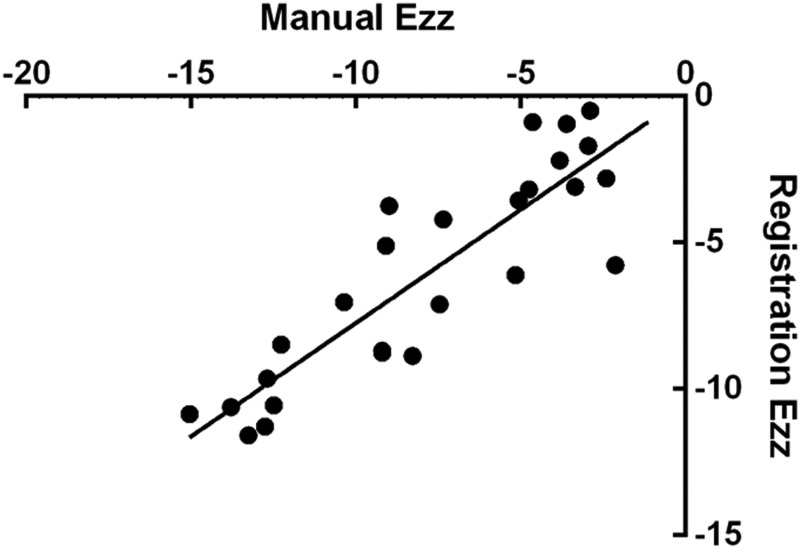
Axial strains for all discs obtained by manual measurement and by image registration, showing good agreement (R 2 = 0.79, p < 0.05).
Strain Analysis.
The three strain components under all applied axial compressions were qualitatively evaluated; a representative disc at 10% axial strain is shown in Fig. 8. Qualitative strain patterns described below were generally similar for all levels of applied strain across all discs. Axial strain (E zz) had horizontal banding throughout the disc, as shown in the coronal and sagittal views (Fig. 8(a)). Negative E zz strains predominated, although bands of tensile E zz strains occurred near the disc–endplate boundaries (Fig. 8(a)). Circumferential strain (E θθ) was near zero at the endplates (not shown) and had high positive strain values occurring in the posterior and lateral regions, as shown in the axial view (Fig. 8(b)). Radial strain (Err) decreased from the inner AF toward the periphery of the AF. The Err strains were positive in the inner AF regions and near zero at the AF outer boundary, as shown in the axial view (Fig. 8(c)).
Fig. 8.
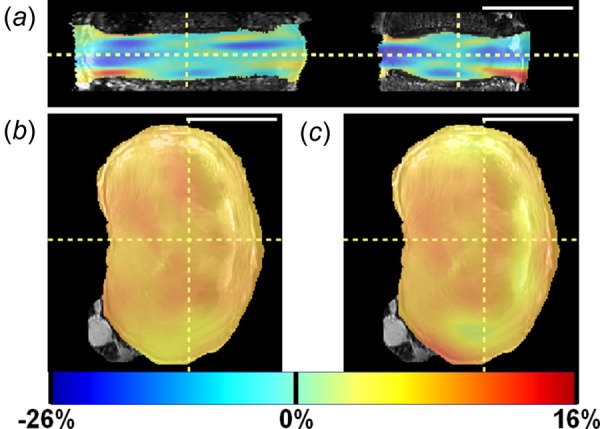
Strain maps for 10% axial compression in a representative disc: (a) axial strain in coronal and sagittal views (left and right, respectively); (b) circumferential strain in axial view; and (c) radial strain in axial view. Scale bar = 5 cm.
The peak and equilibrium stress increased with each applied strain increment (Table 1). The magnitude of the strain components, averaged across the entire AF, also increased with each applied increment (Table 1). The AF E zz did not match the applied grip–grip strain (Table 1); however, it did increase linearly with each strain increment (Fig. 7).
Table 1.
Mean ± standard deviation of stress and strain for each applied loading condition. Note that applied compression represents grip-to-grip applied strains that are compressive and that these compressive boundary conditions induce negative axial strain. AF = annulus fibrosus, Ezz = axial strain, Eθθ = circumferential strain, and Err = radial strain. Stress calculated as load divided by area from axial reference MR image. Strains averaged over entire AF volume for each disc. N = 9.
|
Applied compression |
|||
|---|---|---|---|
| 5% | 10% | 15% | |
| Peak compression stress (kPa) | 192 ± 29.1 | 307 ± 141 | 352 ± 222 |
| Equilibrium compression stress (kPa) | 40.0 ± 18.3 | 110 ± 15.0 | 174 ± 27.1 |
| AF Ezz | −3.30 ± 5.58% | −7.59 ± 6.31% | −13.17 ± 6.32% |
| AF Eθθ | 0.70 ± 1.02% | 1.23 ± 1.29% | 2.75 ± 2.07% |
| AF Err | 0.11 ± 1.86% | 0.96 ± 2.44% | 1.63 ± 2.93% |
Because the strains were expected to be inhomogeneous across the AF, separate AF regions were defined and strains averaged within these regions. To avoid boundary effects at the bone attachment, the middle third (Fig. 2(c)) of the disc was considered as “midaxial” with five AF regions delineated as: anterior (A), anterior–lateral (A–L), lateral (L), posterior-lateral (P–L), and posterior (P). Differences in strain across AF regions were evaluated for 15% applied axial compression (Fig. 9). Axial strain (E zz) was smallest in the anterior AF, significantly smaller compared to the lateral, posterior–lateral, and posterior AF (p < 0.03, Fig. 9(a)). Circumferential strain (E θθ) in the anterior–lateral AF was smaller than the posterior–lateral AF (p = 0.02, respectively, Fig. 9(b)). Radial strain (Err) was lowest in the lateral AF, significantly lower than the posterior–lateral and posterior AF (p < 0.04, Fig. 9(c)). In addition, the radial strain was highest in the posterior AF, higher than the anterior–lateral (p < 0.07) and lateral AF (p < 0.003, Fig. 9(c)).
Fig. 9.
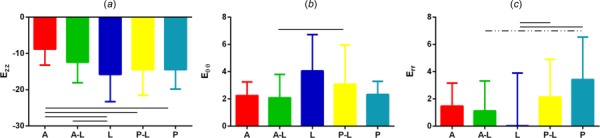
Mean and standard deviation of AF regional strain at midaxial height when loaded to 15% compression for (a) axial, (b) circumferential, and (c) radial strain. A = anterior, A–L = anterior–lateral, L = lateral, P–L = posterior–lateral, P = posterior. Region locations are shown in Fig. 2(c). A solid line represents significance at p < 0.05 and a dashed line trend at 0.05 < p < 0.10.
Discussion
In this study, a method to measure 3D internal deformations within intact human discs under axial compression was developed, validated, and applied. Important technical advances included a custom-built loading device that permitted long relaxation times outside of the MR scanner and maintained compression and hydration throughout imaging, a high-resolution 300 μm isotropic MR imaging sequence, and state-of-the-art image registration methods. There is a need to measure disc tissue and segment mechanics in the intact disc segment so that interactions between tissue structures are not disrupted. Such measurements established in this study are valuable to study mechanisms of disc function and of disc degeneration, to design functional tissue engineered discs, and to develop and evaluate surgical procedures and therapeutic interventions. In addition, finite element models used to study disc mechanics [38–41] have to date only performed model validation with respect to overall deformation at outer boundaries. The experimental internal strain data achieved in this study will be valuable to validate the internal strains predicted by finite element models.
The image registration was validated using both the disc volume and lamellar structure. Using standard statistical methods [35], both the disc volume and lamellar structure had very good accuracy, strongly supporting the validity of the registration and the reported strain results. There are no directly comparable image registrations, but work has been published on whole brain registrations [29]. The disc volume validation can be compared to the previous whole brain registration, where the disc target overlap was 94% and brain was 96% [29]. Similarly, the lamellar structure validation, representing internal registration of fine detail, can be compared to brain cortical features, which are also internal. In this case, lamellar structure target overlap was 65% while brain cortical was 67% [29]. It is likely that the apparently reduced accuracy inside the disc reflects the challenges and errors in visualizing and marking these internal anatomic features to create the labels. The use of 3D Sobel edge detection to locate the lamellar boundaries was helpful in identifying lamellar features. Although the 300 μm/pixel resolution achieved in this study is outstanding for disc MRI, identification of lamellar labels for validation was quite difficult given the 140–520 μm range of AF lamellar thickness [42]. Nonetheless, qualitative evaluation of overlap of lamellar labels shows excellent correspondence (Fig. 6) and quantitative validation matches the current standard in the field. Moreover, the implementation of overlap statistics on manual segmentations provides registration accuracy that is specific to the experimental conditions, a distinct advantage over utilizing MR phantoms [15] or computer generated deformations [19].
Qualitative observations of the strain patterns were made. Axial strain horizontal banding was apparent (Fig. 8(a)), similar to those observed in the 2D strain analysis by O'Connell et al. [16]. Large tensile axial strains were observed at the boundary of the AF and vertebral endplate (Fig. 8(a)), which was also consistent with the previous work [16,18]. The mechanism for axial tensile strain to occur when the disc is being compressed is not clear; however, we hypothesize that it may be related to tension in the AF fibers at their insertion to the vertebrae, and/or the curvature of the endplate. Notably, compressive axial strains that were greater than the applied strain magnitude were observed in some regions, particularly in the midaxial height region (Fig. 8(a)), which makes some intuitive sense, when there is axial tension at the endplates. Integration of the axial strain across the disc in the z-direction at any fixed radial and circumferential coordinate would yield the total displacement in the z-direction, which ideally would be the same throughout the disc if the endplates where flat. The mechanical and biological effects these strain patterns have on local matrix and cells are a subject of future interest.
Strain maps not only enable qualitative visualization of strain patterns but also enable quantitative regional AF strain analysis. In this study small regions of relatively homogenous tissue at the midaxial height were evaluated (Fig. 2(c)) and the strains under applied axial compression compared in regions around the disc (Fig. 9). Axial strain was lowest in the anterior AF (−8.8 ± 4.4%) and highest in the lateral AF (−15.8 ± 7.5%), Fig. 9(a). This is likely related to the larger disc height in the anterior region. Since strain can be estimated as change in height divided by the reference height, if the anterior region has a higher reference height, it follows it would have a smaller strain for the same applied deformation. Circumferential strain was lowest in the anterior and anterior–lateral regions (2.2 ± 1.4%) and highest in the lateral region (4.1 ± 2.7%). Geometrically, it is expected that circumferential “hoop” strain would be highest at the largest radial distance from the disc center, which is the lateral AF. Radial strain was lowest and on average zero in the lateral AF and highest in the posterior AF. The low average strain in the lateral AF also had a very high standard deviation, suggesting a large degree of strain inhomogeneity that may be related to the steeper curve around the AF contour at the lateral side. The higher radial strain in the posterior AF may be physiologically important for delamination and tears in the posterior regions of the disc and may have important implications in this area where AF failure and disc herniation often occur.
The axial stress associated with the applied compression strains were calculated (Table 1) and can be related to in vivo lumbar disc stresses measured in the NP with a pressure transducer [43]. The stress associated with the applied 5% compression is comparable to lying down, the 10% compression is comparable to the stress to lying prone with an extended back supported on elbows and sitting slouched in a chair, and the 15% compression is comparable to a large number of activities, including sitting down and relaxed standing [43]. Thus, the compressions applied in this study have physiological relevance. While this study was not designed to study disc stress-relaxation, we did observe a visco-elastic response (Table 1) consistent with the previous studies [44–46] which was expected, based on known nonlinear and viscoelastic disc mechanics [45,47–49].
An advantage of this study is that 3D image registration was performed. Prior 2D image correlation experiments [15–19] were designed to minimize out-of-plane deformations that could cause erroneous strains to be reported if the same tissue is not present in both the reference and deformed images. To check this, the strains in this study were compared to the previous 2D correlations [16]. Although different samples and slightly different protocols were used (the present study applied 5% compression, the previous study [16] applied 1000 N compression), both studies achieved very similar applied axial disc strains, E zz = −4.27 ± 1.48% and E zz = −4.4 ± 1.3% strain, respectively. Therefore, the AF strains computed in 3D and midsagittal 2D can be compared with some confidence. This finding was not unexpected since axial compression was applied in both studies. The average AF axial strains were E zz = −3.6% and −4.7% and the average AF radial strains were Err = 2.2% and 2.1% in the present 3D study and the previous 2D study [16], respectively. This is excellent correspondence given the differences in protocols, human sample variability, imaging and registration methods, and strain inhomogeneity. This observation provides confidence in both the present work and the remaining validity of the previous 2D studies. The ability to quantify out-of-plane motion will enable future 3D disc strain analysis in other loading configurations, such as rotation and bending, where less uniform deformations are expected.
The methods in this study are subject to some limitations. Long imaging times limit analysis to studies in which the disc is at steady state, and dynamic loading studies are not currently feasible with the described methods. Similar to other loading studies [5], the applied grip–grip compression overestimated the actual strain experienced by the disc: for applied 5, 10, and 15% grip–grip compression the manual segmentation averaged in the midsagittal and midcoronal images were −4.3 ± 1.3%, −9.3 ± 0.9%, and −12.0 ± 0.9%, respectively. This is due deformation within the loading frame fixtures and possibly deformation during locking of the loaded position prior to imaging. The loading frame's driving rod's thread pitch was comparable to the average applied 5% compression increment of 0.78 ± 0.07 mm. Additionally, it is likely that some deformation occurred within the vertebral bodies, as they become less rigid with osteoporosis [50–53]. The difference between grip–grip compression and actual strain is not itself problematic; however, it does increase variability when grouping samples for statistical analyses.
This study was performed in cadaveric discs and is not currently available for in vivo applications. To achieve high-resolution isotropic images used in this study, significant improvements to current spine surface coils and MRI sequence development will be needed. Nonetheless, MR-based biomechanical studies have been performed in vivo, where disc volume changes have been quantified following axial loading [54] and simulated diurnal loading [55]. Thus, future imaging advances could be translated to in vivo study.
In conclusion, key technical advances were made to develop and validate a new method to measure 3D internal strains in intact human discs. The 3D strain components were obtained for both qualitative and quantitative analysis and compared across AF regions. Three dimensional spatial variations in the three strain components indicate complexities in the material mechanical properties and disc stresses not heretofore appreciated. Some of the variation in magnitude of axial and circumferential strain might be explained by disc geometry. Overall, this study provided new methods that will be valuable in future work. The observed strain inhomogeneity may have implications for both tissue mechanics and cell mechanotransduction, as nearby cells might experience wildly different mechanical environments. These techniques will be valuable in the design, the development, and the evaluation of surgical procedures and therapeutic interventions. Moreover, this work should advance analysis of internal mechanics in other musculoskeletal joints to quantify strains in tendon, ligament, and meniscus within an intact joint.
Acknowledgment
This study was supported by the National Institute of Arthritis and Musculoskeletal and Skin Diseases (Nos. R01AR050052 and RC1AR058450). Spines were acquired from National Disease Research Interchange, Philadelphia, PA.
Contributor Information
Jonathon H. Yoder, Department of Mechanical Engineering and, Applied Mechanics, University of Pennsylvania, Philadelphia, PA 19104, e-mail: hyoder@seas.upenn.edu
John M. Peloquin, Department of Bioengineering, University of Pennsylvania, Philadelphia, PA 19104, e-mail: peloquin@seas.upenn.edu
Gang Song, Department of Radiology, University of Pennsylvania, Philadelphia, PA 19104, e-mail: songgang@seas.upenn.edu.
Nick J. Tustison, Department of Radiology and Medical Imaging, University of Virginia, Charlottesville, VA 22904, e-mail: ntustison@virginia.edu
Sung M. Moon, Department of Radiology, University of Pennsylvania, Philadelphia, PA 19104 MR Systems, GE Healthcare, Florence, SC 29501, e-mail: Sung.Moon@ge.com.
Alexander C. Wright, Department of Radiology, University of Pennsylvania, Philadelphia, PA 19104, e-mail: alexander.wright@uphs.upenn.edu
Edward J. Vresilovic, Penn State Hershey Bone and Joint Institute, Pennsylvania State University, Hershey, PA 17033, e-mail: evresilovic@gmail.com
James C. Gee, Department of Radiology, University of Pennsylvania, Philadelphia, PA 19104, e-mail: gee@mail.med.upenn.edu
Dawn M. Elliott, Department of Biomedical Engineering, University of Delaware, Newark, DE 19716, e-mail: delliott@udel.edu.
References
- [1]. Buckwalter, J. A. , and Mow, V. C. , 2000, “Intervertebral Disc Structure, Composition, Mechanical Function,” Orthopaedic Basic Science, Einhorn T. A., Buckwalter J. A., and Simon S. R., eds., American Academy of Orthopaedic Surgeons, Rosemont, IL, pp. 547–556. [Google Scholar]
- [2]. Holmes, A. D. , Hukins, D. W. , and Freemont, A. J. , 1993, “End-Plate Displacement During Compression of Lumbar Vertebra-Disc-Vertebra Segments and the Mechanism of Failure,” Spine (Phila Pa 1976), 18(1), pp. 128–135. 10.1097/00007632-199301000-00019 [DOI] [PubMed] [Google Scholar]
- [3]. Reuber, M. , Schultz, A. , Denis, F. , and Spencer, D. , 1982, “Bulging of Lumbar Intervertebral Disks,” ASME J. Biomech. Eng., 104(3), pp. 187–192. 10.1115/1.3138347 [DOI] [PubMed] [Google Scholar]
- [4]. Shah, J. S. , Hampson, W. G. , and Jayson, M. I. , 1978, “The Distribution of Surface Strain in the Cadaveric Lumbar Spine,” J. Bone Joint Surg. Br., 60-B(2), pp. 246–251. [DOI] [PubMed] [Google Scholar]
- [5]. Stokes, I. A. , 1987, “Surface Strain on Human Intervertebral Discs,” J. Orthop. Res., 5(3), pp. 348–355. 10.1002/jor.1100050306 [DOI] [PubMed] [Google Scholar]
- [6]. Adams, M. A. , McNally, D. S. , and Dolan, P. , 1996, “'Stress' Distributions Inside Intervertebral Discs. The Effects of Age and Degeneration,” J. Bone Joint Surg. Br., 78(6), pp. 965–972. 10.1302/0301-620X78B6.1287 [DOI] [PubMed] [Google Scholar]
- [7]. Brinckmann, P. , and Grootenboer, H. , 1991, “Change of Disc Height, Radial Disc Bulge, and Intradiscal Pressure From Discectomy. An In Vitro Investigation on Human Lumbar Discs,” Spine (Phila Pa 1976), 16(6), pp. 641–646. 10.1097/00007632-199106000-00008 [DOI] [PubMed] [Google Scholar]
- [8]. Edwards, W. T. , Ordway, N. R. , Zheng, Y. , McCullen, G. , Han, Z. , and Yuan, H. A. , 2001, “Peak Stresses Observed in the Posterior Lateral Anulus,” Spine (Phila Pa 1976), 26(16), pp. 1753–1759. 10.1097/00007632-200108150-00005 [DOI] [PubMed] [Google Scholar]
- [9]. McNally, D. S. , and Adams, M. A. , 1992, “Internal Intervertebral Disc Mechanics as Revealed by Stress Profilometry,” Spine (Phila Pa 1976), 17(1), pp. 66–73. 10.1097/00007632-199201000-00011 [DOI] [PubMed] [Google Scholar]
- [10]. Costi, J. J. , Stokes, I. A. , Gardner-Morse, M. , Laible, J. P. , Scoffone, H. M. , and Iatridis, J. C. , 2007, “Direct Measurement of Intervertebral Disc Maximum Shear Strain in Six Degrees of Freedom: Motions That Place Disc Tissue at Risk of Injury,” J. Biomech., 40(11), pp. 2457–2466. 10.1016/j.jbiomech.2006.11.006 [DOI] [PMC free article] [PubMed] [Google Scholar]
- [11]. Kusaka, Y. , Nakajima, S. , Uemura, O. , Aoshiba, H. , Seo, Y. , and Hirasawa, Y. , 2001, “Intradiscal Solid Phase Displacement as a Determinant of the Centripetal Fluid Shift in the Loaded Intervertebral Disc,” Spine (Phila Pa 1976), 26(9), pp. E174–E181. 10.1097/00007632-200105010-00009 [DOI] [PubMed] [Google Scholar]
- [12]. Meakin, J. R. , Redpath, T. W. , and Hukins, D. W. , 2001, “The Effect of Partial Removal of the Nucleus Pulposus From the Intervertebral Disc on the Response of the Human Annulus Fibrosus to Compression,” Clin. Biomech. (Bristol, Avon), 16(2), pp. 121–128. 10.1016/S0268-0033(00)00075-9 [DOI] [PubMed] [Google Scholar]
- [13]. Seroussi, R. E. , Krag, M. H. , Muller, D. L. , and Pope, M. H. , 1989, “Internal Deformations of Intact and Denucleated Human Lumbar Discs Subjected to Compression, Flexion, and Extension Loads,” J. Orthop. Res., 7(1), pp. 122–131. 10.1002/jor.1100070117 [DOI] [PubMed] [Google Scholar]
- [14]. Tsantrizos, A. , Ito, K. , Aebi, M. , and Steffen, T. , 2005, “Internal Strains in Healthy and Degenerated Lumbar Intervertebral Discs,” Spine (Phila Pa 1976), 30(19), pp. 2129–2137. 10.1097/01.brs.0000181052.56604.30 [DOI] [PubMed] [Google Scholar]
- [15]. Chan, D. D. , and Neu, C. P. , 2013, “Intervertebral Disc Internal Deformation Measured by Displacements Under Applied Loading With MRI at 3T,” Magn. Reson. Med., 71, pp. 1231–1237. 10.1002/mrm.24757 [DOI] [PubMed] [Google Scholar]
- [16]. O'Connell, G. D. , Johannessen, W. , Vresilovic, E. J. , and Elliott, D. M. , 2007, “Human Internal Disc Strains in Axial Compression Measured Noninvasively Using Magnetic Resonance Imaging,” Spine (Phila Pa 1976), 32(25), pp. 2860–2868. 10.1097/BRS.0b013e31815b75fb [DOI] [PubMed] [Google Scholar]
- [17]. O'Connell, G. D. , Malhotra, N. R. , Vresilovic, E. J. , and Elliott, D. M. , “The Effect of Discectomy and the Dependence on Degeneration of Human Intervertebral Disc Strain in Axial Compression,” Spine (Phila Pa 1976), 36(21), pp. 1765–1771. 10.1097/BRS.0b013e318216752f [DOI] [PMC free article] [PubMed] [Google Scholar]
- [18]. O'Connell, G. D. , Vresilovic, E. J. , and Elliott, D. M. , “Human Intervertebral Disc Internal Strain in Compression: The Effect of Disc Region, Loading Position, and Degeneration,” J. Orthop. Res., 29(4), pp. 547–555. 10.1002/jor.21232 [DOI] [PMC free article] [PubMed] [Google Scholar]
- [19]. Reiter, D. A. , Fathallah, F. A. , Farouki, R. T. , and Walton, J. H. , 2012, “Noninvasive High Resolution Mechanical Strain Maps of the spine Intervertebral Disc Using Nonrigid Registration of Magnetic Resonance Images,” J. Biomech., 45(8), pp. 1534–1539. 10.1016/j.jbiomech.2012.03.005 [DOI] [PubMed] [Google Scholar]
- [20]. Pfirrmann, C. W. , Metzdorf, A. , Zanetti, M. , Hodler, J. , and Boos, N. , 2001, “Magnetic Resonance Classification of Lumbar Intervertebral Disc Degeneration,” Spine (Phila Pa 1976), 26(17), pp. 1873–1878. 10.1097/00007632-200109010-00011 [DOI] [PubMed] [Google Scholar]
- [21]. Marinelli, N. L. , Haughton, V. M. , and Anderson, P. A. , “T2 Relaxation Times Correlated With Stage of Lumbar Intervertebral Disk Degeneration and Patient Age,” Am. J. Neuroradiol., 31(7), pp. 1278–1282. 10.3174/ajnr.A2080 [DOI] [PMC free article] [PubMed] [Google Scholar]
- [22]. Watanabe, A. , Benneker, L. M. , Boesch, C. , Watanabe, T. , Obata, T. , and Anderson, S. E. , 2007, “Classification of Intervertebral Disk Degeneration With Axial T2 Mapping,” Am. J. Roentgenol., 189(4), pp. 936–942. 10.2214/AJR.07.2142 [DOI] [PubMed] [Google Scholar]
- [23]. Welsch, G. H. , Trattnig, S. , Paternostro-Sluga, T. , Bohndorf, K. , Goed, S. , Stelzeneder, D. , and Mamisch, T. C. , “Parametric T2 and T2* Mapping Techniques to Visualize Intervertebral Disc Degeneration in Patients With Low Back Pain: Initial Results on the Clinical Use of 3.0 Tesla MRI,” Skeletal Radiol., 40(5), pp. 543–551. 10.1007/s00256-010-1036-8 [DOI] [PubMed] [Google Scholar]
- [24]. Wright, A. C. , Lemdiasov, R. , Connick, T. J. , Bhagat, Y. A. , Magland, J. F. , Song, H. K. , Toddes, S. P. , Ludwig, R. , and Wehrli, F. W. , 2011, “Helmholtz-Pair Transmit Coil With Integrated Receive Array for High-Resolution MRI of Trabecular Bone in the Distal Tibia at 7T,” J. Magn. Reson., 210(1), pp. 113–122. 10.1016/j.jmr.2011.02.019 [DOI] [PMC free article] [PubMed] [Google Scholar]
- [25]. Schenck, J. F. , 1996, “The Role of Magnetic Susceptibility in Magnetic Resonance Imaging: MRI Magnetic Compatibility of the First and Second Kinds,” Med. Phys., 23(6), pp. 815–850. 10.1118/1.597854 [DOI] [PubMed] [Google Scholar]
- [26]. O'Connell, G. D. , Vresilovic, E. J. , and Elliott, D. M. , 2007, “Comparison of Animals Used in Disc Research to Human Lumbar Disc Geometry,” Spine (Phila Pa 1976), 32(3), pp. 328–333. 10.1097/01.brs.0000253961.40910.c1 [DOI] [PubMed] [Google Scholar]
- [27]. Yushkevich, P. A. , Piven, J. , Hazlett, H. C. , Smith, R. G. , Ho, S. , Gee, J. C. , and Gerig, G. , 2006, “User-Guided 3D Active Contour Segmentation of Anatomical Structures: Significantly Improved Efficiency and Reliability,” Neuroimage, 31(3), pp. 1116–1128. 10.1016/j.neuroimage.2006.01.015 [DOI] [PubMed] [Google Scholar]
- [28]. Avants, B. B. , Epstein, C. L. , Grossman, M. , and Gee, J. C. , 2008, “Symmetric Diffeomorphic Image Registration With Cross-Correlation: Evaluating Automated Labeling of Elderly and Neurodegenerative Brain,” Med. Image Anal., 12(1), pp. 26–41. 10.1016/j.media.2007.06.004 [DOI] [PMC free article] [PubMed] [Google Scholar]
- [29]. Avants, B. B. , Tustison, N. J. , Song, G. , Cook, P. A. , Klein, A. , and Gee, J. C. , 2011, “A Reproducible Evaluation of ANTs Similarity Metric Performance in Brain Image Registration,” Neuroimage, 54(3), pp. 2033–2044. 10.1016/j.neuroimage.2010.09.025 [DOI] [PMC free article] [PubMed] [Google Scholar]
- [30]. Tustison, N. J. , and Avants, B. , 2013, “Explicit B-Spline Regularization in Diffeomorphic Image Registration,” Front. Neuroinform., 7, p. 39.10.3389%2Ffninf.2013.00039 [DOI] [PMC free article] [PubMed] [Google Scholar]
- [31]. Tustison, N. J. , Avants, B. B. , and Gee, J. C. , 2009, “Directly Manipulated Free-Form Deformation Image Registration,” IEEE Trans. Image Process., 18(3), pp. 624–635. 10.1109/TIP.2008.2010072 [DOI] [PubMed] [Google Scholar]
- [32]. Tustison, N. J. , and Amini, A. A. , 2006, “Biventricular Myocardial Strains Via Nonrigid Registration of Anatomical NURBS Model [corrected],” IEEE Trans. Med. Imaging, 25(1), pp. 94–112. 10.1109/TMI.2005.861015 [DOI] [PubMed] [Google Scholar]
- [33]. Tustison, N. J. , Awate, S. P. , Cai, J. , Altes, T. A. , Miller, G. W. , de Lange, E. E. , Mugler, III, J. P. , and Gee, J. C. , “Pulmonary Kinematics From Tagged Hyperpolarized Helium-3 MRI,” J. Magn. Reson. Imaging, 31(5), pp. 1236–1241. 10.1002/jmri.22137 [DOI] [PMC free article] [PubMed] [Google Scholar]
- [34]. Tustison, N. J. , Davila-Roman, V. G. , and Amini, A. A. , 2003, “Myocardial Kinematics From Tagged MRI Based on a 4-D B-Spline Model,” IEEE Trans. Biomed. Eng., 50(8), pp. 1038–1040. 10.1109/TBME.2003.814530 [DOI] [PubMed] [Google Scholar]
- [35]. Klein, A. , Andersson, J. , Ardekani, B. A. , Ashburner, J. , Avants, B. , Chiang, M. C. , Christensen, G. E. , Collins, D. L. , Gee, J. , Hellier, P. , Song, J. H. , Jenkinson, M. , Lepage, C. , Rueckert, D. , Thompson, P. , Vercauteren, T. , Woods, R. P. , Mann, J. J. , and Parsey, R. V. , 2009, “Evaluation of 14 Nonlinear Deformation Algorithms Applied to Human Brain MRI Registration,” Neuroimage, 46(3), pp. 786–802. 10.1016/j.neuroimage.2008.12.037 [DOI] [PMC free article] [PubMed] [Google Scholar]
- [36]. Murphy, K. , van Ginneken, B. , Reinhardt, J. M. , Kabus, S. , Ding, K. , Deng, X. , Cao, K. , Du, K. , Christensen, G. E. , Garcia, V. , Vercauteren, T. , Ayache, N. , Commowick, O. , Malandain, G. , Glocker, B. , Paragios, N. , Navab, N. , Gorbunova, V. , Sporring, J. , de Bruijne, M. , Han, X. , Heinrich, M. P. , Schnabel, J. A. , Jenkinson, M. , Lorenz, C. , Modat, M. , McClelland, J. R. , Ourselin, S. , Muenzing, S. E. , Viergever, M. A. , De Nigris, D. , Collins, D. L. , Arbel, T. , Peroni, M. , Li, R. , Sharp, G. C. , Schmidt-Richberg, A. , Ehrhardt, J. , Werner, R. , Smeets, D. , Loeckx, D. , Song, G. , Tustison, N. , Avants, B. , Gee, J. C. , Staring, M. , Klein, S. , Stoel, B. C. , Urschler, M. , Werlberger, M. , Vandemeulebroucke, J. , Rit, S. , Sarrut, D. , and Pluim, J. P. , 2011, “Evaluation of Registration Methods on Thoracic CT: The EMPIRE10 Challenge,” IEEE Trans. Med. Imaging, 30(11), pp. 1901–1920. 10.1109/TMI.2011.2158349 [DOI] [PubMed] [Google Scholar]
- [37]. Pech, P. , and Haughton, V. M. , 1985, “Lumbar Intervertebral Disk: Correlative MR and Anatomic Study,” Radiology, 156(3), pp. 699–701. 10.1148/radiology.156.3.4023228 [DOI] [PubMed] [Google Scholar]
- [38]. Shirazi-Adl, S. A. , Shrivastava, S. C. , and Ahmed, A. M. , 1984, “Stress Analysis of the Lumbar Disc-Body Unit in Compression. A Three-Dimensional Nonlinear Finite Element Study,” Spine (Phila Pa 1976), 9(2), pp. 120–134. 10.1097/00007632-198403000-00003 [DOI] [PubMed] [Google Scholar]
- [39]. Goel, V. K. , Monroe, B. T. , Gilbertson, L. G. , and Brinckmann, P. , 1995, “Interlaminar Shear Stresses and Laminae Separation in a Disc. Finite Element Analysis of the L3-L4 Motion Segment Subjected to Axial Compressive Loads,” Spine (Phila Pa 1976), 20(6), pp. 689–698. 10.1097/00007632-199503150-00010 [DOI] [PubMed] [Google Scholar]
- [40]. Fagan, M. J. , Julian, S. , Siddall, D. J. , and Mohsen, A. M. , 2002, “Patient-Specific Spine Models. Part 1: Finite Element Analysis of the Lumbar Intervertebral Disc—A Material Sensitivity Study,” Proc. Inst. Mech. Eng. H, 216(5), pp. 299–314. 10.1243/09544110260216577 [DOI] [PubMed] [Google Scholar]
- [41]. Argoubi, M. , and Shirazi-Adl, A. , 1996, “Poroelastic Creep Response Analysis of a Lumbar Motion Segment in Compression,” J. Biomech., 29(10), pp. 1331–1339. 10.1016/0021-9290(96)00035-8 [DOI] [PubMed] [Google Scholar]
- [42]. Marchand, F. , and Ahmed, A. M. , 1990, “Investigation of the Laminate Structure of Lumbar Disc Anulus Fibrosus,” Spine (Phila Pa 1976), 15(5), pp. 402–410. 10.1097/00007632-199005000-00011 [DOI] [PubMed] [Google Scholar]
- [43]. Wilke, H. J. , Neef, P. , Caimi, M. , Hoogland, T. , and Claes, L. E. , 1999, “New In Vivo Measurements of Pressures in the Intervertebral Disc in Daily Life,” Spine (Phila Pa 1976), 24(8), pp. 755–762. 10.1097/00007632-199904150-00005 [DOI] [PubMed] [Google Scholar]
- [44]. Beckstein, J. C. , Sen, S. , Schaer, T. P. , Vresilovic, E. J. , and Elliott, D. M. , 2008, “Comparison of Animal Discs Used in Disc Research to Human Lumbar Disc: Axial Compression Mechanics and Glycosaminoglycan Content,” Spine (Phila Pa 1976), 33(6), pp. E166–E173. 10.1097/BRS.0b013e318166e001 [DOI] [PubMed] [Google Scholar]
- [45]. Johannessen, W. , Vresilovic, E. J. , Wright, A. C. , and Elliott, D. M. , 2004, “Intervertebral Disc Mechanics are Restored Following Cyclic Loading and Unloaded Recovery,” Ann. Biomed. Eng., 32(1), pp. 70–76. 10.1023/B:ABME.0000007792.19071.8c [DOI] [PubMed] [Google Scholar]
- [46]. O'Connell, G. D. , Jacobs, N. T. , Sen, S. , Vresilovic, E. J. , and Elliott, D. M. , 2011, “Axial Creep Loading and Unloaded Recovery of the Human Intervertebral Disc and the Effect of Degeneration,” J. Mech. Behav. Biomed. Mater., 4(7), pp. 933–942. 10.1016/j.jmbbm.2011.02.002 [DOI] [PMC free article] [PubMed] [Google Scholar]
- [47]. Holmes, A. D. , and Hukins, D. W. , 1996, “Analysis of Load-Relaxation in Compressed Segments of Lumbar Spine,” Med. Eng. Phys., 18(2), pp. 99–104. 10.1016/1350-4533(95)00047-X [DOI] [PubMed] [Google Scholar]
- [48]. Keller, T. S. , Spengler, D. M. , and Hansson, T. H. , 1987, “Mechanical Behavior of the Human Lumbar Spine. I. Creep Analysis During Static Compressive Loading,” J. Orthop. Res., 5(4), pp. 467–478. 10.1002/jor.1100050402 [DOI] [PubMed] [Google Scholar]
- [49]. Perie, D. , Korda, D. , and Iatridis, J. C. , 2005, “Confined Compression Experiments on Bovine Nucleus Pulposus and Annulus Fibrosus: Sensitivity of the Experiment in the Determination of Compressive Modulus and Hydraulic Permeability,” J. Biomech., 38(11), pp. 2164–2171. 10.1016/j.jbiomech.2004.10.002 [DOI] [PubMed] [Google Scholar]
- [50]. McBroom, R. J. , Hayes, W. C. , Edwards, W. T. , Goldberg, R. P. , and White, III, A. A. , 1985, “Prediction of Vertebral Body Compressive Fracture Using Quantitative Computed Tomography,” J. Bone Joint Surg. Am., 67(8), pp. 1206–1214. [PubMed] [Google Scholar]
- [51]. Hansson, T. , Roos, B. , and Nachemson, A. , 1980, “The Bone Mineral Content and Ultimate Compressive Strength of Lumbar Vertebrae,” Spine (Phila Pa 1976), 5(1), pp. 46–55. 10.1097/00007632-198001000-00009 [DOI] [PubMed] [Google Scholar]
- [52]. Ebbesen, E. N. , Thomsen, J. S. , Beck-Nielsen, H. , Nepper-Rasmussen, H. J. , and Mosekilde, L. , 1999, “Lumbar Vertebral Body Compressive Strength Evaluated by Dual-Energy X-Ray Absorptiometry, Quantitative Computed Tomography, and Ashing,” Bone, 25(6), pp. 713–724. 10.1016/S8756-3282(99)00216-1 [DOI] [PubMed] [Google Scholar]
- [53]. Cheng, X. G. , Nicholson, P. H. , Boonen, S. , Lowet, G. , Brys, P. , Aerssens, J. , Van der Perre, G. , and Dequeker, J. , 1997, “Prediction of Vertebral Strength In Vitro by Spinal Bone Densitometry and Calcaneal Ultrasound,” J. Bone Miner. Res., 12(10), pp. 1721–1728. 10.1359/jbmr.1997.12.10.1721 [DOI] [PubMed] [Google Scholar]
- [54]. Danielson, B. , and Willen, J. , 2001, “Axially Loaded Magnetic Resonance Image of the Lumbar Spine in Asymptomatic Individuals,” Spine (Phila Pa 1976), 26(23), pp. 2601–2606. 10.1097/00007632-200112010-00015 [DOI] [PubMed] [Google Scholar]
- [55]. Malko, J. A. , Hutton, W. C. , and Fajman, W. A. , 1999, “An In Vivo Magnetic Resonance Imaging Study of Changes in the Volume (and Fluid Content) of the Lumbar Intervertebral Discs During a Simulated Diurnal Load Cycle,” Spine (Phila Pa 1976), 24(10), pp. 1015–1022. 10.1097/00007632-199905150-00016 [DOI] [PubMed] [Google Scholar]