

Abstract
Genetically-encoded actuators that allow control of protein-protein interactions with light, termed ‘optical dimerizers’, are emerging as new tools for experimental biology. In recent years, numerous new and versatile dimerizer systems have been developed. Here we discuss the design of optical dimerizer experiments, including choice of a dimerizer system, photoexcitation sources, and coordinate use of imaging reporters. We provide detailed protocols for experiments using two dimerization systems we previously developed, CRY2/CIB and UVR8/UVR8, for use controlling transcription, protein localization, and protein secretion with light. Additionally, we provide instructions and software for constructing a pulse-controlled LED light device for use in experiments requiring extended light treatments.
Unit Introduction
Light has long been recognized as an ideal actuator for controlling cellular biochemistry, based on the fact that it can be delivered or removed for precise durations at user-defined times, within spatially restricted groups of cells or even subcellular domains. Traditional approaches have relied on light-sensitive small molecules that can be converted to a bioactive state with light (Adams and Tsien, 1993; Ellis-Davies, 2007). This “photo-uncaging” approach has been extremely powerful for relating acute perturbations in signaling pathways, channel activity, or synapse activation to cellular physiology. In recent years, a new field of optical control has emerged with the development of genetically-encoded photoreceptor technologies that allow rapid and local control of cellular function using light. These ‘optogenetic’ tools provide a powerful resource for researchers seeking to spatially or temporally control biological function.
While optogenetics has its roots in neuroscience (see Commentary section below), the field is rapidly expanding into cell biology, with growing numbers of engineered light-responsive systems allowing inducible spatiotemporal control of protein activity, localization, and interactions within live cells. Generally, these tools have been used in two different ways to control cell function (Figure 1A). In the first approach, photosensory domains are allosterically coupled to target proteins, such that a change in conformation of the photoreceptor with light results in a coordinated change in activity or binding of the target. This approach has been used to control small GTPases, ion channels, protein degradation, DNA binding, and other basic processes (Bonger et al., 2014; Krauss et al., 2010; Lee et al., 2008; Renicke et al., 2013; Schmidt et al., 2014; Strickland et al., 2008; Wu et al., 2009). In a second ‘optical dimerizer’ approach, a photoreceptor and a binding domain that only interact under a specific light condition are used to control activity of fused target proteins. Using protein-protein domains that interact with light, target proteins or domains can be forced to dimerize with light (Crefcoeur et al., 2013; Kennedy et al., 2010; Levskaya et al., 2009; Müller et al., 2013a; Nihongaki et al., 2014; Shimizu-Sato et al., 2002; Strickland et al., 2012; Yazawa et al., 2009). Alternatively, photoreceptors or photosensory domains that dimerize in the dark but undergo light-induced monomerization have also been used to confer light control to processes such as protein secretion or protease activity (Chen et al., 2013; Zhou et al., 2012).
Figure 1. Strategies for optically controlling protein interactions.
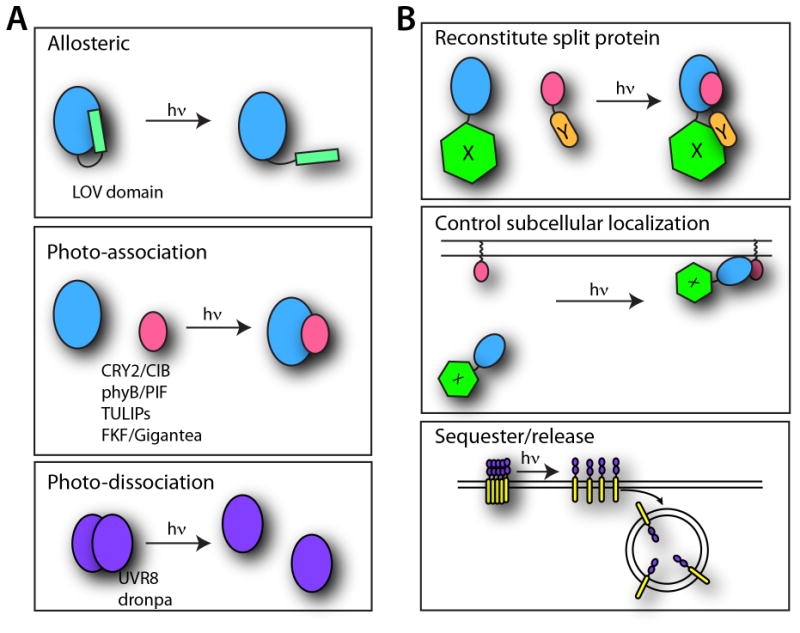
A. Photoreceptors for controlling protein function and how they respond to light are schematized.
B. General strategies for controlling protein function are shown.
Optical dimerizers have already been adopted to regulate a number of important processes in live cells including phosphoinositide signaling, small GTPase activity, transcription, DNA recombination, and protein secretion (Boulina et al., 2013; Chen et al., 2013; Hughes et al., 2012; Idevall-Hagren et al., 2012; Kennedy et al., 2010; Konermann et al., 2013; Levskaya et al., 2009; Shimizu-Sato et al., 2002; Toettcher et al., 2013; Wend et al., 2013; Zhang et al., 2014). Two general strategies have emerged: engineering “split” proteins fused to optical dimerizers whose activity can be reconstituted with light, and using light to sequester, release, or control the concentration of specific proteins in different subcellular locations where they may be active or inactive (Figure 1B). This unit discusses general considerations for choosing and using an optical dimerization system. We focus on two systems we recently developed based on CRY2 and UVR8 photoreceptors, describing three basic protocols that should provide a foundation for their effective implementation.
Basic Protocol 1: Controlling protein secretion with light in cultured cells
Methods allowing inducible control of protein trafficking through the secretory pathway have provided a powerful means to study how secreted factors navigate the complex intracellular membrane network. A number of different methods have been developed for studying secretory pathways that rely on the basic principle of sequestering a protein cargo in the endoplasmic reticulum and synchronously releasing the cargo with addition of a small molecule or a temperature shift (Boncompain et al., 2012; Presley et al., 1997; Rivera et al., 2000). Tools allowing light control of cargo release allow local release of factors not only at specific times, but in specific organs, embryonic regions, or even cellular subdomains of large, complex cells like neurons. Here we describe a basic method for inducible control of protein secretion using UVR8 (Chen et al., 2013).
Materials
Dulbecco's Modified Eagle Medium (DMEM)
DMEM + 10% Fetal Bovine Serum (FBS)
COS-7, HeLa or other suitable adherent cell line grown on #1 or 1.5 coverglass
Tissue culture hood
Tissue culture incubator
HEPES based imaging solution (see recipe)
UV-B light source (we use model#EB280C UV from Spectroline (312nm), but any source with a wavelength from 300-315 nm will work)
Lipofectamine 2000
VSVG-YFP-2xUVR8 plasmid (Addgene plasmid #49800), or other engineered tandem UVR8 construct
Coverglass chamber for live cell imaging (Ludin chamber type 1, Life Imaging Services)
Confocal or epifluorescent microscope to image fluorescent secretory cargo
Cell transfection (for 18 mm coverslips in 12 well dishes, scale according to the manufacturer's recommendations)
Mix 1 μL of lipofectamine with 50 μL of serum-free DMEM and incubate at room temperature for 5 min.
Mix 1 μg of plasmid DNA with 50 μL of serum-free DMEM.
Mix Lipofectamine and DNA solutions together and incubate at room temperature for 20 min.
Add DNA/Lipofectamine mixture to cells dropwise with gentle swirling of plate to mix.
After 2 hours remove media containing DNA/lipofectamine and replace with pre-warmed DMEM/10% FBS.
Incubate cells in a 5% CO2 incubator at 37°C for at least 12-24 hours. Expression should be observable in 8-12 hours.
Microscopy
-
7.
Remove coverslip from the 12 well dish, briefly rinse in HEPES imaging media (see recipe below) and place in appropriate live cell imaging chamber (we use a Ludin chamber from Life Imaging Services).
NOTE: There is no need to protect the samples from ambient room light, as we have not observed activation of UVR8 by room light.
-
8.
Place imaging chamber on the microscope. For live cell imaging, we use a spinning disk confocal equipped with an environmental chamber with the temperature at 34°-37°C. To achieve the best possible images and to clearly resolve post-Golgi membrane carriers and ER structure, a 60x or 100x oil immersion objective with a numerical aperture of at least 1.4 should be used. Position the UVB light source above the sample so that it can be switched on with minimal disturbance to the imaging setup.
Note: If only post-Golgi trafficking is relevant, cells can be excited with UVB illumination for 5-10 sec. and incubated at 19°C for 30 minutes prior to imaging. This “temperature block” will allow forward trafficking from the ER to the Golgi complex, but at this temperature, progression through the Golgi is severely limited. Cells can be kept for up to 1 hour at reduced temperature to allow complete accumulation of cargo in the Golgi complex. Cells can then be warmed to ∼30°-37°C on the microscope to trigger the generation of post-Golgi carriers.
-
9.
Locate cells harboring bright clusters of UVR8-fused cargo and begin imaging. We take confocal z stacks with 0.4 μm spacing and typically capture 8-10 optical sections per time point. Because secretory trafficking takes place on a relatively slow timescale, 1 z-stack every 30 sec. is sufficient to visualize Golgi accumulation and release.
Note: If interested in imaging post-Golgi carriers, the frame rate should be increased to 0.5 to 2 Hz as these structures move quite rapidly. However, prolonged imaging at these frame rates should be avoided as the cells can become photodamaged after more than ∼3-5 min of imaging at these frame rates (this is highly dependent on the intensity of excitation light, which should be minimized).
-
10.
Establish a 5-10 minute baseline and then switch on the UVB source to photo-excite the cells. Exact exposure times will vary and must be empirically determined, but with our light source positiond 6 cm above the sample, 5-10 s should be sufficient to completely “dissolve” the ER-retained UVR8 clusters and allow forward trafficking. The clusters will continue to dissociate for up to 5 minutes after the UV source is turned off.
-
11.
Continue imaging to visualize cargo as it progresses from the ER to the Golgi complex, to the plasma membrane. For VSVG, complete accumulation in the Golgi complex occurs after ∼20-30 minutes and the Golgi complex will completely “empty” after ∼1.5 hours as cargo is forward trafficked to the plasma membrane.
Note: If you are interested in delivery of post-Golgi carriers to the plasma membrane, total internal reflection (TIR) microscopy can be carried out to selectively visualize only those carriers docked or in close proximity to the adherent cellular membrane (Chen et al., 2013; Keller et al., 2001; Toomre et al., 2000).
Note: for special considerations in using this protocol, please refer to the Critical Parameters section below.
Special considerations
Cell line
For imaging experiments, we have had the best success using COS7 cells, which have a flat, “spread out” morphology on the coverslip, allowing clear visualization of trafficking vesicles. While HEK293 cells can also be used, it is more difficult to clearly resolve trafficking intermediates.
UV toxicity
We have found that brief pulses of UVB (5-10 s, 0.3 mW/cm2) do not trigger cell death pathways in cultured cells, but that marginally longer pulses (10-20 sec) triggered significant (12%) cell death in HEK293 and COS7 cells (Chen et al., 2013). Thus it is important to optimize experiments to deliver minimal UVB.
Phototoxicity of cargo imaging
We have occasionally observed that the excitation light used for imaging fluorescently labeled cargo (488 laser in our case) had a phototoxic effect on the secretory pathway. In these instances, the cells being imaged accumulated cargo in the Golgi complex, but cargo failed to progress to the plasma membrane, while cells on the same coverslip (but not imaged) exhibited robust plasma membrane cargo localization (i.e. only the cells that were imaged failed to traffic cargo to the PM). Thus careful optimization of the imaging parameters (pixel binning, EM gain, laser power, exposure duration and frequency) must be performed to minimize light exposure.
Baseline “leakiness” of cargo to the plasma membrane
We have observed in some cells that a significant fraction of UVR8-fused cargoes are present on the plasma membrane prior to UV illumination. This background “leakiness” tends to go up with duration of expression, but on average we estimate that only 10-15% of UVR8-fused cargo is leaked to the plasma membrane prior to UVB exposure. This parameter may vary greatly with the target cargo under investigation and from cell to cell in the same experiment, and must be empirically determined.
Basic Protocol 2: Controlling protein localization with light
The activity of a protein is often highly dependent on its localization. For example, recruiting specific small GTPases to the plasma membrane triggers robust changes in cellular morphology caused by cytoskeletal rearrangements (Inoue et al., 2005). Dimerizers can provide a fast, inducible means to regulate protein activity through modulation of intracellular localization. In this scenario, one dimerizer tag is localized to a subcellular site where a protein target is normally active. The second dimerizer half is attached to the target protein, which has been engineered to remove any endogenous localization motifs. Induction of dimerization brings the target protein to the functional site. While recruitment may be permissive for activity, such a strategy does not always allow induction of activity at the time of recruitment. For this, constitutively active versions of the proteins are often used, which are non-functional when mislocalized, but have gain-of-function effects when their correct localization is restored. This strategy has been used extensively with chemical dimerizers, and has been used with optical dimerizers to control activity of small GTPases, lipid kinases and phosphatases, and signaling enzymes (Aoki et al., 2013; Idevall-Hagren et al., 2012; Kakumoto and Nakata, 2013; Levskaya et al., 2009; Strickland et al., 2012; Toettcher et al., 2013; Yazawa et al., 2009; Zhang et al., 2014). This protocol describes how to recruit proteins of interest to the plasma membrane with light using the CRY2/CIB system (specifically: CRY2-mCherry-target and CIBN-pmGFP).
Materials
Red safelight (LED bicycle tail lights with wavelengths ∼620 nm work well)
Dulbecco's Modified Eagle Medium (DMEM)
DMEM + 10% Fetal Bovine Serum (FBS)
COS-7/HeLa or other adherent cell line grown in live cell imaging dishes
Tissue culture hood
Tissue culture incubator
Lipofectamine 2000 or other transfection reagent
HEPES based imaging solution (see recipe in Reagents and Solutions below)
CIBN-pmGFP (CIBN fused to an EGFP-CaaX prenylation sequence allowing membrane localization) (Addgene plasmid 26867)
CRY2PHR-mCherry-target protein fusion (if target fusion protein is normally localized to the plasma membrane, a mutant version must be used that disrupts normal localization) (Addgene plasmid 26866)
Confocal or epifluorescent microscope equipped for GFP fluorescence imaging
Live cell imaging dishes (for example, MatTek 35 mm glass bottom dishes, P35G-1.5-14. Alternatively, coverslips in 12-well plates can also be used. For routine use, we make our own inexpensive imaging dishes, following the protocol outlined here: http://biofrontiers.colorado.edu/core-facilities/microscopy-core/user-resources-1/making-imaging-dishes)
Cell transfection (for 35mm dishes)
Mix 2.5 μL of lipofectamine with 125 μL of serum-free DMEM and incubate at room temperature for 5 min.
Mix 2.5 μg of plasmid DNA with 125 μL of DMEM.
Mix lipofectamine and DNA solutions together and incubate at room temperature for 20 min.
Add DNA/lipofectamine mixture to cells dropwise with gentle swirling of plate to mix.
After 2 hours remove media containing DNA/lipofectamine and replace with pre-warmed DMEM / 10% FBS.
Incubate cells in a 5% CO2 incubator at 37°C for at least 12-24 hours, wrapped in foil. Expression of mCherry fluorescent tag expression can be verified without stimulating CRY2 (focusing with mCherry channel) and should be observable after 12 hours.
Live cell imaging
Prewarm microscope incubator to 34-37°C for at least 30 minutes prior to use.
In tissue-culture hood illuminated with red LED safelight, replace DMEM buffer in imaging dish with prewarmed HEPES imaging buffer. Wrap cells in foil for transport.
Add a drop of immersion oil to microscope objective. Place cells on microscope, taking care to keep them shielded from dark during transfer. A red LED light may be used to help with placement. Transmitted light, unless filtered as described below, should be left off.
-
Use filtered transmitted light or 561 nm fluorescent channel to focus on cells, taking care not to accidently switch filters to GFP, CFP, or YFP channels (400-514 nm) since these excitation wavelengths will activate CRY2. Find cell or cells expressing CRY2-mCh-target.
Even brief exposure to 488 nm excitation light (such as when changing through filter sets with the excitation light un-shuttered) will robustly excite CRY2. In addition, long-term exposure to high intensity 561 nm light can also excite CRY2 at very low levels (see Troubleshooting section below). Thus, take care to use as low light illumination as possible and minimize illumination time when setting up experiments. Note that in this experimental setup cells expressing CIBN-pmGFP cannot be identified before initiating the experiment since the 488 nm excitation light will stimulate CRY2. Alternatively, use of a far-red fluorescent tag on CIBN rather than GFP can allow confirmation of expression before initiating live cell imaging.
Set up live cell imaging parameters. A baseline series of red images should be generated first, recording any changes that occur within cells expressing CRY2-mCh-target prior to blue light stimulation. These images are obtained with 561-568 nm excitation light, which does not appreciably photo-excite CRY2 unless used for prolonged periods at high intensity.
-
After generating a baseline movie, software is set for a multi-color imaging sequence. Here we describe an imaging sequence to visualize recruitment, where acquisition every 500 ms for 1 min should be sufficient. To visualize more long-term consequences of recruitment, imaging intervals and time-frames can be adjusted as needed. Software is set to acquire a series of 561 nm images, as well as a single 488 nm image that used to stimulate the CRY2/CIBN interaction (as well as initiating recruitment, this image is also used to confirm CIBN localization at the plasma membrane).
The translocating protein can also be labeled with GFP, in which case the first image serves to mark initial protein localization, and to initiate recruitment. However, this allows no baseline ‘dark’ image series to be generated, and as recruitment occurs within hundreds of milliseconds, this approach is best used only when no other fluorescent tags are available, and using minimal z-stacks/exposure times.
After acquiring the image, the GFP channel should be checked to confirm that CIBN-pmGFP is expressing in the imaged cell. If not, a new cell in a different region of the coverslip should be found using the mCherry/DsRed fluorescent channel, and step 6 repeated.
Basic Protocol 3: Light mediated control of transcription in yeast
This protocol describes methods for using CRY2/CIB to control transcription in yeast (Hughes et al., 2012; Kennedy et al., 2010). The approach uses a split transcription factor, which has been separated into a DNA binding domain and a transcriptional activation domain. While in theory any transcriptional activator can be utilized, here we describe a system using a LexA DNA binding domain (which binds LexA operator sites) combined with a VP16 activation domain. As the LexA-VP16 system is completely orthogonal to yeast, it can be used in any strain with appropriate auxotrophic markers.
Materials
Laboratory yeast strain such as W303-1A (auxotrophic mutant for Trp-, Leu-, and Ura-)
LexA-CRY2PHR or LexA-CRY2 DNA binding domain construct (Trp+ auxotrophic marker)
pRH-VP16-CIBN or pRH-VP16-CIB1 Activation domain fusion construct (Leu+ auxotrophic marker)
Yeast expression plasmid containing a protein of interest inserted downstream of LexA operator sites (for example, pSH18-34, Life Technologies, Ura+ marker).
Yeast synthetic dropout media (SC -Trp/-Leu/-His)
ssDNA (see protocol below)
50% PEG
50% dextrose
0.1 M LiAc
1 M LiAc
30°C shaking incubator
30°C non-shaking incubator
Glass or plastic test tubes or flasks for growing yeast
Aluminum foil
Light source for CRY2 excitation (see Support Protocol 1)
Yeast transformation
Innoculate 25 ml of yeast media with selected strain. Grow overnight at 30°C with shaking in YPD or appropriate synthetic dropout media.
Pellet cells at low speed (1000 x g) for 5 min. Resuspend in 25 ml water.
Pellet cells again, respend in 5 ml 0.1 M LiAc. Incubate at least one hour at room temperature.
-
Pellet cells (1000 x g, 5 min). Resuspend pellet in equivalent (1x pellet volume) volume of 0.1 M LiAc with 10% DMSO. Aliquot sufficient yeast (15 μl/ transformation) into a new tube for use in transformation. Remaining yeast can be frozen in aliquots in -80°C freezer for later use
(we routinely freeze yeast prepared this way up to 1 year with minimal loss in transformation efficiency).
For each transformation, prepare two tubes. Tube A contains 5 μl ssDNA (see protocol below), 0.5-1 μg plasmid DNA (for a triple transformation, use 0.5-1 μg each plasmid), and water to 20 μl. Tube B contains 100 μl 50% PEG and 15 μl 1 M LiAc.
To each tube containing PEG/LiAc, add all of tube A (DNA) and 15 μl yeast cells. Vortex well until clearly mixed (usually, ∼ 30 seconds).
Incubate at room temperature for at least 20 minutes (longer incubations at this stage are also ok). Place in a 42°C water bath for 20 minutes (loss of transformation efficiency occurs with longer incubations).
Pellet yeast (10,000 rpm in microcentrifuge, 1 min). Remove supernatant and resuspend in 75 μl water. Plate on SC –Trp/-Leu/-Ura plates. Place in 30°C incubator and grow 2-3 days. Pick several colonies and streak on a fresh SC –Trp/-Leu/-Ura plate for further use.
Light induction of protein expression
Pick a single yeast colony and innoculate in 5 ml SC –Trp/-Leu/-Ura media. Grow overnight with shaking at 30°C, in flask or tube wrapped in foil (to protect from light).
-
In morning, measure OD600 of yeast culture (taking care not to expose main culture to light). Dilute culture to OD600 of 0.22.
To manipulate yeast, a dark or very dim room should be used. An internal room or closet without windows, that is kept very dim (such that it is difficult, but not impossible, to see and manipulate samples) is sufficient (ie complete darkness is not necessary). To make it easier to manipulate samples, a dim red LED safelight (such as a bike tail light) can be used as well.
Place yeast in 30°C shaker, protected from light with foil, and grow ∼ 3 hours until reaching an optical density (OD600) ∼0.6.
-
To stimulate induction of transcription with light, samples can be treated in several different ways:
Yeast will grow best in a shaking incubator, allowing incubation at 30°C with shaking. A LED light can be attached to the inside lid of the incubator, or for incubators with plexiglass lids, placed outside the lid. Dark controls are treated the same way but wrapped in foil.
Cells may also be simply placed in eppendorf tubes or petri dishes without shaking and incubated at 30°C under a blue LED light, set to pulse 2 s every 3 min.
In the simplest instance, if no pulsed LED lighting is available for use in incubators, samples may also be simply placed at room temperature under a lab bench full spectrum fluorescent light, or placed in an incubator with a full spectrum or blue LED flashlight.
Depending on the experiment, yeast can be induced for different periods of time (min, hrs, or even several days). For longer light treatments of several days, we grow yeast on SC –Trp/-Leu/-His plates at 30°C with pulsed 461 nm LED light treatments. Alternatively, we can simply place plates at RT on the benchtop near a fluorescent light source.
Support Protocol 1: Construction of programmable LED light device
Controlled and reproducible delivery of light is important in optogenetic applications. A strategy for controlled light delivery is to deliver brief pulses of light at regular intervals, which provides a way to stimulate light-sensitive proteins while avoiding potential toxic effects of prolonged constant light treatments. Provided below is a discussion of the basic components needed to construct a multi-output, programmable LED light device. Constructing the device requires a basic knowledge of electronics. The device allows the user to set the duration, interval, and intensity of light pulses. Central to the device is an inexpensive microcontroller and LCD keypad to display and read user input to control the duration and intensity of LED light pulses at user-defined intervals. As shown in Figure 2, up to three LED outputs can be independently programmed and different LED modules can be interchanged.
Figure 2.
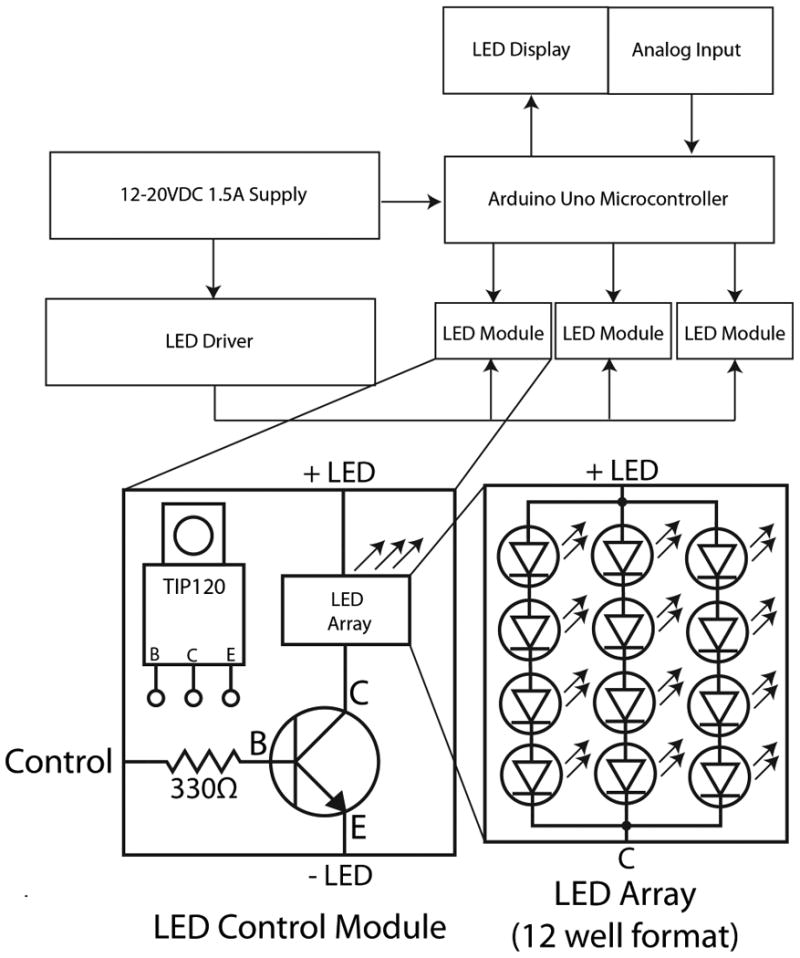
Schematic for constructing an LED light source capable of user-defined pulse duration and frequency The basic wiring diagram is shown for a control module used to drive a 12 LED array that can be placed on a 12 well dish.
Materials
Arduino Uno ATMEGA328P Microcontroller
LCD Keypad Shield for Arduino (such as SainSmart or DFRobot LCD Keypad Shield)
Standard 22 AWG hook up wire
Solder
Soldering Iron
2100 mA BuckBlock Luxdrive LED Driver (LEDdynamics)
12-20VDC 1.5A Power Supply
Three TIP120 Darlington Transistors
Three 330Ω resistors
130 mm×70 mm rectangular heat sink (fits over the top of a 12 well plate)
Thermal epoxy or thermal tape
470 nm Rebel LED, mounted on a 10 mm base (Luxeon Star LEDs)
Three pairs of male/female interconnects
24 AWG two-stranded flexible wires
Arduino Software (download from: www.arduino.cc)
LED Controller Program (download from: pharmacology.ucdenver.edu/tucker/reagents)
USB A to USB B cable
Arduino Microcontroller and LCD Keypad
The Arduino Uno is an inexpensive microcontroller supplied on a board base with its own power regulator. A pre-built LCD display with analog input components can be purchased that is compatible with the Arduino (see Materials above). The LCD displays have pins that directly align to the microcontroller board base. As the pins on the LCD display that interact with the Arduino microcontroller can be different for each LCD display, consult the LCD display datasheet specifications to determine which pins are already being used to connect to the Arduino microcontroller. The numbers of these pins (at top of the LCD display) will need to be entered in the downloaded LED Controller program, as specified in the ‘Upload Project’ section. Also on the LCD display, there are available a number of free pins that can be used to connect the LEDs. Again, consult the specifications of the LCD Keypad to identify which pin nodes are not being used. The numbers of these pins will also need to be entered in the downloaded LED Controller program.
Installation of Control modules
Prepare soldering iron, wire, and solder to build the control module. Figure 2 shows the connections between the components of the control module.
-
Use 22 AWG copper wire to solder connections between the Vin and Vout of the LED driver to the positive and negative terminals of the 12-20VDC 1.5A power supply.
For all connections, unless otherwise stated, solder connections using 22AWG solid copper wire.
Solder connections from the LED (+) terminal of the LED driver to the terminal of the interconnect that will serve to connect to the positive terminal of the LED module.
Connect the collector pin (C) of the TIP120 transistor to the terminal of the interconnect that will serve to connect the negative terminal of the LED module.
Connect the emitter pin (E) of the TIP120 transistor to the LED (-) terminal of the LED driver.
Connect the base pin (B) of the TIP120 transistor to a 330Ω resistor. This will eventually be connected the control pins on the microcontroller to control current flow from the LED (+) of the LED driver, through the LED module to the transistor, and finally to the LED (-) of the LED driver.
Solder connections from the 330Ω resistor to a free pin on the Arduino Uno/LCD Keypad shield.
-
Repeat steps 3 – 6, forming junctions where needed.
Emitter pins (E) from each of the TIP120 transistors with share a common junction with the LED (-) pin of the LED driver. A common junction of the LED (+) pin of the LED driver will connect to each of the interconnects which are to connect to the LED module.
Installation of LEDs and Heat sink
This section describes a 4-by-3 LED array appropriate for stimulating a 12-well tissue culture dish, but other configurations are recommended other applications.
For a 4×3 LED configuration, a 130 mm×70 mm rectangular heat sink with hex pin fin rated to 1.5-3 C°/W is appropriate. Adhere LEDs onto the base of the heat sink using thermal tape or thermally conductive epoxy. For stimulation of 12-well culture dishes, it is appropriate to align LEDs such that they are directly above each well in a 4-by-3 array so that each well will receive equal light stimulation.
-
Solder connecting wires to each of the LEDs. Figure 2 shows a 4-by-3 LED array, configured as three series of four LEDs connected in parallel.
Mind the electrical polarity of the LEDs, as LEDs can be permanently damaged if the polarity is reversed. Consult the specifications of the LED driver before using other LED configurations, as not every LED configuration is safe to use with a 2.1A LED driver.
-
Solder the final two terminals of the LED configuration to a length of two-stranded wire. Solder the other side of the two-strand wire to an interconnect such that it may easily be plugged into the control module.
Be sure the polarity interconnects between the LED module and the control module match, else LEDs may be permanently damaged.
Upload Program to the Arduino microcontroller
Download and install the Arduino software package (http://arduino.cc/en/Main/Software)
Open the Arduino Software
Download the LED Controller Program (LEDProgrammer.ino) at: http://pharmacology.ucdenver.edu/tucker/reagents
Open the “LEDProgrammer.ino” file using the Arduino SoftwareDepending on the LCD Keypad components purchased, the code file may need to be changed. Check “User Defined Parameters” in the “LEDProgrammer.ino” file
Connect the Arduino Uno to a computer via a USB A to USB B cable.
-
Click “Upload”
Most issues associated with uploading code to the Arduino can be resolved at (http://arduino.cc/en/Guide/HomePage)
Remove the Arduino from the computer and connect to the 12-20VDC, 1.5A power supply. If uploaded properly, LCD should display “Starting…”
If using an alternative LCD Keypad Shield, it may be necessary to reset button values on the LCD keypad shield. To enter button reset mode, hold any button during startup until prompted to release. Follow the onscreen instructions. Default button values can be restored by uploading the “LEDProgrammer.ino” file to the Arduino.
Controlling and programming LED light supply
Connect LED modules to control modules via installed interconnects
Each of the three outputs may be programmed independently via the LCD interface.
From the main screen, cycle through outputs 1 through 3 using the UP or DOWN buttons. The cursor indicates which item is selected.
Press SELECT to move to the edit page of the selected output program
Cycle through the DURATION, INTERVAL, and INTENSITY using the UP or DOWN buttons.
To edit an item, press the RIGHT button to move the cursor and hold the UP or DOWN buttons to change the values. Press LEFT to again cycle through items.
Press SELECT to return to main screen.
Turn on an output program, use UP or DOWN to select an output. Press RIGHT, and then use UP or DOWN to turn output's program ‘on’ or ‘off.’ By default, all outputs are ‘off’ upon Arduino start up. If an output is running, a countdown timer will display indicating time until next scheduled flash.
Reagents and Solutions
HEPES imaging buffer (in mM)
130 NaCl
5 KCl
2 CaCl2
10 HEPES
30 D-Glucose
1 MgCl2
pH to 7.4 using 5M NaOH
Salmon sperm DNA (ssDNA, 2 mg/ml)
200 mg DNA Sodium Salt Type III from Salmon Testes, Sigma D1626)
100 ml TE (10 mM Tris-HCl pH8.0, 1 mM EDTA)
Mix well by pipetting, then stir for several hours to overnight (at 4°C) until dissolved.
Store at -20°C in 1 ml aliquots. Immediately before use, boil 5 min and place on ice.
50% PEG
250 g PEG 4000
ddH2O to 500 ml
stir 30 min until PEG is in solution. Filter sterilize (0.45 um filter) and store tightly capped, as the final concentration during transformation is critical.
YPD liquid
10g Yeast extract
20g Peptone
20g Dextrose
ddH2O to 1 liter
Autoclave 20 minutes at 120 °C and store at room temperature
100X Trp-/Leu-/Ura- dropout
0.2 g histidine in 100 ml
Autoclave and store at room temperature
Supplement amino acid powder (can also be purchased, Sigma Y2001)
473mg adenine hemisulfate
2g alanine
2g arginine hydrochloride
2g asparaginine monohydrate
2g aspartic acid
2g cysteine hcl monohydrate
2g glutamic acid monosodium
2g glutamine
2g glycine
2g myo-inositol
2g isoleucine
2g lysine monohydrochloride
2g methionine
210 mg p-aminobenzoic acid (PABA)
2g phenylalanine
2g proline
2g serine
2g threonine
2g tyrosine disodium salt
2g valine
2X SC -4aa
3.4g yeast nitrogen base (without amino acids or ammonium sulfate)
10g ammonium sulfate
2.8g supplement amino acid powder
ddH2O to 1 liter
Prepare as 250 ml aliquots in 500 ml bottles for autoclaving.
Store at room temperature
SC –Trp/-Leu/-His media (recipe for 10 ml, scale as needed)
5 ml 2X SC -4aa
0.4 ml 50% glucose (prepared in 100 ml bottles and autoclaved)
0.1 ml 100X Trp-/Leu-/Ura- (also known as 100X His+)
ddH2O to 10 ml
SC –Trp/-Leu/-His plates (recipe for ∼50 plates, scale as needed)
In one 1 L bottle, add 18 g bactoagar in 500 ml ddH2O.
In other bottle, add:
1.7g yeast nitrogen base
5g ammonium sulfate
ddH2O to 500 ml
Bring pH to 5.9 with NaOH. Autoclave. Mix two bottles together.
Add:
40 ml 50% glucose (autoclaved separately)
10 ml 100X Trp-/Leu-/Ura- dropout.
Pour plates when cool enough to touch with gloved hand. Flame top to remove any bubbles.
Commentary
Background Information
The concept of using light to drive biology has largely emerged from neuroscientists' desire to remotely control neural activity. Pioneering optical methods combined light with “caged” or photo-labile chemical compounds that release bioactive molecules upon photoexcitation. Allowing acute manipulation of important cellular signaling molecules and neurotransmitters, these approaches have allowed dissection of cellular signaling pathways as they relate to cellular physiology on fast timescales in local domains (Adams and Tsien, 1993; Callaway and Katz, 1993; Ellis-Davies, 2007; Wang and Augustine, 1995). While these tools are powerful and remain widely used, significant limitations include difficulties with cell permeability, expense of reagents, and an inability to target specific cell types. These limitations can be overcome by using genetically-encoded systems that make use of protein photoreceptors as optical actuators of biological processes. The earliest genetically-encoded systems for driving neural activity relied on photoreceptor visual pigments, expressed along with their cognate G-proteins and arrestin (Zemelman et al., 2002). A breakthrough technology was the implementation of light-gated ion channels (channelrhodopsin and its variants) and pumps (halorhodopsin, archaerhodopsin and variants), which allow precise light control of neuronal firing in an entirely genetically-encoded tool (Boyden et al., 2005; Han and Boyden, 2007; Yizhar et al., 2011; Zhang et al., 2007). While these tools have been rapidly assimilated by the neuroscience community, new classes of more generalizable optical tools are being developed that will have high impact in cell biology, where tools that allow precise temporal and spatial control of protein activity in live cells have been highly sought after. Pharmacological and “chemical genetic” strategies such as chemical inhibitors or chemical inducers of dimerization (Spencer et al., 1993) allow fast temporal control of cellular processes, but compounds can be expensive, target only a limited number of proteins/pathways, take time to deliver to and remove from cells, and provide no spatial resolution. As emerging optogenetic tools are developed to overcome these limitations, we expect them to become widely adopted within the cell biology community.
Critical parameters
1) Choice of photoreceptor actuator module
When designing an experiment using optical dimerizer tools, a number of fundamental parameters must be considered. A variety of optical dimerization systems exist, and the answers to the basic questions below will help determine which system is best suited for the proposed experiments. Below, we discuss these questions in light of the properties of the current set of optical dimerizer modules available. We have included a table (Table 1) describing the basic properties of all published photomodules for controlling protein interactions. We expect this list to rapidly grow, based on the accelerating pace of optical tool development.
Table 1. Optogenetic modules for controlling protein interactions.
| Photoreceptor system | Typical excitation λ | Lifetime (half-life) | Interacting protein(s) | Size (aa) | Chromophore | References |
|---|---|---|---|---|---|---|
| CRY2 | Blue (450-488) | 5.5 min | CIB1 | 498 (PHR) / 613 (FL) | FAD | (Kennedy et al., 2010) |
| PhyB | Pr form: red (660 nm)<break/>Pfr form: Far-red (740 nm) | > 21 hrs in mammalian cells (Müller et al., 2013b); switching inducible with red/far-red light | PIF family members | 908 (used with PIF6) / 621 (used with PIF3) | phytochromobilin (PΦB)<break/>*can substitute phycocyanobilin (PCB) | (Levskaya et al., 2009; Shimizu-Sato et al., 2002; Toettcher et al., 2011) |
| Engineered AsLOV2-peptide (TULIPs, LOV-ipaA) | Blue (450-488 nm) | Tunable with sec to min half-lives | Peptide binding domain | 145 | FMN | (Lungu et al., 2012; Strickland et al., 2012) |
| FKF1 (LOV) | Blue | 62.5 hrs (in vitro)<break/>(Zikihara et al., 2006) | GIGANTEA | 167 | FMN | (Yazawa et al., 2009) |
| VVD | Blue | tunable | VVD | 150 | FMN | (Nihongaki et al., 2014) |
| UVR8 | UV-B (290-315 nm) | > 8 hrs in mammalian cells | UVR8 | 440 | Tryptophan | (Chen et al., 2013) |
| UVR8 | UV-B (290-315 nm) | COP1 | 440 | Tryptophan | (Crefcoeur et al., 2013; Müller et al., 2013a) | |
| Dronpa | 488 nm monomerizes/ 390 nm dimerizes | Switching inducible with 500 / 390 nm light | Dronpa | 224 | hydroxybenzylidine (tyrosyl side chain) moiety | (Zhou et al., 2012) |
Would the process under investigation be best driven by photo-association or photo-dissociation of protein interactions? Alternatively, do you need both photo-association AND photo-dissociation for optimal control? Most engineered optical dimerizers promote protein interaction with light, but two systems (Dronpa/Dronpa and UVR8/UVR8) allow protein dissociation with light. In general, these will be used for different applications. For example, the UVR8/UVR8 interaction has been used to sequester proteins in the endoplasmic reticulum for release with light (Chen et al., 2013). The PhyB/PIF dimerizers (both PhyB/PIF6 and phyB/PIF3) and Dronpa are the only modules so far developed that allow light control of both protein association and dissociation (Levskaya et al., 2009; Shimizu-Sato et al., 2002; Zhou et al., 2012), although the PhyB system also requires the addition of a chromophore cofactor that is not present in most non-plant model organisms (e.g. mammals, flies, worms and yeast).
How long does the interaction need to last? All photoreceptor proteins have natural dark reversion rates, in which a photoexcited protein will revert to the ground state when placed in darkness after light excitation. The dark reversion rate is specific to each photoreceptor, and can vary from seconds to hours depending on the photoreceptor. For photo-induced dimerizers, the time of dark reversion governs how long the photoreceptor remains interacting with its partner protein. Thus, for precise local control of a protein process, where we seek to locally stimulate an activity with light but have it rapidly turn off when light is withdrawn, systems that naturally revert with a sub-minute half-life are ideal, especially if the target protein is rapidly diffusible (i.e. in subcellular targeting experiments, activated protein will rapidly diffuse away from the site of illumination, but remain active unless the reversion rate is fast). Alternatively, for applications in which prolonged activity is required (e.g. minutes to hours), systems allowing extended activation in response to a single light pulse are desired, as these require less light input. The systems with the fastest off-rates are based on the LOV-domain dimerizers (Lungu et al., 2012; Strickland et al., 2012). LOV-based systems also exist that have half-lives on the order of minutes to hours, either naturally or due to engineered mutations in the LOV domain (Nihongaki et al., 2014; Strickland et al., 2012; Yazawa et al., 2009). The CRY2/CIB1 interaction also decays within minutes (t ½ ∼5.5 min) (Kennedy et al., 2010). The most long-lived interactions are those between phyB and PIF family proteins (Levskaya et al., 2009; Shimizu-Sato et al., 2002) and COP1/UVR8 (Crefcoeur et al., 2013; Müller et al., 2013a; Rizzini et al., 2011). The half-life of the PhyB/PIF6 interaction is prolonged in mammalian cells, with one study using these modules to regulate transcription in mammalian cells showing no loss of activity after 21 hours in the dark (Müller et al., 2013b). However, as noted above, the PhyB/PIF interaction can also be reversibly dissociated by application of far-red light, and thus lifetime can be precisely tuned (Levskaya et al., 2009; Shimizu-Sato et al., 2002). Finally, the UVR8/UVR8 and Dronpa/Dronpa interactions can be disrupted with a single exposure to light (Chen et al., 2013; Rizzini et al., 2011; Zhou et al., 2012). UVR8 remains a monomer for at least eight hours after light exposure in mammalian cells (Chen et al., 2013; Christie et al., 2012; Wu et al., 2012). However, plants express factors (RUP1 and RUP2) that promote re-dimerization of UVR8 within minutes, providing a potential strategy to quickly reverse photo-induced monomerization (Heijde and Ulm, 2013). Dronpa has been shown to re-oligomerize with application of 400 nm light (Zhou et al., 2012).
Do you need to stimulate cells focally or globally? One consideration in choice of an optical dimerization system is whether the experiment can be carried out using global stimulation, in which case a LED array or (in some cases) even full spectrum benchtop lighting is all that is needed, or whether precise focal stimulation of specific cells or subcellular regions of cells is required. For focal stimulation, we use laser lines combined with photobleaching/FRAPPA instrumentation (see detailed discussion below). While these are widely available for stimulation in blue and red/far-red wavelengths, there are no current off-the-shelf systems for precise, local stimulation of UVR8, which can only be stimulated by light below ∼320 nm.
Does your light need to penetrate deep within a tissue? Another consideration when choosing an optical dimerizer is whether the light needs to penetrate deeply into cells/tissues/organisms. While UV and blue light penetrate tissue fairly poorly, far-red/near-infrared light will penetrate much farther. The CRY2/CIB system can be stimulated with blue light (typically we use 460-488 nm), but can also be stimulated by two-photon microscopy at wavelengths from 820-980 nm, which vastly improves tissue penetration. Multi-photon excitation of UVR8 has also been tested (Chen et al., 2013), but was not observed using a two-photon source tuned to 690 nm (the shortest wavelength possible for most conventional pulsed laser sources). Other blue light systems (LOV, Dronpa) may also be able to be stimulated by two-photon excitation, but this has not been reported.
Is light toxicity a concern? Blue and in particular UV light can be toxic to cells, and steps should be taken to minimize exposure, especially for sensitive cells such as neurons. Thus, for extended light treatment, we ‘pulse’ cells with light using a duty-cycle that is dependent on the photoreceptor dark reversion rate. In general, light pulsed at a frequency of half the half-life (for example, 1s pulse applied every 3 min for CRY2/CIB) is typically sufficient for near-maximal (>80%) stimulation, and we have observed no toxicity in cultured mammalian cells or neurons with this type of light treatment using a 461 nm blue light LED source.
2) Choice of fluorophores
In many experiments, fluorescent biosensors are used as readouts for the process under investigation. Because the excitation spectrum for many commonly used fluorescent probes overlaps with photoreceptor excitation spectra, the choice of fluorescent tags for observing the process being optically controlled is crucial. Here we discuss the compatibility of commonly used fluorescent proteins with the CRY2 and UVR8 systems.
CRY2
Arabidopsis CRY2 displays a broad excitation spectrum, with peaks in the blue (450 nm) and UV (380 nm). Thus, CRY2 is readily excited by commonly used laser lines and excitation filters used for imaging GFP and CFP. For example 488nm and 405nm lasers both excite CRY2 at powers equal to or below those used to image GFP and CFP (or their respective variants). In addition, the CRY2 excitation spectrum has a long tail that extends into the green/red spectrum. We have tried with limited success to use a 514 nm laser to image YFP without exciting CRY2 but this approach required very low power illumination and will necessitate very stringent controls to ensure CRY2 is not being stimulated (Kennedy et al., 2010). While blue light used to image GFP or CFP will also excite CRY2, strategic experimental design can allow use of GFP, CFP, or YFP fluorescent tags in imaging experiments. For example, we routinely use the 488nm laser line to excite CRY2 through the microscope objective while simultaneously imaging GFP. Thus, the first image taken will provide a ‘dark’ baseline, but will also photostimulate the process CRY2 is controlling.
To image a fluorescent readout without photoexcitation, for example when focally stimulating light in a region of the cell or when we need to acquire a background timecourse of activity before CRY2 stimulation, we typically use mCherry, tdTomato or dsRED, with a 561 nm laser as an excitation source. For epifluorescent imaging, one must be careful in choosing the filter sets used for imaging RFP variants as many contain bandpass excitation filters that transmit excitation light down to ∼530nm (e.g. many CY3/TRITC sets). These should be avoided. We use an excitation filter centered at 572nm with a 28 nm bandpass (572/28 Brightline, Semrock) with a metal halide excitation source (Lumen200, Prior). Also, while we find that low to moderate 561 nm laser excitation does not appreciably excite CRY2, high levels of 561 nm excitation for prolonged periods will at least partially photoactivate CRY2, and this possibility should be considered any time dark background is high (see Troubleshooting, below).
For two-color imaging, far-red fluorescent proteins such as iRFP (Filonov et al., 2011) can also be used that can be activated with excitation in the 640-650 nm spectrum. Such a strategy was used for dual color (mCherry and iRFP) imaging of phosphoinositide regulation by a CRY2-fused lipid kinase and phosphatase (Idevall-Hagren et al., 2012).
UVR8
UVR8 uses tryptophan as a chromophore and thus its excitation profile is strong in the UVB region (∼280 nm-315 nm) and drops off rapidly at ∼315-320 nm. We have found that excitation light from 405 to 641 nm does not excite UVR8. Thus, UVR8 is compatible with CFP, GFP and RFP variants as well as photoswitchable proteins (e.g. paGFP, mEOS) that require UV (405 nm) excitation.
3) Choice of photoexcitation device
Choice of a light source for photoexcitation depends on whether the experiment requires global or focal stimulation of cells, and whether live cell imaging is required. For global stimulation (cells in tissue culture, yeast growing on plates or in media, or even whole organisms), we typically use LED arrays that deliver precise amounts of wavelength-specific light and can easily fit into incubators. LOV and CRY-based systems can be stimulated with blue LEDs (450-460 nm), which are typically pulsed as described above, in a manner dependent on their half-life. For global phyB stimulation, we use a red LED light to induce binding to PIF proteins (660 nm) and a far red light to induce dissociation (740 nm). In this case, as a single pulse of light is sufficient for long-lasting interaction or dissociation, we manually flash samples using a hand-held device. For UVR8, to stimulate dissociation of UVR8/UVR8 or association of UVR8/COP1, we also manually flash samples using a compact UVB light source.
Many experiments require live cell imaging coordinate with light treatment. In these cases, light can be delivered from a fluorescent microscope, equipped with wavelength-specific illumination (e.g. appropriately filtered metal halide/mercury source or fiber-coupled laser). LOV and CRY systems can be easily stimulated by fluorescent light sources designed for imaging GFP (488 nm). PhyB can be stimulated with a red (647 nm) laser, often used for imaging commonly used far-red dyes such as Alexa647 and Cy5. In the absence of a fluorescent/laser device in the appropriate wavelength, experimenters can also place a hand-held LED device on top of the sample (imaged in an inverted microscope) and manually stimulate cells.
For focal stimulation of cells or regions of cells, a “steerable” light source is required to direct the excitation light to the sample. Perhaps the simplest way to accomplish this is using a point scanning confocal microscope. Most software packages on commercial scanning confocal microscopes easily allow users to define regions to illuminate for photoconversion or fluorescence recovery after photobleaching (FRAP) experiments. The same basic approach can be used for photoexciting optogenetic modules, with the understanding that far less excitation energy will be required compared to a FRAP experiment. The exact energy will have to be empirically determined for each microscopy system. For camera-based imaging systems (e.g. wide field epifluorescence, spinning disc confocal), local stimulation will require an auxiliary set of scanning mirrors, typically driven by galvanometers. We use the FRAPPA unit (Andor Technologies) but several commercial and custom options exist. Alternatively, local excitation can be achieved by exciting the sample at a fixed spot (obviating the need for scanning mirrors) and moving the specimen stage.
CRY2
As most of our experiments are performed on live cells, we use a spinning disk confocal scan head to illuminate the sample with exposure times ranging from 10 to 50 ms (50mW laser set at 50%). This range of exposure times is sufficient to fully activate CRY2. As a rule of thumb, excitation power sufficient to image GFP will also excite CRY2. Alternatively, CRY2 can be excited by any commonly used GFP filter cube with a metal halide or mercury light source if laser-based imaging is not available.
UVR8
UVR8 is not excited by commonly used laser lines for confocal imaging, thus 405, 488, 561nm lasers will not activate UVR8. UVR8 requires excitation in the UVB region (∼280-315 nm). We use diffuse excitation light from a UV lamp (312nm, model EB280C, Spectroline) positioned 6 cm from the sample. Excitation for 5-10 seconds with this source is sufficient to activate >90% of the UVR8. We found that longer exposures (>15 sec) led to increased cellular toxicity and should be avoided. In some experiments we positioned an electronically controlled shutter in between the sample and light source to precisely deliver the excitation illumination.
Troubleshooting
Treatment of dark samples
Prior to the experiment, it is critically important to protect samples from photoexcitation. During sample preparation, a wavelength specific safelight should be used. For blue light stimulated systems (LOV, CRY), a red LED light (∼650 nm) can serve as safelight. An inexpensive red LED bike light works well for this purpose. Samples are wrapped in foil during incubations, between treatments, and during transport. We use a light-tight environmental chamber that encloses the microscope so that light from the computer monitors doesn't reach the sample, but strategic use of darkroom cloth can also effectively protect the sample from inadvertent light exposure.
For CRY2 experiments requiring transmitted light, we use a 45mm Schott RG610 long pass light filter (available from Chroma) in the transmitted light path of our Olympus IX71 microscope stand. During microscopy, it is prudent to carry out controls demonstrating that samples are not being stimulated under the baseline imaging/handling conditions. This requires a control system with a robust readout for activation. For example the membrane recruitment of CRY2-mCh in cells expressing CIB-GFPCaaX is a robust readout for CRY2 activation (based on the dramatic re-distribution of CRY2mCh to the plasma membrane upon photoexcitation). If baseline activation is noted, the likely culprit is the excitation light used for imaging the sample or the excitation light used to find cells for imaging. Ensure that laser lines for imaging red fluorophores are 561nm or longer and that excitation filters for epi-fluorescent visualization/imaging block excitation light less than 560 nm. If the imaging excitation light is triggering CRY2 activation, binning camera pixels can greatly increase sensitivity (at the cost of resolution), allowing much dimmer excitation light to be used.
For UVR8, ambient room light will not excite the photoreceptor, nor will excitation light used for imaging commonly used fluorophores (e.g. 405, 488, 561, 641).
Engineering photoreceptor fusions
CRY2
We have found both N-terminal and C-terminal fusions of CRY2 to effectively photo-dimerize with CIB1 fusion proteins. Likewise, CIB1 was able to dimerize with photo-activated CRY2 when it was fused to either the N- or C-termini of target proteins. However, these interactions can be context-dependent, and depend on the target protein fused. An important consideration when generating any fusion protein is also the linker sequence separating the photoreceptor from the target, which can be modified as needed.
UVR8
Likewise, we found both N- and C-terminal UVR8 fusions to effectively form homodimers in the dark that could be disrupted with UVB excitation. We have had success releasing UVR8-fused proteins from the endoplasmic reticulum when the UVR8 is fused to the cytosolic domain of the target protein but no luminal-domain fusions have worked thus far.
Anticipated results
UVR8 secretory trafficking: In cells expressing UVR8-sequestered cargo, UVB excitation will lead to a rapid (within 1-2 min) conversion of the cargo from punctate to diffusely distributed throughout the ER (Movie 1). The maximum fluorescence intensity of the cargo tag will dramatically decrease (over 1-2 min.) as the clusters disperse into the ER and subsequently increase over the next 10-15 min. as cargo is concentrated in the peri-nuclear Golgi complex. Golgi signal will then subside over the next ∼30-45 minutes as post-Golgi carriers are generated and cargo is transported to the plasma membrane. Small post-Golgi carriers ranging in size from diffraction limited (<250nm) to ∼1 um in diameter should become evident within 30-45 minutes of UVB exposure (Chen et al., 2013). Movie 1 shows a typical experiment where UVB triggers secretion of VSVG-YFP-2xUVR8 in a COS7 cell.
CRY2 control of protein localization: In a typical experiment where factors are being recruited to the cellular plasma membrane via the CRY2/CIB interaction, blue light activation leads to rapid (within tens of milliseconds) redistribution of soluble protein to the plasma membrane (Kennedy et al., 2010). Target protein accumulation at the plasma membrane will peak ∼15-20 s following blue light exposure. If cells are then protected from blue light, the target protein should return to the cytoplasm with a half time of ∼6 min. A second blue light pulse should drive redistribution to the same extent as the first (Kennedy et al., 2010).
CRY2-triggered transcription: Transcription should be stimulated in blue light, and blocked/reduced (depending on the construct) in the dark. Use of CRY2PHR tends to give higher levels of transcriptional activation with blue light, but also high background in the dark, thus if tight light control is important use full length CRY2. Depending on the expression plasmid used (and the number of lexA operator sites), the degree of transcriptional activation with light may vary considerably.
Time considerations
In the simplest experiments, photoreceptor fusion proteins are transfected into cultured cells and experiments can be carried out within 10-24 hours. For yeast transcription experiments, growing the yeast after transformation takes several days, after which experiments can be quickly accomplished. As these tools become validated, researchers are beginning to engineer transgenic organisms for in vivo use. For example, transgenic flies harboring the light-inducible cre recombinase system have been developed (Boulina et al., 2013; Kennedy et al., 2010). In this case it is prudent to fully validate the constructs in simple culture models prior to the time and cost consuming investment of making transgenic animals, which, depending on the organism can take months or years to generate.
Supplementary Material
Movie 1. Left panel: Shown is a COS7 cell expressing VSVG-YFP-2xUVR8 (green) along with soluble mCherry (red). Right panel: Same data as in the left panel but only the YFP signal is displayed in grey scale with a higher contrast so that the YFP signal can be visualized following dispersion of the bright VSVG clusters. The dot in the upper left corner indicates delivery of 7 sec. of UVB illumination to disperse the VSVG clusters. This video was captured at 1 frame/min. and the dimensions of each panel are 28.1 μm by 25.9 μm.
Acknowledgments
The work described in this protocol was supported by grants from National Institutes of Health (NS082271) M.J.K., (GM100225) C.L.T., The McKnight Foundation (M.J.K. and C.L.T.), The Brain Reasearch Foundation (M.J.K. and C.L.T.) and the Brain and Behavior Research Foundation (M.J.K.).
References
- Adams SR, Tsien RY. Controlling cell chemistry with caged compounds. Annu Rev Physiol. 1993;55:755–784. doi: 10.1146/annurev.ph.55.030193.003543. [DOI] [PubMed] [Google Scholar]
- Aoki K, Kumagai Y, Sakurai A, Komatsu N, Fujita Y, Shionyu C, Matsuda M. Stochastic ERK activation induced by noise and cell-to-cell propagation regulates cell density-dependent proliferation. Mol Cell. 2013;52:529–540. doi: 10.1016/j.molcel.2013.09.015. [DOI] [PubMed] [Google Scholar]
- Boncompain G, Divoux S, Gareil N, de Forges H, Lescure A, Latreche L, Mercanti V, Jollivet F, Raposo G, Perez F. Synchronization of secretory protein traffic in populations of cells. Nat Methods. 2012;9:493–498. doi: 10.1038/nmeth.1928. [DOI] [PubMed] [Google Scholar]
- Bonger KM, Rakhit R, Payumo AY, Chen JK, Wandless TJ. General method for regulating protein stability with light. ACS Chem Biol. 2014;9:111–115. doi: 10.1021/cb400755b. [DOI] [PMC free article] [PubMed] [Google Scholar]
- Boulina M, Samarajeewa H, Baker JD, Kim MD, Chiba a. Live imaging of multicolor-labeled cells in Drosophila. Development. 2013;140:1605–1613. doi: 10.1242/dev.088930. [DOI] [PMC free article] [PubMed] [Google Scholar]
- Boyden ES, Zhang F, Bamberg E, Nagel G, Deisseroth K. Millisecond-timescale, genetically targeted optical control of neural activity. Nat Neurosci. 2005;8:1263–1268. doi: 10.1038/nn1525. [DOI] [PubMed] [Google Scholar]
- Callaway EM, Katz LC. Photostimulation using caged glutamate reveals functional circuitry in living brain slices. Proc Natl Acad Sci U S A. 1993;90:7661–7665. doi: 10.1073/pnas.90.16.7661. [DOI] [PMC free article] [PubMed] [Google Scholar]
- Chen D, Gibson ES, Kennedy MJ. A light-triggered protein secretion system. J Cell Biol. 2013;201:631–640. doi: 10.1083/jcb.201210119. [DOI] [PMC free article] [PubMed] [Google Scholar]
- Christie JM, Arvai AS, Baxter KJ, Heilmann M, Pratt AJ, O'Hara A, Kelly SM, Hothorn M, Smith BO, Hitomi K, et al. Plant UVR8 photoreceptor senses UV-B by tryptophan-mediated disruption of cross-dimer salt bridges. Science. 2012;335:1492–1496. doi: 10.1126/science.1218091. [DOI] [PMC free article] [PubMed] [Google Scholar]
- Crefcoeur RP, Yin R, Ulm R, Halazonetis TD. Ultraviolet-B-mediated induction of protein-protein interactions in mammalian cells. Nat Commun. 2013;4:1779. doi: 10.1038/ncomms2800. [DOI] [PubMed] [Google Scholar]
- Ellis-Davies GC. Caged compounds: photorelease technology for control of cellular chemistry and physiology. Nat Methods. 2007;4:619–628. doi: 10.1038/nmeth1072. [DOI] [PMC free article] [PubMed] [Google Scholar]
- Filonov GS, Piatkevich KD, Ting LM, Zhang J, Kim K, Verkhusha VV. Bright and stable near-infrared fluorescent protein for in vivo imaging. Nat Biotechnol. 2011;29:757–761. doi: 10.1038/nbt.1918. [DOI] [PMC free article] [PubMed] [Google Scholar]
- Han X, Boyden ES. Multiple-color optical activation, silencing, and desynchronization of neural activity, with single-spike temporal resolution. PLoS One. 2007;2:e299. doi: 10.1371/journal.pone.0000299. [DOI] [PMC free article] [PubMed] [Google Scholar]
- Heijde M, Ulm R. Reversion of the Arabidopsis UV-B photoreceptor UVR8 to the homodimeric ground state. Proc Natl Acad Sci U S A. 2013;110:1113–1118. doi: 10.1073/pnas.1214237110. [DOI] [PMC free article] [PubMed] [Google Scholar]
- Hughes RM, Bolger S, Tapadia H, Tucker CL. Light-mediated control of DNA transcription in yeast. Methods. 2012;58:385–391. doi: 10.1016/j.ymeth.2012.08.004. [DOI] [PMC free article] [PubMed] [Google Scholar]
- Idevall-Hagren O, Dickson EJ, Hille B, Toomre DK, De Camilli P. Optogenetic control of phosphoinositide metabolism. Proc Natl Acad Sci U S A. 2012 doi: 10.1073/pnas.1211305109. [DOI] [PMC free article] [PubMed] [Google Scholar]
- Inoue T, Heo WD, Grimley JS, Wandless TJ, Meyer T. An inducible translocation strategy to rapidly activate and inhibit small GTPase signaling pathways. Nat Methods. 2005;2:415–418. doi: 10.1038/nmeth763. [DOI] [PMC free article] [PubMed] [Google Scholar]
- Kakumoto T, Nakata T. Optogenetic Control of PIP3: PIP3 Is Sufficient to Induce the Actin-Based Active Part of Growth Cones and Is Regulated via Endocytosis. PLoS One. 2013;8:e70861. doi: 10.1371/journal.pone.0070861. [DOI] [PMC free article] [PubMed] [Google Scholar]
- Keller P, Toomre D, Díaz E, White J, Simons K. Multicolour imaging of post-Golgi sorting and trafficking in live cells. Nat Cell Biol. 2001;3:140–149. doi: 10.1038/35055042. [DOI] [PubMed] [Google Scholar]
- Kennedy MJ, Hughes RM, Peteya LA, Schwartz JW, Ehlers MD, Tucker CL. Rapid blue-light-mediated induction of protein interactions in living cells. Nat Methods. 2010;7:973–975. doi: 10.1038/nmeth.1524. [DOI] [PMC free article] [PubMed] [Google Scholar]
- Konermann S, Brigham MD, Trevino A, Hsu PD, Heidenreich M, Le Cong, Platt RJ, Scott DA, Church GM, Zhang F. Optical control of mammalian endogenous transcription and epigenetic states. Nature. 2013;500:472–476. doi: 10.1038/nature12466. [DOI] [PMC free article] [PubMed] [Google Scholar]
- Krauss U, Lee J, Benkovic SJ, Jaeger KE. LOVely enzymes - towards engineering light-controllable biocatalysts. Microb Biotechnol. 2010;3:15–23. doi: 10.1111/j.1751-7915.2009.00140.x. [DOI] [PMC free article] [PubMed] [Google Scholar]
- Lee J, Natarajan M, Nashine VC, Socolich M, Vo T, Russ WP, Benkovic SJ, Ranganathan R. Surface sites for engineering allosteric control in proteins. Science (80-) 2008;322:438–442. doi: 10.1126/science.1159052. [DOI] [PMC free article] [PubMed] [Google Scholar]
- Levskaya A, Weiner OD, Lim WA, Voigt CA. Spatiotemporal control of cell signalling using a light-switchable protein interaction. Nature. 2009;461:997–1001. doi: 10.1038/nature08446. [DOI] [PMC free article] [PubMed] [Google Scholar]
- Lungu OI, Hallett RA, Choi EJ, Aiken MJ, Hahn KM, Kuhlman B. Designing photoswitchable peptides using the AsLOV2 domain. Chem Biol. 2012;19:507–517. doi: 10.1016/j.chembiol.2012.02.006. [DOI] [PMC free article] [PubMed] [Google Scholar]
- Müller K, Engesser R, Schulz S, Steinberg T, Tomakidi P, Weber CC, Ulm R, Timmer J, Zurbriggen MD, Weber W. Multi-chromatic control of mammalian gene expression and signaling. Nucleic Acids Res. 2013a;41:e124. doi: 10.1093/nar/gkt340. [DOI] [PMC free article] [PubMed] [Google Scholar]
- Müller K, Engesser R, Metzger S, Schulz S, Kämpf MM, Busacker M, Steinberg T, Tomakidi P, Ehrbar M, Nagy F, et al. A red/far-red light-responsive bi-stable toggle switch to control gene expression in mammalian cells. Nucleic Acids Res. 2013b;41:e77. doi: 10.1093/nar/gkt002. [DOI] [PMC free article] [PubMed] [Google Scholar]
- Nihongaki Y, Suzuki H, Kawano F, Sato M. Genetically engineered photoinducible homodimerization system with improved dimer-forming efficiency. ACS Chem Biol. 2014;9:617–621. doi: 10.1021/cb400836k. [DOI] [PubMed] [Google Scholar]
- Presley JF, Cole NB, Schroer TA, Hirschberg K, Zaal KJ, Lippincott-Schwartz J. ER-to-Golgi transport visualized in living cells. Nature. 1997;389:81–85. doi: 10.1038/38001. [DOI] [PubMed] [Google Scholar]
- Renicke C, Schuster D, Usherenko S, Essen LO, Taxis C. A LOV2 domain-based optogenetic tool to control protein degradation and cellular function. Chem Biol. 2013;20:619–626. doi: 10.1016/j.chembiol.2013.03.005. [DOI] [PubMed] [Google Scholar]
- Rivera VM, Wang X, Wardwell S, Courage NL, Volchuk A, Keenan T, Holt DA, Gilman M, Orci L, Cerasoli F, et al. Regulation of protein secretion through controlled aggregation in the endoplasmic reticulum. Science. 2000;287:826–830. doi: 10.1126/science.287.5454.826. [DOI] [PubMed] [Google Scholar]
- Rizzini L, Favory JJ, Cloix C, Faggionato D, O'Hara A, Kaiserli E, Baumeister R, Schäfer E, Nagy F, Jenkins GI, et al. Perception of UV-B by the Arabidopsis UVR8 protein. Science. 2011;332:103–106. doi: 10.1126/science.1200660. [DOI] [PubMed] [Google Scholar]
- Schmidt D, Tillberg PW, Chen F, Boyden ES. A fully genetically encoded protein architecture for optical control of peptide ligand concentration. Nat Commun. 2014;5:3019. doi: 10.1038/ncomms4019. [DOI] [PMC free article] [PubMed] [Google Scholar]
- Shimizu-Sato S, Huq E, Tepperman JM, Quail PH. A light-switchable gene promoter system. Nat Biotechnol. 2002;20:1041–1044. doi: 10.1038/nbt734. [DOI] [PubMed] [Google Scholar]
- Spencer DM, Wandless TJ, Schreiber SL, Crabtree GR. Controlling signal transduction with synthetic ligands. Science (80-) 1993;262:1019–1024. doi: 10.1126/science.7694365. [DOI] [PubMed] [Google Scholar]
- Strickland D, Moffat K, Sosnick TR. Light-activated DNA binding in a designed allosteric protein. Proc Natl Acad Sci U S A. 2008;105:10709–10714. doi: 10.1073/pnas.0709610105. [DOI] [PMC free article] [PubMed] [Google Scholar]
- Strickland D, Lin Y, Wagner E, Hope CM, Zayner J, Antoniou C, Sosnick TR, Weiss EL, Glotzer M. TULIPs: tunable, light-controlled interacting protein tags for cell biology. Nat Methods. 2012;9:379–384. doi: 10.1038/nmeth.1904. [DOI] [PMC free article] [PubMed] [Google Scholar]
- Toettcher JE, Gong D, Lim WA, Weiner OD. Light control of plasma membrane recruitment using the Phy-PIF system. Meth Enzym. 2011;497:409–423. doi: 10.1016/B978-0-12-385075-1.00017-2. [DOI] [PMC free article] [PubMed] [Google Scholar]
- Toettcher JE, Weiner OD, Lim WA. Using optogenetics to interrogate the dynamic control of signal transmission by the ras/erk module. Cell. 2013;155:1422–1434. doi: 10.1016/j.cell.2013.11.004. [DOI] [PMC free article] [PubMed] [Google Scholar]
- Toomre D, Steyer JA, Keller P, Almers W, Simons K. Fusion of constitutive membrane traffic with the cell surface observed by evanescent wave microscopy. J Cell Biol. 2000;149:33–40. doi: 10.1083/jcb.149.1.33. [DOI] [PMC free article] [PubMed] [Google Scholar]
- Wang SS, Augustine GJ. Confocal imaging and local photolysis of caged compounds: dual probes of synaptic function. Neuron. 1995;15:755–760. doi: 10.1016/0896-6273(95)90167-1. [DOI] [PubMed] [Google Scholar]
- Wend S, Wagner HJ, Müller K, Zurbriggen MD, Weber W, Radziwill G. Optogenetic Control of Protein Kinase Activity in Mammalian Cells. ACS Synth Biol. 2013 doi: 10.1021/sb400090s. [DOI] [PubMed] [Google Scholar]
- Wu D, Hu Q, Yan Z, Chen W, Yan C, Huang X, Zhang J, Yang P, Deng H, Wang J, et al. Structural basis of ultraviolet-B perception by UVR8. Nature. 2012;484:214–219. doi: 10.1038/nature10931. [DOI] [PubMed] [Google Scholar]
- Wu YI, Frey D, Lungu OI, Jaehrig A, Schlichting I, Kuhlman B, Hahn KM. A genetically encoded photoactivatable Rac controls the motility of living cells. Nature. 2009;461:104–108. doi: 10.1038/nature08241. [DOI] [PMC free article] [PubMed] [Google Scholar]
- Yazawa M, Sadaghiani AM, Hsueh B, Dolmetsch RE. Induction of protein-protein interactions in live cells using light. Nat Biotechnol. 2009;27:941–945. doi: 10.1038/nbt.1569. [DOI] [PubMed] [Google Scholar]
- Yizhar O, Fenno LE, Prigge M, Schneider F, Davidson TJ, O'Shea DJ, Sohal VS, Goshen I, Finkelstein J, Paz JT, et al. Neocortical excitation/inhibition balance in information processing and social dysfunction. Nature. 2011;477:171–178. doi: 10.1038/nature10360. [DOI] [PMC free article] [PubMed] [Google Scholar]
- Zemelman BV, Lee GA, Ng M, Miesenböck G. Selective photostimulation of genetically chARGed neurons. Neuron. 2002;33:15–22. doi: 10.1016/s0896-6273(01)00574-8. [DOI] [PubMed] [Google Scholar]
- Zhang F, Wang LP, Brauner M, Liewald JF, Kay K, Watzke N, Wood PG, Bamberg E, Nagel G, Gottschalk A, et al. Multimodal fast optical interrogation of neural circuitry. Nature. 2007;446:633–639. doi: 10.1038/nature05744. [DOI] [PubMed] [Google Scholar]
- Zhang K, Duan L, Ong Q, Lin Z, Varman PM, Sung K, Cui B. Light-Mediated Kinetic Control Reveals the Temporal Effect of the Raf/MEK/ERK Pathway in PC12 Cell Neurite Outgrowth. PLoS One. 2014;9:e92917. doi: 10.1371/journal.pone.0092917. [DOI] [PMC free article] [PubMed] [Google Scholar]
- Zhou XX, Chung HK, Lam AJ, Lin MZ. Optical control of protein activity by fluorescent protein domains. Science. 2012;338:810–814. doi: 10.1126/science.1226854. [DOI] [PMC free article] [PubMed] [Google Scholar]
- Zikihara K, Iwata T, Matsuoka D, Kandori H, Todo T, Tokutomi S. Photoreaction cycle of the light, oxygen, and voltage domain in FKF1 determined by low-temperature absorption spectroscopy. Biochemistry. 2006;45:10828–10837. doi: 10.1021/bi0607857. [DOI] [PubMed] [Google Scholar]
Associated Data
This section collects any data citations, data availability statements, or supplementary materials included in this article.
Supplementary Materials
Movie 1. Left panel: Shown is a COS7 cell expressing VSVG-YFP-2xUVR8 (green) along with soluble mCherry (red). Right panel: Same data as in the left panel but only the YFP signal is displayed in grey scale with a higher contrast so that the YFP signal can be visualized following dispersion of the bright VSVG clusters. The dot in the upper left corner indicates delivery of 7 sec. of UVB illumination to disperse the VSVG clusters. This video was captured at 1 frame/min. and the dimensions of each panel are 28.1 μm by 25.9 μm.