

Abstract
Background
There is growing interest in the contributions of characteristics of the neighborhood environment to inequalities in physical activity. However, few studies have examined the relationship between observed neighborhood environmental characteristics and physical activity in a multiethnic urban area.
Purpose
The purpose of this study was to assess relationships between neighborhood environments and physical activity and the extent to which these associations varied by demographic characteristics or perceptions of the physical and social environment.
Methods
Cross-sectional analyses drew upon data collected from a stratified proportional probability sample of non-Hispanic Black, Hispanic and non-Hispanic White (NHW) adults (n = 919) in low-to-moderate income neighborhoods in Detroit, Michigan. Physical activity was assessed as self-reported duration and frequency of vigorous and moderate physical activity. Observed physical environment was assessed through systematic social observation by trained observers on blocks adjacent to survey respondents' residences.
Results
We find a positive association of sidewalk condition with physical activity, with stronger effects for younger compared with older residents. In addition, physical disorder was more negatively associated with physical activity among NHW and older residents.
Conclusions
These findings suggest that sidewalk improvements and reductions in physical disorder in urban communities may promote greater equity in physical activity.
Keywords: environment, physical activity
Introduction
Physical inactivity is a public health concern because of its association with adverse health outcomes. Population studies have demonstrated that neighborhood characteristics are associated with physical activity (PA) levels,1–3 lending credence to social ecological models that suggest that PA is influenced by the individual, social and environmental factors.4 Environmental factors may be relevant for understanding lower levels of PA among racial and ethnic minorities and those with lower socioeconomic status (SES), as they are more likely to reside in economically disadvantaged neighborhoods that are less conducive to PA in the United States.2,5 Understanding the contributions of environmental characteristics to excess health risks among these residents requires consideration of observed neighborhood characteristics, residents' perceptions of their environments and how these may vary by sociodemographics. Yet, few studies have examined these relationship among residents of economically disadvantaged neighborhoods including those of low-to-moderate income urban communities.6–9 Even fewer studies have utilized measures, such as systematic social observation, to examine the association between the quality and condition of the built environment and PA in low-to-moderate income communities.3,6,7,10 This study aims to contribute to this literature by examining: (i) multiple indicators of the built environment with PA in a multiethnic sample of residents of low-to-moderate income urban neighborhoods and (ii) whether such associations are modified by residents' perceptions of the physical or social environments of their neighborhoods, or by sociodemographics (i.e. race, income, age and gender). Below, we review what is currently known about such associations, and the modifying role of perceptions and sociodemographics.
Wide disparities exist in the quality and condition of the built environment between those residing in economically disadvantaged and advantaged neighborhoods in the United States.11–14 In comparison with economically advantaged neighborhoods, indicators of the physical and social environment of economically disadvantaged neighborhoods such as pedestrian infrastructure are more likely to show signs of deterioration.14,15 Pedestrian infrastructure, such as sidewalks (i.e. pavement) and streets (i.e. roadways), has most often been examined in terms of the presence or absence of a feature (e.g. sidewalks), rather than its quality or condition (e.g. evenness and obstructions).6,16–18 Since many urban environments have sidewalks present, focusing on the quality of pedestrian infrastructure may help to provide a more nuanced measure to ascertain associations with PA. Quality of the pedestrian infrastructure may not only be reflected in its physical maintenance but also in surrounding indicators of disorder (e.g. graffiti). Both physical maintenance of the pedestrian infrastructure and lower levels of physical disorder have been linked to more PA.17,19–21 One study in St Louis, Missouri, found that predominantly African American neighborhoods were more likely to have sidewalks in poor physical condition, whereas high-poverty neighborhoods were more likely to have physical disorder.15 These findings suggest racial composition and SES of urban neighborhoods may be associated with the quality of infrastructure and that it may be inversely associated with PA.
Evidence also suggests that residents with negative perceptions of their neighborhood environment have lower levels of PA.22–26 Relatively few studies have examined the extent to which perceptions of the neighborhood environment may modify associations between observed characteristics and PA25,27,28 or examined the extent to which sociodemographics may modify such associations.6,12,16,29–31 Specifically, while there is some evidence to suggest that perceptions of neighborhood conditions vary by race and ethnicity, few studies have examined whether associations between the condition of the neighborhood environment and PA are consistent across racial or ethnic groups.6,9,30 A number of studies have reported that SES is associated with both the type and frequency of PA.2,5 However, few studies have examined whether the strength of associations between neighborhood conditions and PA differs across SES,11,32 age6,33 or gender.34–36
We build on extant literature by examining whether perceptions of the neighborhood environment or sociodemographics modify associations between observed condition of the built environment and PA. Specifically, to address the gaps in the literature described earlier, we test the following hypotheses: (i) residents of neighborhoods with poorer sidewalk or street condition, or a greater number of indicators of physical disorder, will have lower levels of PA, (ii) relationships between observed neighborhood characteristics and PA will be modified by perceptions of the built and social environments and (iii) relationships between observed neighborhood characteristics and PA will be modified by sociodemographics.
Methods
Study design
This research was conducted by The Healthy Environments Partnership (HEP), a community-based participatory research partnership that examines environmental factors associated with cardiovascular disease risk, and designs, implements and evaluates interventions to reduce inequities.37 This cross-sectional study drew upon data from: the HEP 2002–2003 community survey,37 the HEP Neighborhood Observational Checklist (NOC) (2002–2003)38 and 2000 Decennial Census.
The HEP community survey was a stratified two-stage probability sample of occupied housing units, designed for 1000 completed interviews of non-Hispanic Black (NHB), Hispanic and non-Hispanic White (NHW) adults aged ≥25 years residing in Detroit.37 At each household unit, a listing was completed of eligible residents and one eligible adult was selected randomly for inclusion in the study. Of the 2517 housing units in the initial sample, 1297 were invalid (e.g. vacant), unable to be screened after repeated attempts (i.e. 12+ attempts) or contained no eligible respondent. The final sample consisted of 919 face-to-face interviews: interviews were completed with 75% of households in which an eligible respondent was identified (919 of 1220), 55% of households with a known or potential respondent (919 of 1663) and 90% of households in which an eligible respondent was contacted (919 of 1027).37 Sample weights were constructed to adjust for differential selection and response rates, allowing us to estimate population effects from the HEP sample. The 919 respondents were nested within 146 blocks (i.e. areas bounded by visible features, such as streets and roads and by nonvisible boundaries, such as selected property lines and city and township limits)39 and 69 census block groups (i.e. clusters of blocks that generally contain between 600 and 3000 people in the same census tract).37,40
The HEP NOC is an instrument for collection of systematic social observation data. NOC data were collected in 2002–2003 using handheld computers.41 The blocks selected for observation included blocks where at least one of the 919 HEP survey respondents lived,38 plus blocks that shared a common border with those blocks (‘rook’ neighborhoods).42 This sampling strategy captured the environment immediately surrounding the blocks in which survey respondents lived.38,41
Measures
The ‘dependent variable’ for the analyses reported here was individual metabolic minutes of PA, calculated based on the protocol developed for the International PA Questionnaire (IPAQ),43 described in greater detail in Table 1.
Table 1.
Individual/neighborhood level measure definitions
| Measure | Conceptual definition | Operational definition |
|---|---|---|
| METs | A unit of physical activity intensity based on the rate of energy expenditure.29 | A continuous measure of minutes the individual reported being engaged in physical activity weighted by the energy expended by type of activity (e.g. vigorous and moderate). An average MET weighting score was derived for each category (moderate and vigorous), based on the protocol developed for the IPAQ.29 The total number of MET minutes of activity was calculated for each individual as the sum of their MET minutes for moderate intensity, and vigorous intensity activities per week. METs are multiples of the resting metabolic rate and a MET minute is computed by multiplying the MET score of an activity by the minutes performed. MET minute scores are equivalent to kilocalories for a 60-kg person. Kilocalories may be computed from MET minutes using the following equation: MET min × (weight in kilograms/60 kg). |
| Neighborhood physical environment | Perceptions of the neighborhood physical environment.44 | The mean of seven items assessing: houses in my neighborhood are generally well maintained (reverse coded); there is heavy car or truck traffic in my neighborhood; my neighborhood has a lot of vacant lots or vacant houses; there is air pollution like diesel from trucks or pollution from factories or incinerators in my neighborhood; streets, sidewalks and vacant lots in my neighborhood are kept clean of litter and dumping (reverse coded); there is a lot of noise from cars, motorcycles, music, neighbors or airplanes in my neighborhood; and there is contaminated land in my neighborhood. Response categories ranged from 1 (strongly disagree) to 5 (strongly agree), with a high score indicating more negative perception of the neighborhood physical environment (Cronbach's alpha = 0.69) |
| Neighborhood social environment | Perceptions of the neighborhood social environment.45 | The mean of six items assessing the frequency with which the respondent indicated that each of the following was a problem in their neighborhood: gang activity; drug dealing or drug dealers; gunfire or shootings; prostitution; loitering or hanging around; theft, vandalism or arson. Response categories ranged from 1 (never) to 5 (always), with a high score indicating a more negative ranking of the neighborhood social environment (Cronbach's alpha = 0.83) |
| Sidewalk Condition | Sidewalk unevenness and obstruction.38 | The proportion of sidewalks in good or fair condition, calculated as the number of sidewalks in the rook that were in good or fair condition divided by the total number of block faces. |
| Street Condition | Street unevenness and obstruction (Morenoff et al., Unpublished manuscript). | The proportion of streets in good or fair condition, calculated as the number of street segments in the rook in good or fair condition divided by the total number of street segments. |
‘Individual level independent variables’ included: perceptions of the ‘neighborhood physical environment’ and the ‘neighborhood social environment’; self-reported race/ethnicity; a dichotomous indicator of household poverty, calculated using the ratio of household income to the federal poverty level;46 age in tertiles; and gender. With regard to age, the association between age and sidewalk condition was not linear, with older individuals being more likely to reside in neighborhoods with sidewalks in good condition than younger adults. Owing to this non-linear association, we grouped the individuals into tertiles based on trends in the data showing similarities for adults ages 25–39, 40–49 and 50 and older to remove any confounding effect between age and sidewalk condition. See Table 1 for specific scale items, construction and properties.
‘Individual covariates’ included marital status, education, labor force, home ownership, car ownership, years of residence in the neighborhood and physical health limitations. ‘Physical health limitations’ was the mean of four items on a 5-point scale regarding difficulty performing four activities: doing heavy work around the house such as shoveling snow or washing walls, climbing a few flights of stairs, walking several blocks, and bathing yourself.
‘Neighborhood level independent variables’ included indicators of the condition of the environment at the block level and demographic characteristics. Measures of the ‘condition’ of the built environment drew upon NOC data described earlier and included sidewalk condition, street condition and physical disorder, described in Table 1. A measure of neighborhood poverty was constructed using data from the U.S. Census 2000, indicating the proportion of households with incomes below the poverty line.
Analysis
Weighted 3-level hierarchical regression models for a continuous outcome were estimated. Individuals who reported ‘yes’ in response to the item ‘Are you currently in bed all or most of the day?’ were removed from the analysis (n = 71). The final models included the remaining 846 survey respondents (level 1), 145 blocks/rook neighborhoods in which respondents resided (level 2) and 69 census block groups (level 3). To test whether observed characteristics of the neighborhood environment were associated with PA (Fig. 1, path a), PA was regressed on each observed characteristic (one at a time), controlling for neighborhood poverty and individual level covariates (models 1–3, main models).
Fig. 1.
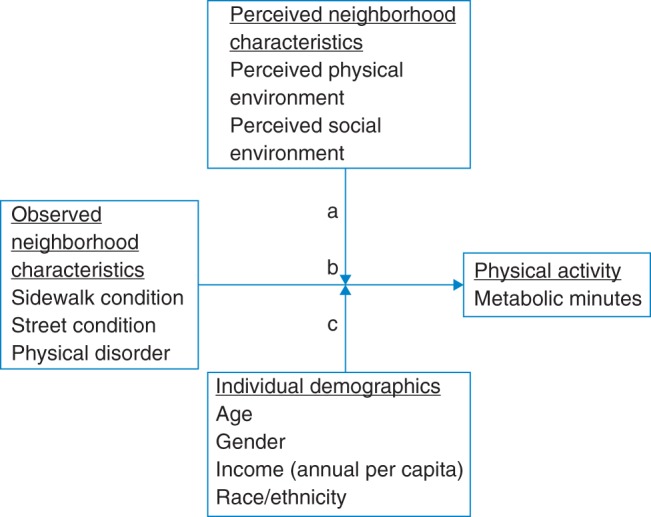
Hypothesized pathways of mediating and modifying relationships between observed neighborhood characteristics, perceived neighborhood characteristics, individual demographics and physical activity.
We examined the extent to which relationships between observed neighborhood characteristics and PA were modified by self-reported neighborhood physical and social environment measures (Fig. 1, path d), by adding interactions between each observed neighborhood characteristic and perceptions of the physical and social environment.
Finally, to test whether relationships between observed neighborhood characteristics and PA were modified by sociodemographics, interactions between each were added to the main models (Fig. 1, path d′).
Results
As shown in Table 2, the mean age was 46.3 years; 52.3% were female, 56.8% NHB, 22.2% Hispanic and 18.6% NHW. Sixty-five percent of households reported income above the poverty line and 35% reported education beyond high school (i.e. secondary school).
Table 2.
Weighted descriptive statistics for individual, neighborhood census block and neighborhood census block group variables (n = 846)
| Characteristic | (n = 846) | ||
|---|---|---|---|
| Individual (level 1) | Mean ± SE | Percent | Range |
| Total physical activity (total metabolic minutes)a | 1.1 ± 0.04 | 0–4.2 | |
| Physical activity by groups | |||
| Age 25–37 | 1.3 ± 0.02 | ||
| Age 38–49 | 1.2 ± 0.04 | ||
| Age ≥50 years | 0.8 ± 0.07 | ||
| Hispanic | 1.1 ± 0.03 | ||
| NHW | 1.0 ± 0.05 | ||
| NHB | 1.1 ± 0.03 | ||
| Age (in years) | 45.5 ± 0.8 | 25–95 | |
| Age in tertiles | |||
| Age 25–37 years | 35.3 | ||
| Age 38–49 years | 30.2 | ||
| Age ≥ 50 years | 31.4 | ||
| Female | 52.4 | ||
| Race/ethnicity | |||
| Hispanic | 22.3 | ||
| NHW | 18.6 | ||
| NHB | 56.7 | ||
| Education | |||
| <12 years | 35.2 | ||
| 12 years | 29.9 | ||
| >12 years | 34.9 | ||
| Percent below poverty | 35.2 | ||
| Years of Neighborhood residence | 17.9 ± 0.7 | 0.7–71.0 | |
| Car ownership | 70.5 | ||
| Home ownership | 48.6 | ||
| Physical health limitation (1 = no difficulty, 5 = Cannot do it) | 1.5 ± 0.04 | 0.3–5.0 | |
| Currently employed | 68.4 | ||
| Currently married | 27.7 | ||
| Perceived neighborhood physical environment (1 = strongly agree, 5 = strongly disagree) | 3.1 ± 0.05 | ||
| Perceived neighborhood social environment (1 = always, 5 = never) | 2.7 ± 0.05 | ||
| Neighborhood block/rook (level 2) | |||
| Sidewalk conditionb | 0.5 ± 0.2 | 0–0.9 | |
| Street conditionc | 0.4 ± 0.2 | 0–0.9 | |
| Physical disorderd | 0.4 ± 0.1 | 0–0.9 | |
| Neighborhood census block group (level 3) | |||
| Percent of households at or below the federal poverty level | 32.5 ± 7.7 | ||
aExpressed in standard deviation units (SD = 3569 metabolic minutes per week)
bMeasure represents the mean percent of sidewalks in good condition in a rook.
cMeasure represents the mean percent of streets in good condition in a rook.
dMeasure represents the mean percent of physical disorder present in a rook.
Results from fully unconditional models indicate that 6% of the variability in PA was at the block level and 3% at the block group level. Table 3 presents results for grand mean-centered models testing associations between observed neighborhood characteristics and PA. In grand mean-centered variables, neighborhood-level variables are interpreted as the effect of one unit variation from the grand mean (across neighborhoods) for that variable.
Table 3.
Physical activity regressed on sidewalk condition, street condition and physical disorder (grand mean-centered models), adjusting for individual level covariates and neighborhood percent poverty
|
Model 1 |
Model 2 |
Model 3 |
Model 4 |
Model 5 |
Model 6 |
|||||||||||||
|---|---|---|---|---|---|---|---|---|---|---|---|---|---|---|---|---|---|---|
| β | SE | P | β | SE | P | β | SE | P | β | SE | P | β | SE | P | β | SE | P | |
| Intercept | 0.95 | 0.20 | 0.00 | 0.93 | 0.31 | 0.00 | 0.93 | 0.31 | 0.00 | 0.99 | 0.30 | 0.00 | 0.91 | 0.31 | 0.01 | 0.94 | 0.31 | 0.00 |
| Level 2 (Block/rook) | ||||||||||||||||||
| Sidewalk condition | 0.80 | 0.29 | 0.01 | 0.77 | 0.28 | 0.01 | ||||||||||||
| Street condition | 0.34 | 0.30 | 0.26 | 0.36 | 0.30 | 0.23 | ||||||||||||
| Physical disorder | 0.28 | 0.41 | 0.49 | 0.29 | 0.39 | 0.46 | ||||||||||||
| Level 1 (Individual) | ||||||||||||||||||
| Ages 38–49 years | −0.17 | 0.10 | 0.09 | −0.19 | 0.10 | 0.05 | ||||||||||||
| Sidewalk*Ages 38–49 years | −0.73 | 0.38 | 0.05 | |||||||||||||||
| Ages ≥ 50 years | −0.34 | 0.10 | 0.00 | −0.36 | 0.09 | 0.00 | ||||||||||||
| Sidewalk*Ages ≥50 years | −1.38 | 0.35 | 0.00 | |||||||||||||||
| Ages 38–49 years | −0.17 | 0.10 | 0.09 | −0.18 | 0.10 | 0.08 | ||||||||||||
| Street*Ages 38–49 years | −0.24 | 0.52 | 0.64 | |||||||||||||||
| Ages ≥50 years | −0.34 | 0.10 | 0.00 | −0.36 | 0.10 | 0.00 | ||||||||||||
| Street*Ages ≥50 years | −0.76 | 0.46 | 0.10 | |||||||||||||||
| Ages 38–49 years | −0.17 | 0.10 | 0.09 | −0.19 | 0.10 | 0.06 | ||||||||||||
| Physical disorder* Ages 38–49 years | −2.10 | 0.97 | 0.03 | |||||||||||||||
| Ages ≥50 years | −0.34 | 0.10 | 0.00 | −0.34 | 0.10 | 0.00 | ||||||||||||
| Physical disorder* Ages ≥50 years | −1.88 | 0.77 | 0.02 | |||||||||||||||
| Sigma squared | 0.8732 | 0.8767 | 0.8770 | 0.8658 | 0.8743 | 0.8680 | ||||||||||||
| Tau(pi) | 0.0746 | 0.0636 | 0.0688 | 0.0703 | 0.0625 | 0.0700 | ||||||||||||
| Tau(beta) | 0.0142 | 0.0339 | 0.0302 | 0.0146 | 0.0343 | 0.0267 | ||||||||||||
Adjusted for individual age, sex, race/ethnicity, education, household poverty level, employment, marital status, length of residence, physical health limitation, homeownership, car ownership and neighborhood percent poverty.
Results presented in Table 2 indicate a significant positive association between the proportion of sidewalks in good condition and PA (β = 0.79, P = 0.01), after accounting for individual- and neighborhood-level covariates. Neither street condition (β = 0.35, P = 0.24) nor physical disorder (β = 0.23, P = 0.58) was significantly associated with PA.
Perceptions of the neighborhood physical (β = 0.22, P = 0.36) or neighborhood social (β = 0.32, P = 0.11) environment did not modify relationships between sidewalk condition and PA. Neither perceptions of the neighborhood physical (β = 0.26, P = 0.36) nor social (β = 0.29, P = 0.20) environment modified relationships between street condition and PA. Moreover, neither perceptions of the neighborhood physical (β = −0.19, P = 0.71) nor social (β = 0.23, P = 0.60) environment modified relationships between physical disorder and PA.
Table 3 presents selected results for Hypothesis 3. Relationships between sidewalk condition and PA (NHW, β = −0.75, P = 0.18; Hispanic, β = −0.41, P = 0.56) and between street condition and PA (NHW, β = 0.00, P = 0.99; Hispanic β = −0.85, P = 0.24) did not differ by race or ethnicity. NHW residents reported greater reductions in PA with increasing levels of physical disorder compared with NHB (β = −2.50, P = 0.03). We found no evidence to support the hypothesis that income modifies associations between PA and sidewalk condition (β = −0.01, P = 0.92), street condition (β = 0.13, P = 0.28) or physical disorder (β = −0.23, P = 0.23). The relationship between sidewalk condition and PA differed significantly by age, with the positive association between sidewalk condition and PA weakened among those in the oldest tertile (>50 years) (β = −1.39, P < 0.001), compared with the youngest (age 25–37). We did not find a modifying effect of age on the association between street condition and PA (Model 2, β = 0.64, P = 0.15). Age-modified associations between physical disorder and PA (Model 3), with higher levels of physical disorder, more negatively associated with PA among residents in the middle (β = −2.33, P = 0.02) and oldest (β = −1.97, P = 0.01) compared with those in the youngest age groups. Similarly, we found no evidence to support the hypothesis that relationships between observed characteristics and PA were modified by gender for sidewalk condition (β = −0.60, P = 0.31), street condition (β = −0.72, P = 0.11) or physical disorder (β = 0.12, P = 0.90).
Discussion
Main findings of this study
Our analysis yielded three main findings. The first is that sidewalk condition is positively associated with PA. This association is not modified by perceptions of the physical or social environment and appears strongest for younger residents than those who are older. Second, this study found no evidence to suggest associations between street condition and PA, either alone or in conjunction with perceptions of the physical or social environment or sociodemographics. Finally, while no direct association of physical disorder in the full sample was present, our finding of a significant interaction by race and age, with NHWs being more negatively affected by physical disorder compared with NHBs; and for older compared with younger residents.
Sidewalk condition
Our findings of a positive association between sidewalk condition and PA, after accounting for neighborhood poverty and sociodemographics, was consistent with our first hypothesis and with results reported elsewhere.12,29,47 This relationship did not differ significantly by perceptions of the physical or social environment. Tests of our third hypothesis that this association would vary by sociodemographics found some support. Specifically, we found those in the youngest tertile aged 25–37 benefitted most from sidewalks in good condition. While this association remained positive for older residents, the effects were weaker. These findings are consistent with studies indicating age-related differences in types of PA.48 Although our study's models are adjusted for a number of conditions (e.g. physical health limitations), there may be others not adequately captured in these models that shape PA levels among older adults and thus dampen the positive associations between sidewalk condition and PA seen among the younger adults in this study. These effects did not differ by race, SES or gender of residents.
Street condition
We did not find support for the hypothesis that poorer street condition was associated with lower levels of PA. This finding did not vary by resident's perceptions of the neighborhood physical or social environment, or by sociodemographics.
Physical disorder
The finding of no main association between physical disorder and PA joins mixed results. Hoehner and colleagues12 reported a significant positive association between observed physical disorder and transportation-related PA, but no association with recreational PA.12,29 Our findings suggest that associations between physical disorder and PA differ by age, with adults in the middle and top age tertiles more negatively affected by physical disorder, compared with those in the youngest tertile. These results join findings reported by King and colleagues,29 who report a significant negative association between physical disorder and PA in an elderly sample. In addition, our finding of racial differences in the association between physical disorder and PA is consistent with findings reported by Kefalas,49 and Sampson et al.50 in finding that physical disorder was more strongly associated with PA among NHW compared with NHB residents. Taken together, these findings suggest that older adults and NHWs may be more sensitive to the adverse effects of physical disorder on PA.
What is already known on this topic
Previous research has found an association between both observed characteristics of the built environment and resident's perceptions of their neighborhood and PA.2,6,9,16,30 Recent reviews on the built environment and health behaviors concluded that the presence of sidewalks, light traffic and safety from crime was most commonly associated with PA, although the results were not consistent.8,9,30 Further, perceptions of physical disorder, safety from crime, sidewalk condition and neighborhood destinations have all been associated with PA.9
What this study adds
This study lends support for the role of pedestrian infrastructure within the built environment, specifically sidewalk conditions, and PA among residents of low-to-moderate income urban communities. Better quality neighborhood characteristics were associated with more PA irrespective of SES or gender. In contrast, the association between observed neighborhood characteristics and PA varied by race and age. Younger adults were more negatively affected by poor sidewalk condition than older adults, whereas NHWs and older adults were more sensitive to physical disorder.
Limitations of this study
There are a number of limitations to this study. First, the measure of PA was self-reported and vulnerable to associated bias. The measure of overall PA used in this analysis was a global measure and did not specify the type or location of PA. Evidence suggests that different attributes of the built environment are associated with various types of PA51,52 and that local neighborhood conditions are likely associated with activity in the neighborhood, but not outside the neighborhood.53 Recent research on ‘activity spaces’ suggests that residents are physically active in spaces beyond their residential neighborhood.54 There are two potential implications of this. First, if both neighborhood characteristics and PA are independently associated with a third, unmeasured, characteristic (e.g. neighborhood poverty), our results may overestimate associations between neighborhood characteristics and PA owing to the failure to account for this confounder. Alternatively, the lack of specificity in the measure of PA may weaken observed associations between neighborhood characteristics and PA. Future research that uses objective measures of PA and GPS devices may provide a better measure of the frequency and location of PA and will be important for moving forward our understanding of associations between neighborhood characteristics and PA. The circumscribed distribution of household income in this sample may have contributed to null findings for tests of interactions with household income. Cross-sectional analysis is also a limitation, in that, this study is unable to disentangle the sequence of effects.55 Future researchers will want to examine temporal ordering of effects—for example, to test whether sidewalk condition is actually an antecedent of PA, or whether neighborhoods with more sedentary populations are less likely to invest in sidewalk maintenance.
Conclusions
Despite these limitations, the findings presented here are consistent with a growing body of evidence suggesting that the condition of the neighborhood environment is associated with PA. These findings suggest that investments in sidewalk maintenance and reductions in physical disorder in low-to-moderate income urban neighborhoods are likely to benefit both women and men, across a range of racial, ethnic and socioeconomic groups.8,56
Funding
This work was supported by the National Institute of Environmental Health Sciences (NIEHS) [R01ES10936, R01ES014234], the Promoting Ethnic Diversity in Public Health Research Education project [5-R25-GM-058641-11], Rackham Merit Fellowship, Rackham Graduate School, University of Michigan and a Summer Mentored Writing Award through the Rackham Faculty Allies program at the University of Michigan. The results presented here are solely the responsibility of the authors and do not necessarily represent the views of NIEHS, the Promoting Ethnic Diversity in Public Health Research Education project, Rackham Merit Fellowship or the Rackham Faculty Allies program. This work was also supported by the Aetna Foundation, a National Foundation based in Hartford, Connecticut, that supports projects to promote wellness, health and access to high quality health care for everyone. The views presented here are those of the authors and not necessarily those of the Aetna Foundation, its directors, officers or staff.
Acknowledgements
The Healthy Environments Partnership (HEP) (www.hepdetroit.org) is a community-based participatory research partnership affiliated with the Detroit Community-Academic Urban Research Center (www.detroiturc.org). We thank the members of the HEP Steering Committee for their contributions to the work presented here, including representatives from Brightmoor Community Center, Detroit Department of Health and Wellness Promotion, Detroit Hispanic Development Corporation, Friends of Parkside, Henry Ford Health System, Warren Conner Development Coalition and University of Michigan School of Public Health.
REFERENCES
- 1.Handy SL, Boarnet MG, Ewing R, Killingsworth RE. How the built environment affects physical activity: views from urban planning. Am J Prev Med. 2002;23(2):64–73. doi: 10.1016/s0749-3797(02)00475-0. doi:10.1016/S0749-3797(02)00475-0. [DOI] [PubMed] [Google Scholar]
- 2.Gordon-Larsen P, Nelson MC, Page P, Popkin BM. Inequality in the built environment underlies key health disparities in physical activity and obesity. Pediatrics. 2006;117(2):417. doi: 10.1542/peds.2005-0058. doi:10.1542/peds.2005-0058. [DOI] [PubMed] [Google Scholar]
- 3.Hutch DJ, Bouye KE, Skillen E, Lee C, Whitehead L, Rashid JR. Potential strategies to eliminate built environment disparities for disadvantaged and vulnerable communities. J Info. 2011;101(4):587–595. doi: 10.2105/AJPH.2009.173872. [DOI] [PMC free article] [PubMed] [Google Scholar]
- 4.Sallis JF, Owen N, Fisher EB. Ecological models of health behavior. Health behav health educ. 2008;4:465–486. [Google Scholar]
- 5.Macintyre S, Ellaway A. Ecological approaches: rediscovering the role of the physical and social environment. Soc epidemiol. 2000:332–348. [Google Scholar]
- 6.Brownson RC, Hoehner CM, Day K, Forsyth A, Sallis JF. Measuring the built environment for physical activity: state of the science. Am J Prev Med. 2009;36(4, Suppl 1):S99–S123.e12. doi: 10.1016/j.amepre.2009.01.005. [DOI] [PMC free article] [PubMed] [Google Scholar]
- 7.Ding D, Gebel K. Built environment, physical activity, and obesity: what have we learned from reviewing the literature? Health Place. 2012;18(1):100–105. doi: 10.1016/j.healthplace.2011.08.021. doi:10.1016/j.healthplace.2011.08.021. [DOI] [PubMed] [Google Scholar]
- 8.Sallis JF, Floyd MF, Rodríguez DA, Saelens BE. Role of built environments in physical activity, obesity, and cardiovascular disease. Circulation. 2012;125(5):729–737. doi: 10.1161/CIRCULATIONAHA.110.969022. doi:10.1161/CIRCULATIONAHA.110.969022. [DOI] [PMC free article] [PubMed] [Google Scholar]
- 9.Ferdinand AO, Sen B, Rahurkar S, Engler S, Menachemi N. The relationship between built environments and physical activity: a systematic review. Am J Public Health. 2012;102(10):e7–e13. doi: 10.2105/AJPH.2012.300740. doi:10.2105/AJPH.2012.300740. [DOI] [PMC free article] [PubMed] [Google Scholar]
- 10.Schaefer-McDaniel N, O'Brien Caughy M, O'Campo P, Gearey W. Examining methodological details of neighbourhood observations and the relationship to health: a literature review. Soc Sci Med. 2010;70(2):277–292. doi: 10.1016/j.socscimed.2009.10.018. [DOI] [PubMed] [Google Scholar]
- 11.Lovasi GS, Hutson MA, Guerra M, Neckerman KM. Built environments and obesity in disadvantaged populations. Epidemiol Rev. 2009;31(1):7–20. doi: 10.1093/epirev/mxp005. doi:10.1093/epirev/mxp005. [DOI] [PubMed] [Google Scholar]
- 12.Hoehner CM, Brennan Ramirez LK, Elliott MB, Handy SL, Brownson RC. Perceived and objective environmental measures and physical activity among urban adults. Am J Prev Med. 2005;28(2):105–116. doi: 10.1016/j.amepre.2004.10.023. doi:10.1016/j.amepre.2004.10.023. [DOI] [PubMed] [Google Scholar]
- 13.Taylor WC, Poston WSC, Jones L, Kraft MK. Environmental justice: obesity, physical activity, and healthy eating. J phys act health. 2006;3:S30. doi: 10.1123/jpah.3.s1.s30. [DOI] [PubMed] [Google Scholar]
- 14.Franzini L, Taylor W, Elliott MN, Cuccaro P, Tortolero SR, Janice Gilliland M, et al. Neighborhood characteristics favorable to outdoor physical activity: disparities by socioeconomic and racial/ethnic composition. Health Place. 2010;16(2):267–274. doi: 10.1016/j.healthplace.2009.10.009. doi:10.1016/j.healthplace.2009.10.009. [DOI] [PubMed] [Google Scholar]
- 15.Kelly CM, Schootman M, Baker EA, Barnidge EK, Lemes A. The association of sidewalk walkability and physical disorder with area-level race and poverty. J Epidemiol Commun Health. 2007;61(11):978–983. doi: 10.1136/jech.2006.054775. doi:10.1136/jech.2006.054775. [DOI] [PMC free article] [PubMed] [Google Scholar]
- 16.Saelens BE, Handy SL. Built environment correlates of walking: a review. Med Sci Sports Exerc. 2008;40(7 Suppl):S550. doi: 10.1249/MSS.0b013e31817c67a4. [DOI] [PMC free article] [PubMed] [Google Scholar]
- 17.Kahn EB, Ramsey LT, Brownson RC, Heath GW, Howze EH, Powell KE, et al. The effectiveness of interventions to increase physical activity: a systematic review. Am J Prev Med. 2002;22(4):73–107. doi: 10.1016/s0749-3797(02)00434-8. doi:10.1016/S0749-3797(02)00434-8. [DOI] [PubMed] [Google Scholar]
- 18.Humpel N, Owen N, Leslie E. Environmental factors associated with adults’ participation in physical activity. Am J Prev Med. 2002;22(3):188–199. doi: 10.1016/s0749-3797(01)00426-3. [DOI] [PubMed] [Google Scholar]
- 19.Pikora TJ, Giles-Corti B, Knuiman MW, Bull FC, Jamrozik K, Donovan RJ. Neighborhood environmental factors correlated with walking near home: using SPACES. Med Sci Sports Exerc. 2006;38(4):708. doi: 10.1249/01.mss.0000210189.64458.f3. doi:10.1249/01.mss.0000210189.64458.f3. [DOI] [PubMed] [Google Scholar]
- 20.Ramirez LKB, Hoehner CM, Brownson RC, Cook R, Orleans CT, Hollander M, et al. Indicators of activity-friendly communities: an evidence-based consensus process. Am J Prev Med. 2006;31(6):515–524. doi: 10.1016/j.amepre.2006.07.026. doi:10.1016/j.amepre.2006.07.026. [DOI] [PubMed] [Google Scholar]
- 21.Taylor WC, Franzini L, Olvera N, Carlos Poston WS, Lin G. Environmental audits of friendliness toward physical activity in three income levels. J Urban Health. 2012:1–12. doi: 10.1007/s11524-011-9663-5. [DOI] [PMC free article] [PubMed] [Google Scholar]
- 22.Molnar BE, Gortmaker SL, Bull FC, Buka SL. Unsafe to play? Neighborhood disorder and lack of safety predict reduced physical activity among urban children and adolescents. Am J Health Promot. 2004;18(5):378–386. doi: 10.4278/0890-1171-18.5.378. doi:10.4278/0890-1171-18.5.378. [DOI] [PubMed] [Google Scholar]
- 23.Gallagher NA, Gretebeck KA, Robinson JC, Torres ER, Murphy SL, Martyn KK. Neighborhood factors relevant for walking in older, urban, African American adults. J Aging Phys Activ. 2010;18(1):99. doi: 10.1123/japa.18.1.99. [DOI] [PMC free article] [PubMed] [Google Scholar]
- 24.Roman CG, Chalfin A. Fear of walking outdoors: a multilevel ecologic analysis of crime and disorder. Am J Prev Med. 2008;34(4):306–312. doi: 10.1016/j.amepre.2008.01.017. doi:10.1016/j.amepre.2008.01.017. [DOI] [PubMed] [Google Scholar]
- 25.Luke DA, Brownson RC, Naleid MKS, Kreuter MW. Perceptions of neighborhood environment for physical activity: Is it ‘who you are’ or ‘where you live? J Urban Health. 2004;81(4):671–681. doi: 10.1093/jurban/jth150. doi:10.1093/jurban/jth150. [DOI] [PMC free article] [PubMed] [Google Scholar]
- 26.Bennett GG, McNeill LH, Wolin KY, Duncan DT, Puleo E, Emmons KM. Safe to walk? Neighborhood safety and physical activity among public housing residents. PLoS Med. 2007;4(10):e306. doi: 10.1371/journal.pmed.0040306. doi:10.1371/journal.pmed.0040306. [DOI] [PMC free article] [PubMed] [Google Scholar]
- 27.Miles R. Neighborhood disorder, perceived safety, and readiness to encourage use of local playgrounds. Am J Prev Med. 2008;34(4):275–281. doi: 10.1016/j.amepre.2008.01.007. doi:10.1016/j.amepre.2008.01.007. [DOI] [PubMed] [Google Scholar]
- 28.Blacksher E, Lovasi GS. Place-focused physical activity research, human agency, and social justice in public health: taking agency seriously in studies of the built environment. Health Place. 2012;18(2):172–179. doi: 10.1016/j.healthplace.2011.08.019. doi:10.1016/j.healthplace.2011.08.019. [DOI] [PubMed] [Google Scholar]
- 29.King D. Neighborhood and individual factors in activity in older adults: results from the neighborhood and senior health study. J aging phys activ. 2008;16(2):144. doi: 10.1123/japa.16.2.144. [DOI] [PubMed] [Google Scholar]
- 30.Casagrande S, Whitt-Glover M, Lancaster K, Odoms-Young A, Gary T. Built environment and health behaviors among African Americans: a systematic review. Am J Prev Med. 2009;36(2):174–181. doi: 10.1016/j.amepre.2008.09.037. doi:10.1016/j.amepre.2008.09.037. [DOI] [PubMed] [Google Scholar]
- 31.CDC. Prevalence of physical activity, including lifestyle activities among adults–United States 2000–2001. Morbidity and Mortality Weekly Report. 2003;52(32):764–769. [PubMed] [Google Scholar]
- 32.Lovasi GS, Neckerman KM, Quinn JW, Weiss CC, Rundle A. Effect of individual or neighborhood disadvantage on the association between neighborhood walkability and body mass index. J Info. 2009;99(2):279–284. doi: 10.2105/AJPH.2008.138230. [DOI] [PMC free article] [PubMed] [Google Scholar]
- 33.Wen M, Kandula NR, Lauderdale DS. Walking for transportation or leisure: what difference does the neighborhood make? J Gen Intern Med. 2007;22(12):1674–1680. doi: 10.1007/s11606-007-0400-4. doi:10.1007/s11606-007-0400-4. [DOI] [PMC free article] [PubMed] [Google Scholar]
- 34.Bird CE, Rieker PP. Gender and Health: the Effects of Constrained Choices and Social Policies. New York, NY: Cambridge University Press; 2008. [Google Scholar]
- 35.Finch BK, Do DP, Basurto-Davila R, Bird C, Escarce J, Lurie N. Does place explain racial health disparities? Quantifying the contribution of residential context to the Black/white health gap in the United States. Soc sci med (1982) 2008;67(8):1258. doi: 10.1016/j.socscimed.2008.06.018. doi:10.1016/j.socscimed.2008.06.018. [DOI] [PMC free article] [PubMed] [Google Scholar]
- 36.Humpel N, Owen N, Leslie E, Marshall AL, Bauman AE, Sallis JF. Associations of location and perceived environmental attributes with walking in neighborhoods. Am J Health Promot. 2004;18(3):239–242. doi: 10.4278/0890-1171-18.3.239. doi:10.4278/0890-1171-18.3.239. [DOI] [PubMed] [Google Scholar]
- 37.Schulz A, Kannan S, Dvonch J, Israel B, Allen A, III, James S, et al. Social and physical environments and disparities in risk for cardiovascular disease: the healthy environments partnership conceptual model. Environ Health Perspect. 2005;113(12):1817. doi: 10.1289/ehp.7913. doi:10.1289/ehp.7913. [DOI] [PMC free article] [PubMed] [Google Scholar]
- 38.Zenk SN, Schulz AJ, Mentz G, House JS, Gravlee CC, Miranda PY, et al. Inter-rater and test–retest reliability: methods and results for the neighborhood observational checklist. Health Place. 2007;13(2):452–465. doi: 10.1016/j.healthplace.2006.05.003. doi:10.1016/j.healthplace.2006.05.003. [DOI] [PubMed] [Google Scholar]
- 39.United Census Bureau. http://www.census.gov/geo/reference/gtc/gtc_block.html. (8 August 2013, date last accessed)
- 40.United Census Bureau. http://www.census.gov/geo/reference/gtc/gtc_bg.html. (8 August 2013, date last accessed)
- 41.Gravlee CC, Zenk SN, Woods S, Rowe Z, Schulz AJ. Handheld computers for direct observation of the social and physical environment. Field Methods. 2006;18(4):382–397. doi:10.1177/1525822X06293067. [Google Scholar]
- 42.Lee J, Wong DWS. Statistical Analysis with ArcView GIS. New York, NY: John Wiley; 2001. [Google Scholar]
- 43.Ainsworth BE, Wilcox S, Thompson WW, Richter DL, Henderson KA. Personal, social, and physical environmental correlates of physical activity in African-American women in South Carolina. Am J Prev Med. 2003;25(3):23–29. doi: 10.1016/s0749-3797(03)00161-2. doi:10.1016/S0749-3797(03)00161-2. [DOI] [PubMed] [Google Scholar]
- 44.Sampson RJ. Neighborhoods and violent crime: a multilevel study of collective efficacy. Science. 1997;277(5328):918–924. doi: 10.1126/science.277.5328.918. doi:10.1126/science.277.5328.918. [DOI] [PubMed] [Google Scholar]
- 45.Schulz AJ, Parker EA, Israel BA, Allen A, Decarlo M, Lockett M. Addressing social determinants of health through community-based participatory research: the East Side Village Health Worker Partnership. Health Educ Behav. 2002;29(3):326–341. doi: 10.1177/109019810202900305. doi:10.1177/109019810202900305. [DOI] [PubMed] [Google Scholar]
- 46.U.S. Census Bureau. Poverty thresholds by size of family and number of children. 2011 http://www.census.gov/hhes/www/poverty/data/threshld/ (8 August 2013, date last accessed)
- 47.Jago R, Baranowski T, Zakeri I, Harris M. Observed environmental features and the physical activity of adolescent males. Am J Prev Med. 2005;29(2):98–104. doi: 10.1016/j.amepre.2005.04.002. doi:10.1016/j.amepre.2005.04.002. [DOI] [PubMed] [Google Scholar]
- 48.Shaw BA, Liang J, Krause N, Gallant M, McGeever K. Age differences and social stratification in the long-term trajectories of leisure-time physical activity. J Gerontol B-Psychol. 2010;65(6):756–766. doi: 10.1093/geronb/gbq073. doi:10.1093/geronb/gbq073. [DOI] [PMC free article] [PubMed] [Google Scholar]
- 49.Kefalas M. Working-Class Heroes: Protecting Home, Community, and Nation in a Chicago Neighborhood. Berkeley and Los Angeles, California: University of California Press; 2003. [Google Scholar]
- 50.Sampson RJ, Raudenbush SW. Seeing disorder: neighborhood stigma and the social construction of ‘broken windows. Soc Psychol Q. 2004;67(4):319–342. doi:10.1177/019027250406700401. [Google Scholar]
- 51.Handy S, Cao X, Mokhtarian P. Correlation or causality between the built environment and travel behavior? Evidence from Northern California. Transport Res D-Tr E. 2005;10(6):427–444. doi:10.1016/j.trd.2005.05.002. [Google Scholar]
- 52.Owen N, Humpel N, Leslie E, Bauman A, Sallis JF. Understanding environmental influences on walking: review and research agenda. Am J Prev Med. 2004;27(1):67–76. doi: 10.1016/j.amepre.2004.03.006. doi:10.1016/j.amepre.2004.03.006. [DOI] [PubMed] [Google Scholar]
- 53.Troped PJ, Wilson JS, Matthews CE, Cromley EK, Melly SJ. The built environment and location-based physical activity. Am J Prev Med. 2010;38(4):429–438. doi: 10.1016/j.amepre.2009.12.032. doi:10.1016/j.amepre.2009.12.032. [DOI] [PMC free article] [PubMed] [Google Scholar]
- 54.Zenk SN, Schulz AJ, Matthews SA, Odoms-Young A, Wilbur J, Wegrzyn L, et al. Activity space environment and dietary and physical activity behaviors: a pilot study. Health Place. 2011;17(5):1150–1161. doi: 10.1016/j.healthplace.2011.05.001. doi:10.1016/j.healthplace.2011.05.001. [DOI] [PMC free article] [PubMed] [Google Scholar]
- 55.Oakes JM. The (mis) estimation of neighborhood effects: causal inference for a practicable social epidemiology. Soc Sci Med. 2004;58(10):1929–1952. doi: 10.1016/j.socscimed.2003.08.004. doi:10.1016/j.socscimed.2003.08.004. [DOI] [PubMed] [Google Scholar]
- 56.Kruger J, Carlson SA, Buchner D. Peer reviewed: how active are older Americans? Prev chronic disease. 2007;4(3) [PMC free article] [PubMed] [Google Scholar]