Fig. 2.
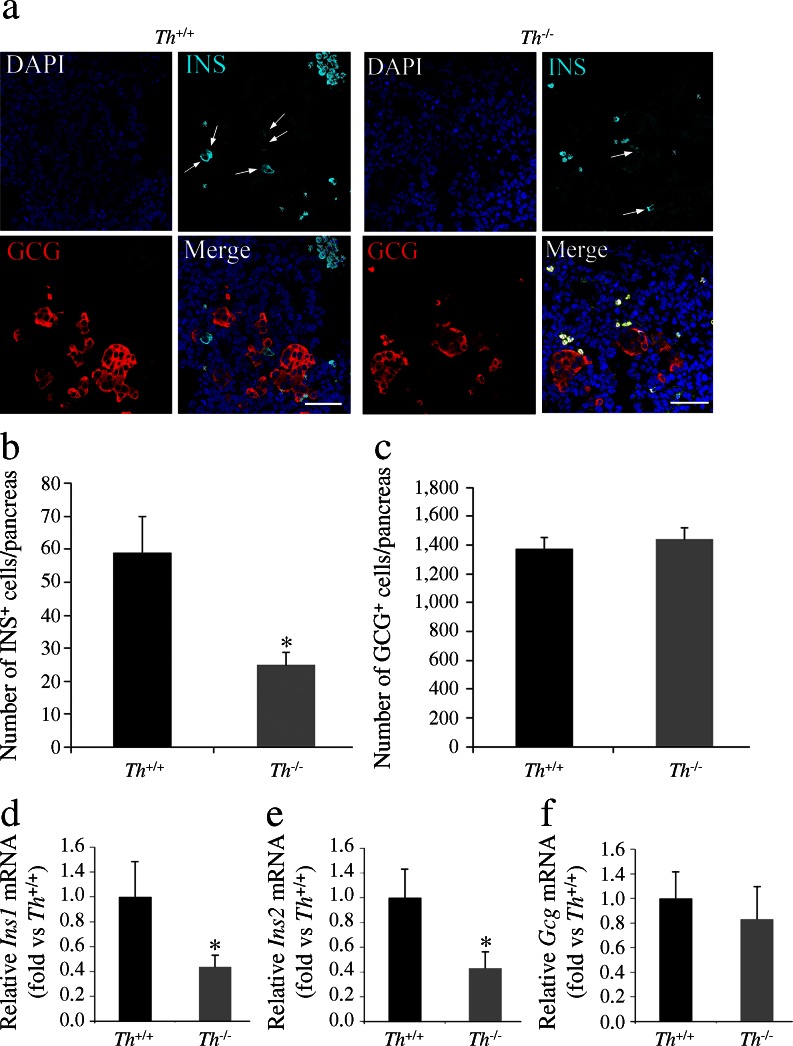
The number of insulin-expressing cells is decreased in the pancreas of TH-deficient E13.5 embryos. (a) Double immunostaining for insulin (INS, cyan) and glucagon (GCG, red). Nuclei are stained with DAPI. Arrows and white X indicate insulin+ and blood cells, respectively. Scale bar, 50 μm. (b, c) Quantification of the total number of insulin- and glucagon-expressing cells in whole pancreas. (d–f) Quantitative real-time PCR of individual pancreases. Levels of the Ins1, Ins2 and Gcg transcripts were normalised to 18S rRNA and Th +/+ values were set at 1. Results represent the mean ± SEM of at least five animals.*p < 0.05 vs Th +/+

