Abstract
This study evaluated the developmental gene and protein expression of proton-coupled oligopeptide transporters (POTs: PepT1, PepT2, PhT1 and PhT2) in different regions of rodent brain, and the age-dependent uptake of a POT substrate, glycylsarcosine, in brain slices. Slices were obtained from cerebral cortex, cerebellum and hypothalamus of wildtype and PepT2 null mice, and from rats at different ages. Gene and protein expression were determined by real-time PCR and immunoblot analyses. Brain slice uptakes of radiolabeled glycylsarcosine were determined in the absence and presence of excess unlabeled glycylsarcosine or L-histidine, the latter being an inhibitor of PhT1/2 but not PepT1/2. Whereas PepT2 and PhT1 transcripts were abundantly expressed in all three regions of mouse brain, little to no expression was observed for PepT1 and PhT2. PhT1 protein was present in brain regions of adult but not neonatal mice and expression levels increased with age in rats. Glycylsarcosine uptake, inhibition and transporter dominance did not show regional brain or species differences. However, there were clear age-related differences in functional activity, with PepT2 dominating in neonatal mice and rats, and PhT1 dominating in adult rodents. These developmental changes may markedly impact the neural activity of both endogenous and exogenous (drug) peptides/mimetics.
Keywords: development, expression, function, PepT2, PhT1, brain
The activity of small peptides and peptide-like drugs in brain is tightly regulated by mechanisms controlling their concentration in the interstitial fluid. Mechanisms may include the synthesis and release of peptides/mimetics from brain parenchyma, entry and/or efflux via the blood-brain and blood-cerebrospinal fluid barriers, degradation by membrane-bound or intracellular enzymes, and uptake into glial and neuronal cells (Keep and Smith 2013). A number of studies have investigated the role of specific oligopeptide transporters in regulating peptide/mimetic transport in the brain and, in particular, at the apical interface of the blood-CSF barrier (i.e., CSF-facing side of the choroid plexus) (Smith et al. 2004). However, few studies have evaluated whether or not differences exist in the transporter-mediated disposition of peptides/mimetics in various regions of the brain (Smith et al. 2011).
The proton-coupled oligopeptide transporter (POT) family is phylogenetically conserved and its members serve as integral membrane proteins in the cellular uptake of di/tripeptides and some pharmacologically active drugs (Wang et al. 2010; Smith et al. 2013). This family consists of four mammalian carriers, of which three are expressed in brain. PepT2 (SLC15A2), a low-capacity high-affinity carrier, is significantly expressed in brain as well as kidney, lung and mammillary gland (Shen et al. 2004; Shen et al. 1999; Rubio-Aliaga and Daniel 2008; Brandsch et al. 2008). PhT1 (SLC15A4), a high-affinity carrier, is abundantly expressed in brain and eye (Yamashita et al. 1997). PhT2 (SLC15A3) is expressed mainly in the lymphatic system and only faintly in brain (Sakata et al. 2001). The remaining carrier, PepT1 (SLC15A1), transports peptides/mimetics in a high-capacity low-affinity manner and is almost exclusively expressed in small intestine (Groneberg et al. 2001; Jappar et al. 2010; Walker et al. 1998). In contrast to PepT2 and PepT1, both PhT1 and PhT2 transport histidine as well as oligopeptides (hence the designation as peptide-histidine transporters; PhTs).
Several studies have demonstrated that PepT2 significantly affects both the disposition and pharmacologic response of peptides/mimetics in brain. PepT2 is localized at the apical surface of choroid plexus and, as such, can alter the relationship between CSF and plasma concentrations substantially (Shen et al. 2004). For example, using genetically modified mice, it was shown that the synthetic dipeptide glycylsarcosine (GlySar), the peptidomimetic heme precursor 5-aminolevulinic acid (5-ALA), and the β-lactam peptide-like antibiotic cefadroxil had CSF-to-plasma concentration ratios in PepT2 null mice that were 4–8 times greater than in wildtype animals (Kamal et al. 2008). These dispositional differences translated into greater protection of wildtype mice against 5-ALA-induced neurotoxicity (Hu et al. 2007) as well as greater L-kyotorphin-induced analgesia during PepT2 ablation (Jiang et al. 2009).
Immunoblot analyses in rats demonstrated that PepT2 is found widely throughout the brain including regions such as the cerebral cortex, olfactory bulb, basal ganglia, cerebellum, and hindbrain (Shen et al. 2004). Moreover, PepT2 is developmentally expressed. Protein levels in cerebral cortex are maximal in fetus and decline rapidly with age. Immunolocalization by double-labeling experiments indicated that PepT2 is expressed in astrocytes and neurons of neonatal rats, but only in neurons of adult animals. However, functional studies were not performed and, as a result, it is unclear if heterogeneity exists in the PepT2-mediated transport of peptides and peptide-like drugs in different brain regions during development. Moreover, almost nothing is known about the functional activity and developmental expression of the peptide/histidine transporter PhT1 in brain. With this in mind, we proposed the following aims: 1) to delineate the expression of SLC15 transcripts (i.e., PepT1, PepT2, PhT1 and PhT2) and protein (i.e., PhT1) in brain cortex, cerebellum and hippocampus of adult and neonatal wildtype and PepT2 null mice, and 2) to examine the uptake properties of GlySar, a POT substrate, in regional brain slices from these mice. Adult and neonatal rats were also studied for comparison. In doing so, a relationship could be established between SLC15 gene - protein expression and transporter activity as a function of brain region, age and rodent species.
Methods
Materials
[Glycine-U-14C]GlySar (106 mCi/mmol; purity 97.3% was obtained from Amersham Life Science (Piscataway, NJ) and [3H]mannitol (20 mCi/mmol; purity 99.0%) from American Radiolabeled Chemicals (St Louis, MO). Unlabeled GlySar and L-histidine were obtained from Sigma-Aldrich (St Louis, MO), and hyamine hydroxide from MP Biomedicals (Irvine, CA, USA). All other chemicals were obtained from standard sources. Wildtype mice (PepT2+/+) and null mice (PepT2−/−) mice were generated in-house (Shen et al. 2003) in which gender-matched neonatal (day 2) and adult (week 8–10) animals were used for the proposed experiments. Late gestation Sprague-Dawley rats were purchased from Charles River Laboratories (Portage, MI) from which gender-matched rat progeny (day 2 to week 8) were studied. The animals were fed a standard diet, had access to water ad libitum, and were maintained in a temperature-controlled environment of 12-hr light and dark cycles. Animal studies were conducted in accordance with the guidelines from the National Institutes of Health for the care and use of animals, and were approved by the Institutional Animal Care and Use Committee at the University of Michigan.
Real-time PCR of POT gene expression in brain
Following anesthesia with sodium pentobarbital (40–60 mg/kg ip), the cerebral cortex, cerebellum and hippocampus were removed from mouse and rat brains. Total RNA was extracted using the Qiagen RNeasy Mini Kit (Hamburg, Germany) followed by reverse transcription using the Qiagen Omniscript RT Kit (16.5 µL H2O containing 4.0 µg total RNA, 2.0 µL 15-mer random primers, 4.0 µL 0.1 M DTT, 8.0 µL 10 mM dNTPs, 8.0 µL 5x buffer, 0.5 µL Ranisin, 1.0 µL 200 units enzyme), according to the manufacturer’s protocols. Real-time PCR was carried out on an Applied Biosystems 7300 Real-Time PCR System (Foster City, CA) using TaqMan-based detection for mice (9.0 µL H2O containing 100 ng cDNA, 12.5 µL Taqman master mix, 1.25 µL 10 µM forward and reverse primers each, 1.0 µL 5.0 µM probe) and SYBR Green-based detection for rats (7.5 µL H2O containing 30 ng cDNA, 12.5 µL SYBR Green master mix, 2.5 µL 5 µM forward and reverse primers each) (Nolan et al. 2006). The primers, probes and standard DNAs were synthesized by Integrated DNA Technologies (Coralville, Iowa) as listed in Table 1. Real-time PCR conditions were: 1 cycle at 50°C × 2 min, 1 cycle at 95°C × 10 min, 40 cycles at 95°C × 15 sec, and 1 cycle at 60°C × 1 min. The absolute amount of a POT in mice was calculated automatically based on the standard curve, and expressed as the ratio of the POT to GAPDH. Relative mRNA levels of PhT1 in rats were calculated using the ΔCT method in which the ratio of PhT1 to GAPDH genes = 2−ΔCT, ΔCT = CT (PhT1) – CT (GAPDH).
Table 1.
PCR primers, probes and standards for Slc15 gene expression studies in mouse (m) and rat (r) brain
| mPepT1 | Forward primer | 5′-CCACGGCCATTTACCATACG-3′ |
| Reverse primer | 5′-TGCGATCAGAGCTCCAAGAA-3′ | |
| Probe | 5′-/56-FAM/-CGTTGCCCTCTGCTACCTGACTCCA-/36-TAMSp/-3′ | |
| Standard | 5′-GACAATCTCTCCACGGCCATTTACCATACGTTCGTTG CCCTCTGCTACCTGACTCCAATTCTTGGAGCTCTGATCGCAGACTCGTGGC-3′ |
|
| mPhT2 | Forward primer | 5′-TGCAGAGGCACGGACTAGATAC-3′ |
| Reverse primer | 5′-GGGTGTGATGAACGTAGAAATCAA-3′ | |
| Probe | 5′-/56-FAM/-TCTCGGTCTTCTACCTCTCCATCAATG CA-/36-TAMSp/-3′ |
|
| Standard | 5′-AAGAGGAACATGCAGAGGCACGGACTAGATACTTCTC GGTCTTCTACCTCTCCATCAATGCAGGGAGCTTGATTTCTACGTTCATCACACC CATGCTAAG-3′ |
|
| mPhT1 | Forward primer | 5′-GCTGCCACCTGCATTACTACTTC-3′ |
| Reverse primer | 5′-CGTACTTCACAGACACAATGAGGAA-3′ | |
| Probe | 5′-/56-FAM/-CTGGCCGCCATCCAGGGAGC-/36-TAMSp/-3′ | |
| Standard | 5′-AACATCAACAGCTGCCACCTGCATTACTACTTCTTC CTGCTGGCCGCCATCCAGGGAGCTACGCTGCTGCTCTTCCTCATTGTGTCTGT GAAGTACGACCGCCAGCG-3′ |
|
| mPhT2 | Forward primer | 5′-GCTGAAGCTTGCGTTCCAA-3′ |
| Reverse primer | 5′-AACAGGTGGGCACTTTCAGAGT-3′ | |
| Probe | 5′-/56-FAM/-CTGCTGTCCCTGCCGGAAGTCCT-/36-TAMSp/-3′ | |
| Standard | 5′-TGTCATCTATGCTGAAGCTTGCGTTCCAAAACTGCTGTCCC TGCCGGAAGTCCTCTTCCAGGGACTCTGAAAGTGCCCACCTGTTGCCTGACC AGA-3′ |
|
| mGAPDH | Forward primer | 5′-GAGACAGCCGCATCTTCTTGT-3′ |
| Reverse primer | 5′-CACACCGACCTTCACCATTTT-3′ | |
| Probe | 5′-/56-JOE/-CAGTGCCAGCCTCGTCCCGTAGA-/36-TAMSp/-3′ | |
| Standard | 5′-TCCCTGTTCCAGAGACAGCCGCATCTTCTTGTGCAGTGCCA GCCTCGTCCCGTAGACAAAATGGTGAAGGTCGGTGTGAACGGATTTG-3′ |
|
| rPhT1 | Forward primer | 5′-GGTGTGGCCACGGTCAA-3′ |
| Reverse primer | 5′-GGCCTCTGGACCTCGATCTT-3′ | |
| rGAPDH | Forward primer | 5′-TGGCCTCCAAGGAGTAAGAAAC-3′ |
| Reverse primer | 5′-GGCCTCTCTCTTGCTCTCAGTATC-3′ |
Immunoblots of PhT1 protein expression in brain
Following sodium pentobarbital anesthesia (40–60 mg/kg ip), regional brain tissues from mice and rats were homogenized in 2.0 mL Nonidet P40-lysis buffer (50 mM Tris-HCl, 150 mM NaCl, 1% Nonidet P40, proteinase inhibitor cocktail, pH 8.0), sonicated for 10 pulses at one-half strength, and then centrifuged at 15,000 g × 15 min at 4°C. Protein concentrations were measured using the BCA Protein Assay Kit (Thermo Fisher Scientific, Rockford, IL), after which 20 µg protein samples were separated by 7.5% SDS-PAGE electrophoresis and transferred onto PVDF membranes (Millipore, Billerica, MA). Following pre-incubation with TBST buffer containing 5% nonfat milk (∼ 1 hr), the primary antibody, rabbit anti-rat PhT1 antiserum (Sun et al. 2013), was added to the TBST buffer (1:1000 dilution) and incubated for 60 min at room temperature. The membranes were washed three times, the secondary antibody added, goat anti-rabbit IgG-HRP antiserum (1:3000 dilution), and then incubated for 45 min at room temperature. After washing four times with TBST buffer, the bound antibody was detected with Immobilon Western Chemiluminescent HRP Substrate (Millipore, Billerica, MA).
GlySar uptake in regional brain slices
Once anesthetized with sodium pentobarbital (40–60 mg/kg ip), the mice and rats were decapitated and their cerebral cortex, cerebellum and hippocampus dissected and weighed. Brain slices, 300 µm thick, were then prepared in artificial CSF (aCSF) using a McIlwain tissue chopper (Brinkmann Instrument, NY, USA) (Reid et al. 1988) The aCSF buffer consisted of (mM) 127 NaCl, 20 NaHCO3, 2.4 KCl, 0.5 KH2PO4, 1.1 CaCl2, 0.85 MgCl2, 0.5 Na2SO4 and 5.0 glucose (pH 7.4). During experimentation (see below), the aCSF buffer was warmed to 37°C and continuously bubbled with 5% CO2 and 95% O2.
Regional brain slices were pre-incubated for 10 min and then transferred into 0.5 mL fresh aCSF buffer containing 2.0 µM [14C]GlySar (0.1 µCi) and [3H]mannitol (0.2 µCi). For some studies, excess (5 mM) unlabeled GlySar or L-histidine was added to the incubation buffer containing radiolabeled GlySar. After a 10 min incubation period (determined by preliminary studies to be optimal), 1.0 mL ice-cold aCSF buffer was added to terminate the reaction. The sample was immediately filtered through 100 µm nylon mesh, under reduced pressure, and then washed four times with 1.0 mL ice-cold aCSF buffer. The filter and tissue slice were transferred to a scintillation vial, 0.33 mL hyamine hydroxide was added and the vial situated overnight at room temperature until the tissue slices had dissolved. A 7.0 mL aliquot of Cytoscint cocktail (MP Biomedicals, Solon, OH) was mixed and the radioactivity measured by a Beckman LS 6000 SC dual-channel liquid scintillation counter (Beckman Coulter Inc., Fullerton, CA). Uptake of GlySar in the brain slice was expressed as (Teuscher et al. 2000):
in which the uptake (µL/g wet tissue weight) was corrected for both filter binding and extracellular content. GlySart and GlySarf are the amounts of GlySar in the tissue plus filter and filter binding, respectively, Mannitolt and Mannitolf are the respective amounts of mannitol in the tissue plus filter and filter binding, and GlySarmedia and Mannitolmedia are the concentrations of GlySar and mannitol in the external media.
Data analysis and statistics
Dose-response parameters were evaluated in regional brain slices using the partial inhibition equation:
where the uptake of substrate (GlySar) was determined as a function of increasing inhibitor concentrations. According to this relationship, No Inh represents the uptake of GlySar in the absence of L-histidine, Imax is the maximal inhibition of GlySar uptake by L-histidine, IC50 is the concentration of L-histidine at which one-half the Imax is reached, and Inh is the concentration of inhibitor (L-histidine). The relationship was evaluated by nonlinear least-squares regression using Prism v5.0 (GraphPad Software, Inc., La Jolla, CA) and a weighting of unity. Quality of the fit was evaluated by standard error of the parameters, the coefficient of determination (r2), and by visual inspection of the residuals.
Data are reported as mean ± SE unless otherwise indicated. A two-tailed Student’s t test was used to compare statistical differences between two groups. For multiple comparisons, one-way analysis of variance was used followed by Tukey’s or Dunnett’s test, as appropriate, for pairwise comparisons between the groups. A p value ≤ 0.05 was considered statistically significant.
Results
SLC15 gene - PhT1 protein expression and GlySar uptake in regional brain slices from adult mice
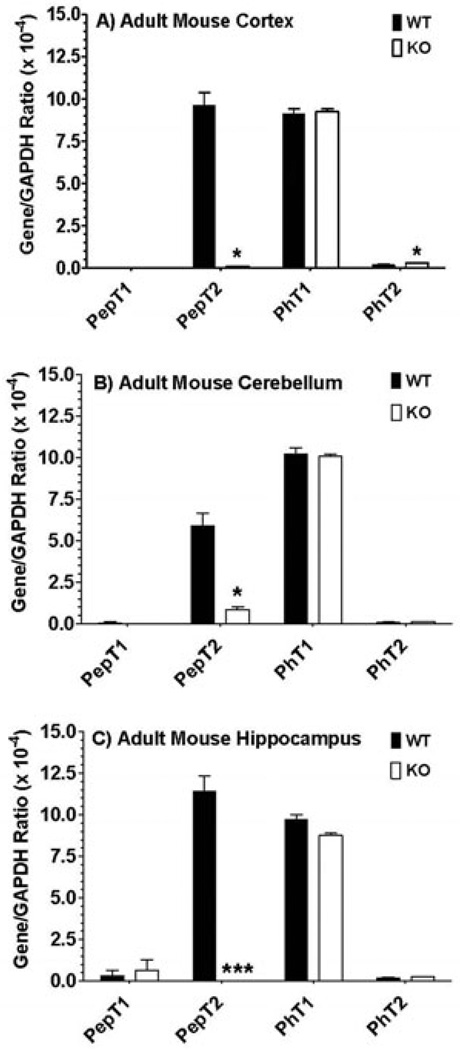
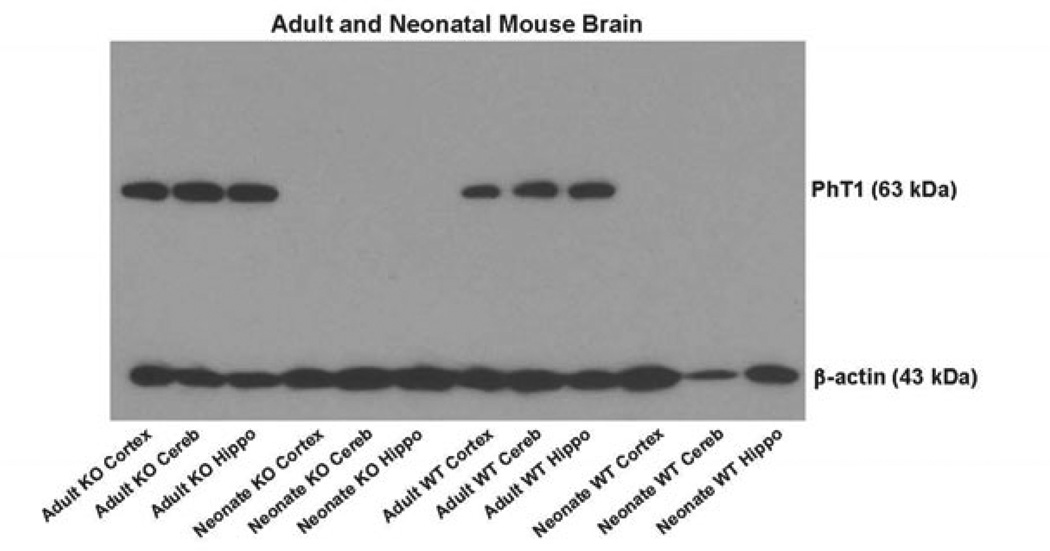
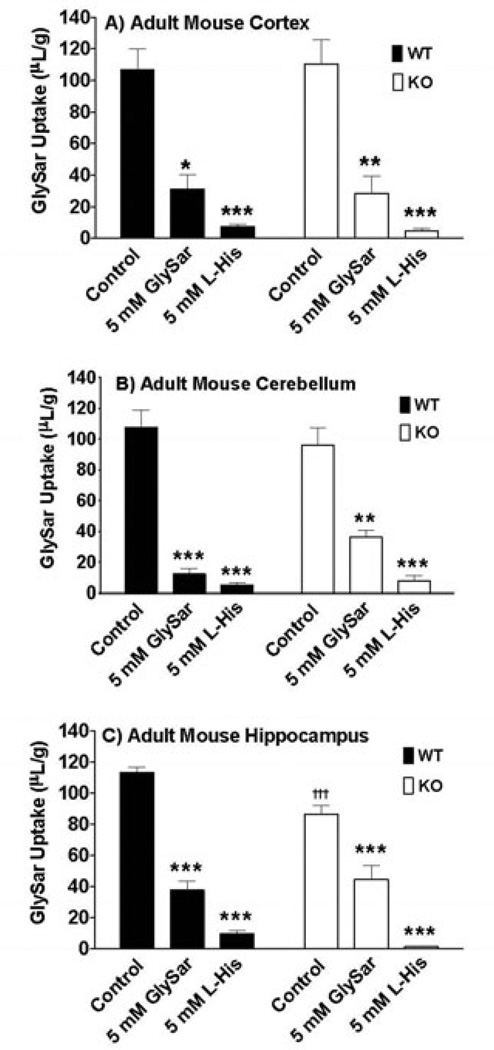
The relative gene expression of SLC15 family members in adult wildtype and PepT2 null mice is displayed in Figure 1. The same expression pattern was evident in cerebral cortex (Figure 1A), cerebellum (Figure 1B) and hippocampus (Figure 1C), in which PepT2 and PhT1 transcripts were abundantly expressed. In contrast, little to no gene expression of PepT1 and PhT2 was observed. In performing immunoblot analyses of PhT1 protein, the transporter was present in all three regions of the brain in adult wildtype and PepT2 null mice (Figure 2). With respect to function, transport inhibitors had a similar effect on the uptake of radiolabeled GlySar in cortical, cerebellar and hippocampal brain slices of adult mice (Figure 3). In the presence of 5 mM unlabeled GlySar, the uptake of 2 µM [14C]GlySar was reduced by about 75% and 62%, respectively, in wildtype and PepT2 null mice. The uptake of GlySar was reduced to less than 10% of control values by 5 mM L-histidine in both genotypes. In contrast, there was no significant difference in GlySar uptake between wildtype and PepT2 null mice in slices prepared from cerebral cortex (Figure 3A) and cerebellum (Figure 3B). A minor reduction (24%), however, was observed in the hippocampus of null animals (Figure 3C). Collectively, the results suggest that PhT1, and not PepT2, has a major influence on GlySar uptake in regional brain slices from adult mice.
Figure 1.
Real-time PCR of POT transcripts in the cerebral cortex (A), cerebellum (B) and hippocampus (C) of adult wildtype (WT) and PepT2 null (KO) mouse brain. Data are reported as the ratio to GAPDH determined in each sample. Values are mean ± SE (n=3). *p ≤ 0.05 and ***p ≤ 0.001 as compared to WT mice.
Figure 2.
Immunoblots of PhT1 protein expression in the cerebral cortex, cerebellum (cereb) and hippocampus (hippo) of adult and neonatal wildtype (WT) and PepT2 null (KO) mouse brain. Beta actin served as a loading control.
Figure 3.
Effect of potential inhibitors, GlySar and histidine (L-His), on the uptake of 2 µM [14C]GlySar in brain slices prepared from the cerebral cortex (A), cerebellum (B) and hippocampus (C) of adult wildtype (WT) and PepT2 null (KO) mouse brain. Values are mean ± SE (n=6). *p ≤ 0.05, **p ≤ 0.01 and ***p ≤ 0.001 as compared to control in the same genotype and †††p ≤ 0.001 as compared to same treatment in the other genotype.
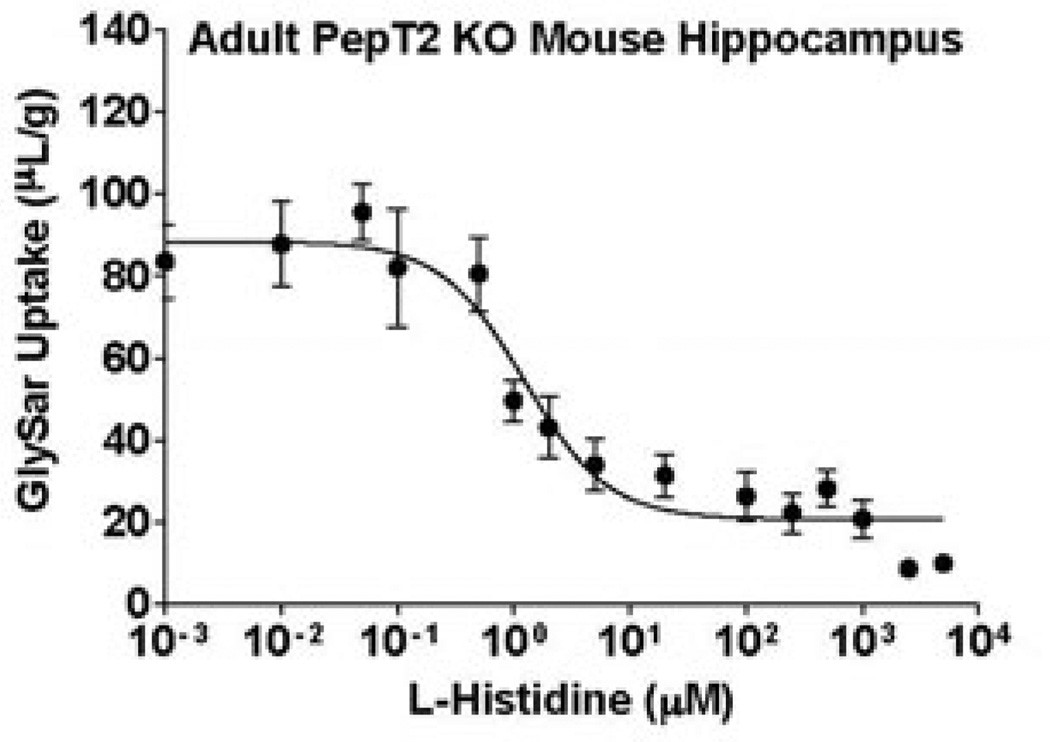
To further explore the role of PhT1 in mouse brain, we performed a dose-response inhibitory analysis of 2 µM GlySar uptake by 0.001 µM to 5 mM L-histidine in cortical, cerebellar and hippocampal brain slices from adult PepT2 null mice. As shown in Table 2 and Figure 4, a dose-dependent reduction in GlySar uptake was observed in which the IC50 of L-histidine ranged from 0.76 µM in cerebral cortex to 1.25 µM in hippocampus. Moreover, about 80% of the GlySar uptake was maximally inhibited by L-histidine, regardless of brain region.
Table 2.
Dose-response parameters of the inhibition of GlySar (Uptake) by L-histidine (Inh) in different regions of adult brain from PepT2 null mice
| Tissue | No Inh (µL/g) |
Imax (µL/g) |
IC50 (µM) |
r2 | Max Inh (%) |
|---|---|---|---|---|---|
| Cortex | 100 ± 5 | 82 ± 6 | 0.76 ± 0.27 | 0.942 | 82 |
| Cerebellum | 85 ± 5 | 70 ± 6 | 0.80 ± 0.35 | 0.949 | 82 |
| Hippocampus | 89 ± 4 | 69 ± 4 | 1.25 ± 0.38 | 0.951 | 78 |
Figure 4.
Dose-response inhibition of 2 µM [14C]GlySar uptake by L-histidine in brain slices prepared from the hippocampus of adult PepT2 null (KO) mice. Similar results were obtained in the cerebral cortex and cerebellum of mice (data not shown). Values are mean ± SE (n=3).
SLC15 gene – PhT1 protein expression and GlySar uptake in regional brain slices from neonatal mice
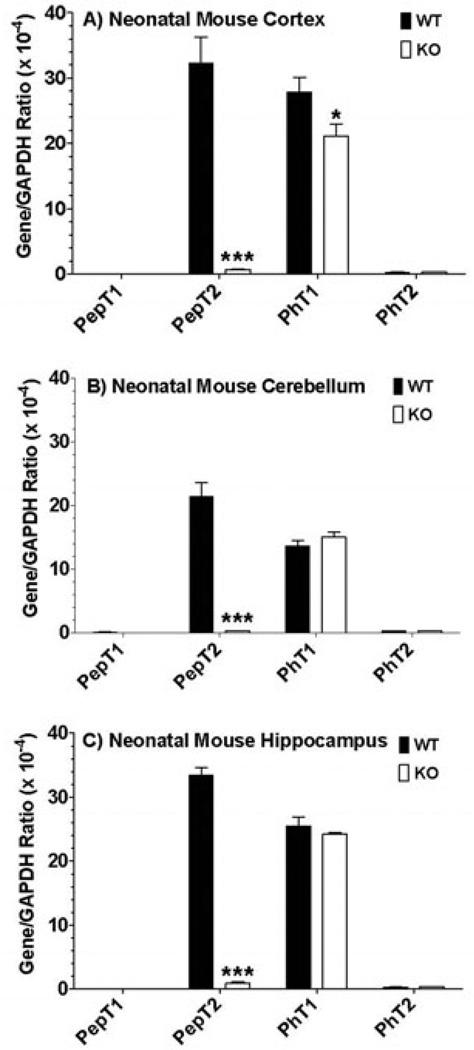
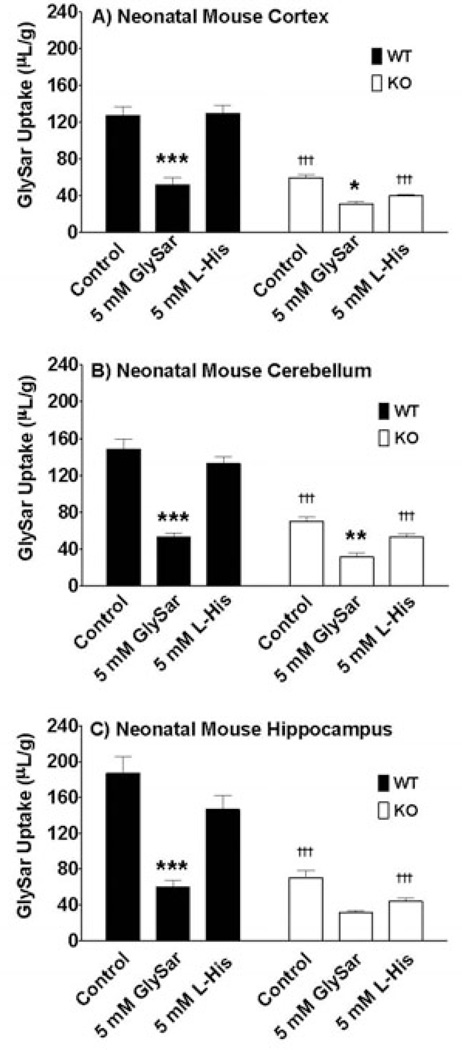
The relative gene expression of SLC15 family members in neonatal wildtype and PepT2 null mice is displayed in Figure 5. These results were very similar to that of adult mice in that PepT2 and PhT1 were highly expressed in cerebral cortex (Figure 5A), cerebellum (Figure 5B) and hippocampus (Figure 5C), while PepT1 and PhT2 were not expressed to any meaningful degree in these regions. One notable difference was that the expression of PepT2 and PhT1 mRNA was 3.2- and 2.4-fold greater in neonates than in adults, respectively, for all tissue slice preparations (p < 0.01). Moreover, immunoblot analyses clearly demonstrated that PhT1 protein was absent from all brain regions of neonatal wildtype and PepT2 null mice (Figure 2). Functionally, 5 mM of unlabeled GlySar reduced the uptake of 2 µM [14C]GlySar in neonatal brain slices from wildtype and PepT2 null mice by about 64% and 53%, respectively (Figure 6). However, in contrast to adult mice (Figure 3), the uptake of GlySar under control conditions was substantially reduced (> 50%) in neonatal PepT2 null compared to wildtype mice for all three brain regions. In addition, neonatal mice did not exhibit an effect of L-histidine on GlySar uptake in cortical (Figure 6A), cerebellar (Figure 6B) and hippocampal (Figure 6C) brain slices, regardless of genotype. Collectively, the results suggest that PepT2, and not PhT1, has a major influence on GlySar uptake in regional brain slices from neonatal mice.
Figure 5.
Real-time PCR of POT transcripts in the cerebral cortex (A), cerebellum (B) and hippocampus (C) of neonatal wildtype (WT) and PepT2 null (KO) mouse brain. Data are reported as the ratio to GAPDH determined in each sample. Values are mean ± SE (n=3). *p ≤ 0.05 and ***p ≤ 0.001 as compared to WT mice.
Figure 6.
Effect of potential inhibitors, GlySar and histidine (L-His), on the uptake of 2 µM [14C]GlySar in brain slices prepared from the cerebral cortex (A), cerebellum (B) and hippocampus (C) of neonatal wildtype (WT) and PepT2 null (KO) mouse brain. Values are mean ± SE (n=6). *p ≤ 0.05, **p ≤ 0.01 and ***p ≤ 0.001 as compared to control in the same genotype and †††p ≤ 0.001 as compared to same treatment in the other genotype.
SLC15 gene - PhT1 protein expression and GlySar uptake in regional brain slices from developing rat
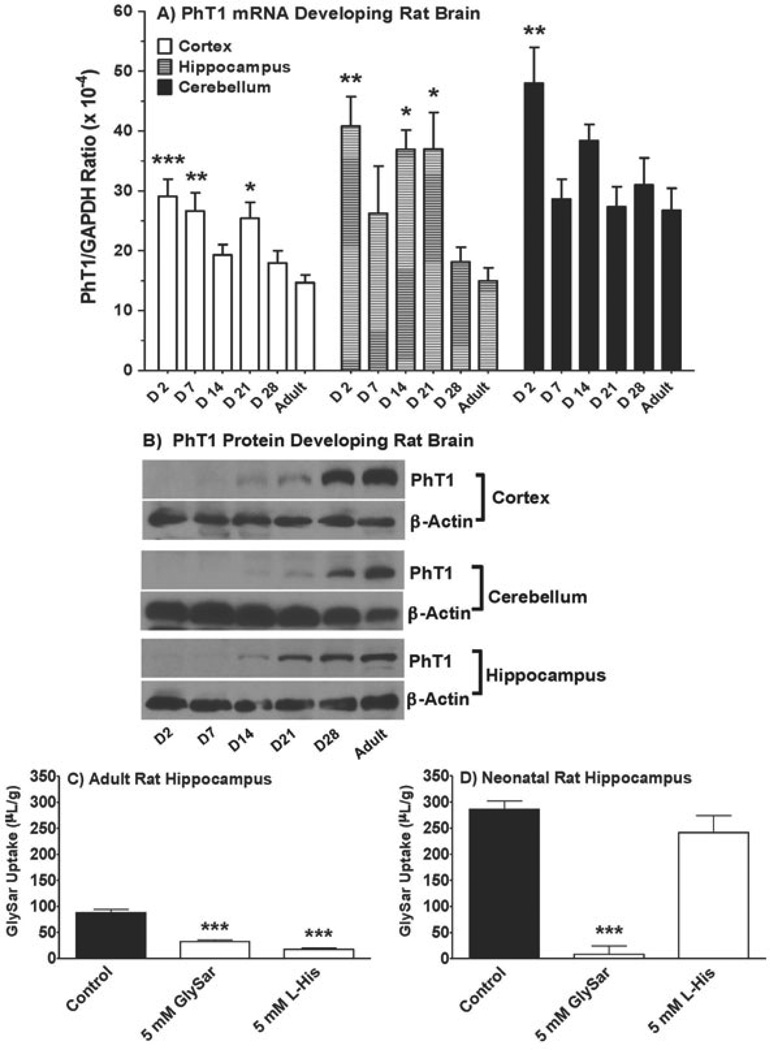
Given that peptide transporter expression and activity are typically performed in mice and/or rats, further studies were initiated in developing rat brains. As shown in Figure 7A, PhT1 mRNA was present in the cerebral cortex, cerebellum and hippocampus of day 2 to adult rats with no consistent trend, although expression levels tended to be higher in neonatal and younger animals. Despite this observation, immunoblot analyses demonstrated that PhT1 protein expression was not observed for the first 7 days after birth but increased steadily in all three brain regions, reaching a maximal value in the adult rat (Figure 7B). We also found that 5 mM unlabeled GlySar or L-histidine reduced the uptake of 2 µM [14C]GlySar by 63% and 81%, respectively, in the hippocampal region of adult rat brain (Figure 7C). However, in neonatal rats, although saturating concentrations of unlabeled GlySar inhibited the uptake of radiolabeled GlySar by 97%, L-histidine had no effect on GlySar uptake (Figure 7D). Similar results were obtained when GlySar uptakes were performed in cortical and cerebellar brain slices (data not shown). Thus, the results in rats corroborated our findings in mice, supporting the tenet that while PepT2 may have a greater role in peptide/mimetic uptake in brain parenchyma during early development, PhT1 may be more important in adults.
Figure 7.
Real-time PCR of PhT1 transcripts (A) and immunoblots of PhT1 protein expression (B) in the cerebral cortex, cerebellum and hippocampus of rat brain from day 2 (D2) to week 8 (Adult), and effect of potential inhibitors, GlySar and histidine (L-His), on the uptake of 2 µM [14C]GlySar in brain slices prepared from the hippocampus of adult (C) and neonatal (D) rat brain. Similar functional results were obtained in the cerebral cortex and cerebellum of rats (data not shown). Values are mean ± SE (n=6). *p ≤ 0.05, **p ≤ 0.01, and ***p ≤ 0.001 as compared to adult (panel A) and control (panels C and D) animals.
Discussion
There is a paucity of data on the expression and functional activity of SLC15 family members in different brain regions. Previous immunofluorescence experiments in rats have demonstrated that PepT2 was widely distributed throughout the brain with its strongest expression being observed in epithelial cells of the choroid plexus from both adult and neonatal animals (Shen et al. 2004). Moreover, the expression levels of PepT2 protein were highest in fetal cerebral cortex, decreasing monotonically to only 14% of this maximal value in adult rats. This finding was consistent with PepT2 being expressed in the astrocytes and neurons of neonatal rats but only in the neurons of adult rats. However, these studies did not evaluate the activity of PepT2 as a function of age or brain region. Previous autoradiography experiments in mice showed that PepT2 ablation significantly modified the spatial distribution of GlySar and cefadroxil in brain (Smith et al. 2011), but this and prior studies (Shen et al. 2004) were insufficient in evaluating other (non-PepT2) peptide transporters and the effect of age on regional brain activity.
In the present study, we report several new findings regarding the expression and functional activity of SLC15 family members in regional brain slices from rodents. In particular, we found the following: 1) PepT2 and PhT1 transcripts were expressed in the cerebral cortex, cerebellum and hippocampus of mice, whereas PepT1 and PhT2 transcripts had minimal or no expression in these brain regions, 2) PhT1 protein was present in all three brain regions of adult but not neonatal mice; expression levels increased steadily in rats as a function of advancing age, 3) the functional activity of PepT2 dominated in neonatal mice and rats but the activity of PhT1 dominated in adult mice and rats, 4) the cerebral cortex, cerebellum and hippocampus behaved similarly with respect to the uptake of GlySar in these tissues (i.e., no regional differences), 5) the great majority of GlySar uptake was inhibited by L-His (Max Inh ≈ 80% and IC50 ≈ 1 µM) in adult mice lacking PepT2, and 6) GlySar uptake, inhibition and SLC15 protein dominance in the developing brain were similar between mice and rats (i.e., no species differences). Taken together, it appears that PepT2 and PhT1 may have reciprocating relevance in brain parenchyma with the former being more important in neonatal rodents and the latter being more important in the adult. The reason why these peptide transporters are regulated in such a manner is unclear.
The physiological, pharmacological and pathological relevance of PhT1 has been difficult to study because definitive information on its cellular and subcellular distribution in brain is lacking. Yamashita et al (1997) reported in adult rats that PhT1 mRNA was widely distributed throughout the brain with intense hybridization signals in hippocampus, choroid plexus, cerebellum, and pontine nucleus. The signals were located in both neuronal and non-neuronal cells in these areas. Based on their findings, the authors speculated that PhT1 might be involved in the homeostasis of histamine in brain (i.e., after histidine uptake and decarboxylation), in the termination of neuromodulator effects (i.e., after synaptic and/or astrocytic uptake of small peptides), and the removal of neuropeptide metabolic fragments from synaptic regions. However, there have been questions raised over whether PhT1 is expressed on the plasma membrane of mammalian cells (Daniel and Kottra 2004; Herrera-Ruiz and Knipp 2003; Kamal et al. 2008). As demonstrated previously by our laboratory in choroid plexus from adult rats (Novotny et al. 2000; Shu et al. 2002; Teuscher et al. 2000; 2001), and by others in synaptosomes from adult rat cerebellum and cerebral cortex (Fujita et al. 1999; 2004) and astroglia-rich primary cultures from neonatal rats (Dieck et al. 1999; Dringen et al. 1998), it is unlikely that PhT1 is active at the plasma membrane of these preparations. This assertion is based on functional studies in which neither an inhibitory effect of excess L-histidine on dipeptide uptake nor an inhibitory effect of excess dipeptide on L-histidine uptake was observed. Instead, immunohistochemical analyses showed that PhT1 co-localized with a late endosome/lysosome marker in RAW264.7 and COS7 transfected cells (Sasawatari et al. 2011) and another study using immunofluorescence had PhT1 co-localizing with a marker of early endosomes in HEK293T cells (Lee et al. 2009). However, in contrast to that cell line data, the current study on fresh adult brain slices demonstrated that PhT1 has a role in tissue peptide uptake. The impact of L-histidine on GlySar uptake is very unlikely to be due to an effect on PhT2-mediated transport given the almost complete lack of expression of that transporter in the brain slices.
Our molecular and functional studies in regional brain slices suggest a role for PhT1 in the age-dependent cellular uptake of peptides/mimetics and L-histidine in brain parenchyma, the cell type of which needs further study. The results in mice and rats further demonstrated that PhT1 protein expression was increased developmentally and in a similar manner to that of the histaminergic system (i.e., histidine decarboxylase and the histamine receptors) (Martres et al. 1975; Reiner et al. 1988; Subramanian et al. 1981; Toledo et al. 1988; Tran et al. 1980). PepT2 protein expression, on the other hand, decreased with age in rats (Shen et al. 2004). Thus, PhT1 may have an important role, one that is developmentally regulated, in peptide/mimetic and histidine trafficking in brain. The developmental change in PhT1 protein expression matched the change in L-histidine-inhibitable GlySar uptake in both mouse and rat brain slices offering further evidence that PhT1 (rather than PhT2) was responsible for that transport.
Even though there was a good congruence between developmental changes in PhT1 protein expression and functional activity, brain slices from neonatal mice and rats expressed PhT1 mRNA but not PhT1 protein. The cause of this repression of translation in the neonate and whether it can be manipulated is unknown. It is also unclear as to why a marked residual uptake of radiolabeled GlySar remains in neonatal brain slices (i.e., ≈ 40%) during 5 mM GlySar inhibition in wildtype mice or in PepT2 null animals (see Figure 6). Although speculative, this residual activity may reflect a greater passive and/or low-affinity endocytic component as compared to adult mice. Future studies will be needed to address the validity of these proposed mechanisms.
Discerning the localization and functional relevance of PhT1 in brain would extend our understanding of neuropeptide trafficking, histidine transport, and the potential for drug delivery to neuronal and non-neuronal cell types. Histamine synthesis in the brain is dependent upon the availability of L-histidine and the activity of histidine decarboxylase (Hough et al. 2006; Haas et al. 2008). While much of the research effort has focused on the enzymatic activation of histamine via histidine decarboxylation, little attention has been paid to the mechanism by which L-histidine gains entry into neurons. Indeed, neuronal entry of histidine is believed to occur by L-amino acid transporters (e.g., SLC38 family) (http://slc.bioparadigms.org). We postulate that PhT1 may also have a major influence in histidine uptake and, therefore, histamine homeostasis. However, the relative importance of various amino acid transporters vs. that of PhT1 in transporting L-histidine in brain is unknown. This knowledge is critical because significant changes in brain histamine levels have been observed in several neurological diseases, such as multiple sclerosis, Alzheimer’s disease, Downs’ syndrome and Wernicke’s encephalopathy, making the histaminergic system a prime candidate for novel drug targets. The finding that PhT1-deficient mice had severe decreases in TLR9- and NOD1-mediated cytokine production suggests that PhT1 may also have a role in regulating innate immune responses (Sasawatari et al. 2011). Finally, several papers have suggested a relationship between PhT1 mutations and systemic lupus erythematosis susceptibility (Han et al. 2009; He et al. 2010; Lee et al. 2013), and one paper proposed PhT1 as a possible target for therapeutic intervention in human lupus (Baccala et al. 2013).
In concluding, there are marked developmental changes in the protein expression and functional activity of PhT1 and PepT2 in brain, with the former predominating in adult and the latter in neonate. These changes may impact the interstitial fluid concentration and biological activity of endogenous peptides and peptide/mimetic drugs.
Acknowledgements
This work was supported by the National Institutes of Health National Institute of General Medical Sciences (Grant R01-GM035498 to DES) and National Institute of Neurological Disorders and Stroke (Grant R01-NS037409 to RFK).
Abbreviations used
- 5-ALA
5-aminolevulinic acid
- COS7
monkey kidney fibroblast-like cell line
- GlySar
glycylsarcosine
- HEK293T
human embryonic kidney cell line
- NOD1
nucleotide-binding oligomerization domain-containing protein 1
- PhT(s)
peptide-histidine transporters
- POT(s)
proton-coupled oligopeptide transporter(s)
- RAW264.7
murine macrophage-like cell line
- Slc
solute carrier family
- TLR9
toll-like receptor 9
Footnotes
The authors have no conflict of interest to declare.
References
- Baccala R, Gonzalez-Quintial R, Blasius AL, Rimann I, Ozato K, Kono DH, Beutler B, Theofilopoulos AN. Essential requirement for IRF8 and SLC15A4 implicates plasmacytoid dendritic cells in the pathogenesis of lupus. Proc. Natl. Acad. Sci. U. S. A. 2013;110:2940–2945. doi: 10.1073/pnas.1222798110. [DOI] [PMC free article] [PubMed] [Google Scholar]
- Brandsch M, Knutter I, Bosse-Doenecke E. Pharmaceutical and pharmacological importance of peptide transporters. J. Pharm. Pharmacol. 2008;60:543–585. doi: 10.1211/jpp.60.5.0002. [DOI] [PubMed] [Google Scholar]
- Daniel H, Kottra G. The proton oligopeptide cotransporter family SLC15 in physiology and pharmacology. Pflugers Archiv. 2004;447:610–618. doi: 10.1007/s00424-003-1101-4. [DOI] [PubMed] [Google Scholar]
- Dieck ST, Heuer H, Ehrchen J, Otto C, Bauer K. The peptide transporter PepT2 is expressed in rat brain and mediates the accumulation of the fluorescent dipeptide derivative β-Ala-Lys-Nε -AMCA in astrocytes. Glia. 1999;25:10–20. doi: 10.1002/(sici)1098-1136(19990101)25:1<10::aid-glia2>3.0.co;2-y. [DOI] [PubMed] [Google Scholar]
- Dringen R, Hamprecht B, Bröer S. The peptide transporter PepT2 mediates the uptake of the glutathione precursor CysGly in astroglia-rich primary cultures. J. Neurochem. 1998;71:388–393. doi: 10.1046/j.1471-4159.1998.71010388.x. [DOI] [PubMed] [Google Scholar]
- Fujita T, Kishida T, Okada N, Ganapathy V, Leibach FH, Yamamoto A. Interaction of kyotorphin and brain peptide transporter in synaptosomes prepared from rat cerebellum: Implication of high affinity type H+/peptide transporter PEPT2 mediated transport system. Neurosci. Lett. 1999;271:117–120. doi: 10.1016/s0304-3940(99)00540-6. [DOI] [PubMed] [Google Scholar]
- Fujita T, Kishida T, Wada M, Okada N, Yamamoto A, Leibach FH, Ganapathy V. Functional characterization of brain peptide transporter in rat cerebral cortex: Identification of the high-affinity type H+/peptide transporter PEPT2. Brain Res. 2004;997:52–61. doi: 10.1016/j.brainres.2003.10.049. [DOI] [PubMed] [Google Scholar]
- Groneberg DA, Doring F, Eynott PR, Fischer A, Daniel H. Intestinal peptide transport: ex vivo uptake studies and localization of peptide carrier PEPT1. Am. J. Physiol. Gastrointest. Liver Physiol. 2001;281:G697–G704. doi: 10.1152/ajpgi.2001.281.3.G697. [DOI] [PubMed] [Google Scholar]
- Haas HL, Sergeeva OA, Selbach O. Histamine in the nervous system. Physiol. Rev. 2008;88:1183–1241. doi: 10.1152/physrev.00043.2007. [DOI] [PubMed] [Google Scholar]
- Han J-W, Zheng H-F, Cui Y, Sun L-D, Ye D-Q, Hu Z, Xu J-H, Cai Z-M, Huang W, Zhao G-P, Xie H-F, Fang H, Lu Q-J, Xu J-H, Li X-P, Pan Y-F, Deng D-Q, Zeng F-Q, Ye Z-Z, Zhang X-Y, Wang Q-W, Hao F, Ma L, Zuo X-B, Zhou F-S, Du W-H, Cheng Y-L, Yang J-Q, Shen S-K, Li J, Sheng Y-J, Zuo X-X, Zhu W-F, Gao F, Zhang P-L, Guo Q, Li B, Gao M, Xiao F-L, Quan C, Zhang C, Zhang Z, Zhu K-J, Li Y, Hu D-Y, Lu W-S, Huang J-L, Liu S-X, Li H, Ren Y-Q, Wang Z-X, Yang C-J, Wang P-G, Zhou W-M, Lv Y-M, Zhang A-P, Zhang S-Q, Lin D, Li Y, Low HQ, Shen M, Zhai Z-F, Wang Y, Zhang F-Y, Yang S, Liu J-J, Zhang X-J. Genome-wide association study in a Chinese Han population identifies nine new susceptibility loci for systemic lupus erythematosus. Nature Genet. 2009;41:1234–1237. doi: 10.1038/ng.472. [DOI] [PubMed] [Google Scholar]
- He CF, Liu YS, Cheng YL, Gao JP, Pan TM, Han JW, Quan C, Sun LD, Zheng HF, Zuo XB, Xu SX, Sheng YJ, Yao S, Hu WL, Li Y, Yu ZY, Yin XY, Zhang XJ, Cui Y, Yang S. TNIP1, SLC15A4, ETS1, RasGRP3 and IKZF1 are associated with clinical features of systemic lupus erythematosus in a Chinese Han population. Lupus. 2010;19:1181–1186. doi: 10.1177/0961203310367918. [DOI] [PubMed] [Google Scholar]
- Herrera-Ruiz D, Knipp GT. Current perspectives on established and putative mammalian oligopeptide transporters. J. Pharm. Sci. 2003;92:691–714. doi: 10.1002/jps.10303. [DOI] [PubMed] [Google Scholar]
- Hough LB, Leurs R. Histamine. In: Siegel GJ, Albers RW, Brady ST, Price DL, editors. Basic Neurochemistry: Molecular, Cellular, and Medical Aspects. Seventh Edition. London: Elsevier; 2006. pp. 249–265. [Google Scholar]
- Hu Y, Shen H, Keep RF, Smith DE. Peptide transporter 2 (PEPT2) expression in brain protects against 5-aminolevulinic acid neurotoxicity. J. Neurochem. 2007;103:2058–2065. doi: 10.1111/j.1471-4159.2007.04905.x. [DOI] [PubMed] [Google Scholar]
- Jappar D, Wu SP, Hu Y, Smith DE. Significance and regional dependency of peptide transporter (PEPT) 1 in the intestinal permeability of glycylsarcosine: in situ single-pass perfusion studies in wild-type and Pept1 knockout mice. Drug Metab. Dispos. 2010;38:1740–1746. doi: 10.1124/dmd.110.034025. [DOI] [PMC free article] [PubMed] [Google Scholar]
- Jiang H, Hu Y, Keep RF, Smith DE. Enhanced antinociceptive response to intracerebroventricular kyotorphin in Pept2 null mice. J. Neurochem. 2009;109:1536–1543. doi: 10.1111/j.1471-4159.2009.06090.x. [DOI] [PMC free article] [PubMed] [Google Scholar]
- Kamal MA, Keep RF, Smith DE. Role and relevance of PEPT2 in drug disposition, dynamics, and toxicity. Drug Metab. Pharmacokinet. 2008;23:236–242. doi: 10.2133/dmpk.23.236. [DOI] [PMC free article] [PubMed] [Google Scholar]
- Keep RF, Smith DE. Oligopeptide and peptide-like drug transport. In: Kastin AJ, editor. The Handbook of Biologically Active Peptides. Burlington: Elsevier; 2013. pp. 1688–1695. [Google Scholar]
- Lee HS, Kim T, Bang SY, Na YJ, Kim I, Kim K, Kim JH, Chung YJ, Shin HD, Kang YM, Shim SC, Suh CH, Park YB, Kim JS, Kang C, Bae SC. Ethnic specificity of lupus-associated loci identified in a genome-wide association study in Korean women. Ann. Rheum. Dis. 2013 doi: 10.1136/annrheumdis-2012-202675. [Epub ahead of print] [DOI] [PubMed] [Google Scholar]
- Lee J, Tattoli I, Wojtal KA, Vavricka SR, Philpott DJ, Girardin SE. pH-dependent internalization of muramyl peptides from early endosomes enables Nod1 and Nod2 signaling. J. Biol. Chem. 2009;284:23818–23829. doi: 10.1074/jbc.M109.033670. [DOI] [PMC free article] [PubMed] [Google Scholar]
- Martres MP, Baudry M, Schwartz JC. Histamine synthesis in the developing rat brain: Evidence for a multiple compartmentation. Brain Res. 1975;83:261–275. doi: 10.1016/0006-8993(75)90935-x. [DOI] [PubMed] [Google Scholar]
- Nolan T, Hands RE, Bustin SA. Quantification of mRNA using real-time RT-PCR. Nat. Protoc. 2006;1:1559–1582. doi: 10.1038/nprot.2006.236. [DOI] [PubMed] [Google Scholar]
- Novotny A, Xiang J, Stummer W, Teuscher NS, Smith DE, Keep RF. Mechanisms of 5-aminolevulinic acid uptake at the choroid plexus. J. Neurochem. 2000;75:321–328. doi: 10.1046/j.1471-4159.2000.0750321.x. [DOI] [PubMed] [Google Scholar]
- Reid KH, Edmonds HL, Jr, Schurr A, Tseng MT, West CA. Pitfalls in the use of brain slices. Progress Neurobiol. 1988;31:1–18. doi: 10.1016/0301-0082(88)90020-2. [DOI] [PubMed] [Google Scholar]
- Reiner PB, Semba K, Fibiger HC, McGeer EG. Ontogeny of histidine-decarboxylase-immunoreactive neurons in the tuberomammillary nucleus of the rat hypothalamus: Time of origin and development of transmitter phenotype. J. Comp. Neurol. 1988;276:304–311. doi: 10.1002/cne.902760212. [DOI] [PubMed] [Google Scholar]
- Rubio-Aliaga I, Daniel H. Peptide transporters and their roles in physiological processes and drug disposition. Xenobiotica. 2008;38:1022–1042. doi: 10.1080/00498250701875254. [DOI] [PubMed] [Google Scholar]
- Sakata K, Yamashita T, Maeda M, Moriyama Y, Shimada S, Tohyama M. Cloning of a lymphatic peptide/histidine transporter. Biochem. J. 2001;356:53–60. doi: 10.1042/0264-6021:3560053. [DOI] [PMC free article] [PubMed] [Google Scholar]
- Sasawatari S, Okamura T, Kasumi E, Tanaka-Furuyama K, Yanobu-Takanashi R, Shirasawa S, Kato N, Toyama-Sorimachi N. The solute carrier family 15A4 regulates TLR9 and NOD1 functions in the innate immune system and promotes colitis in mice. Gastroenterology. 2011;140:1513–1525. doi: 10.1053/j.gastro.2011.01.041. [DOI] [PubMed] [Google Scholar]
- Shen H, Smith DE, Keep RF, Brosius FC., 3rd Immunolocalization of the proton-coupled oligopeptide transporter PEPT2 in developing rat brain. Mol. Pharm. 2004;1:248–256. doi: 10.1021/mp049944b. [DOI] [PubMed] [Google Scholar]
- Shen H, Smith DE, Keep RF, Xiang J, Brosius FC., 3rd Targeted disruption of the PEPT2 gene markedly reduces dipeptide uptake in choroid plexus. J. Biol. Chem. 2003;278:4786–4791. doi: 10.1074/jbc.M207397200. [DOI] [PubMed] [Google Scholar]
- Shen H, Smith DE, Yang T, Huang YG, Schnermann JB, Brosius FC., 3rd Localization of PEPT1 and PEPT2 proton-coupled oligopeptide transporter mRNA and protein in rat kidney. Am. J. Physiol. 1999;276:F658–F665. doi: 10.1152/ajprenal.1999.276.5.F658. [DOI] [PubMed] [Google Scholar]
- Shu C, Shen H, Teuscher NS, Lorenzi PJ, Keep RF, Smith DE. Role of PEPT2 in peptide/mimetic trafficking at the blood-cerebrospinal fluid barrier: studies in rat choroid plexus epithelial cells in primary culture. J. Pharmacol. Exp. Ther. 2002;301:820–829. doi: 10.1124/jpet.301.3.820. [DOI] [PubMed] [Google Scholar]
- Smith DE, Clémençon B, Hediger MA. Proton-coupled oligopeptide transporter family SLC15: Physiological, pharmacological and pathological implications. Mol. Aspects Med. 2013;34:323–336. doi: 10.1016/j.mam.2012.11.003. [DOI] [PMC free article] [PubMed] [Google Scholar]
- Smith DE, Hu Y, Shen H, Nagaraja TN, Fenstermacher JD, Keep RF. Distribution of glycylsarcosine and cefadroxil among cerebrospinal fluid, choroid plexus, and brain parenchyma after intracerebroventricular injection is markedly different between wild-type and Pept2 null mice. J. Cereb. Blood Flow Metab. 2011;31:250–261. doi: 10.1038/jcbfm.2010.84. [DOI] [PMC free article] [PubMed] [Google Scholar]
- Smith DE, Johanson CE, Keep RF. Peptide and peptide analog transport systems at the blood-CSF barrier. Adv. Drug Deliv. Rev. 2004;56:1765–1791. doi: 10.1016/j.addr.2004.07.008. [DOI] [PubMed] [Google Scholar]
- Subramanian N, Whitmore WL, Seidler FJ, Slotkin TA. Ontogeny of histaminergic neurotransmission in the rat brain: Concomitant development of neuronal histamine, H-1 receptors, and H-1 receptor-mediated stimulation of phospholipid turnover. J. Neurochem. 1981;36:1137–1141. doi: 10.1111/j.1471-4159.1981.tb01710.x. [DOI] [PubMed] [Google Scholar]
- Sun D, Wang Y, Tan F, Fang D, Hu Y, Smith DE, Jiang H. Functional and molecular expression of the proton-coupled oligopeptide transporters in spleen and macrophages from mouse and human. Mol. Pharm. 2013;10:1409–1416. doi: 10.1021/mp300700p. [DOI] [PMC free article] [PubMed] [Google Scholar]
- Teuscher NS, Keep RF, Smith DE. PEPT2-mediated uptake of neuropeptides in rat choroid plexus. Pharm. Res. 2001;18:807–813. doi: 10.1023/a:1011088413043. [DOI] [PubMed] [Google Scholar]
- Teuscher NS, Novotny A, Keep RF, Smith DE. Functional evidence for presence of PEPT2 in rat choroid plexus: Studies with glycylsarcosine. J. Pharmacol. Exp. Ther. 2000;294:494–499. [PubMed] [Google Scholar]
- Toledo A, Sabria J, Rodriguez R, Brandner R, Rodriguez J, Palacios JM, Blanco I. Properties and ontogenic development of membrane-bound histidine decarboxylase from rat brain. J. Neurochem. 1988;51:1400–1406. doi: 10.1111/j.1471-4159.1988.tb01104.x. [DOI] [PubMed] [Google Scholar]
- Tran VT, Freeman AD, Chang RS, Snyder SH. Ontogenetic development of histamine h1-receptor binding in rat brain. J. Neurochem. 1980;34:1609–1613. doi: 10.1111/j.1471-4159.1980.tb11251.x. [DOI] [PubMed] [Google Scholar]
- Walker D, Thwaites DT, Simmons NL, Gilbert HJ, Hirst BH. Substrate upregulation of the human small intestinal peptide transporter, hPepT1. J. Physiol. 1998;507:697–706. doi: 10.1111/j.1469-7793.1998.697bs.x. [DOI] [PMC free article] [PubMed] [Google Scholar]
- Wang M, Zhang X, Zhao H, Wang Q, Pan Y. Comparative analysis of vertebrate PEPT1 and PEPT2 genes. Genetica. 2010;138:587–599. doi: 10.1007/s10709-009-9431-6. [DOI] [PubMed] [Google Scholar]
- Yamashita T, Shimada S, Guo W, Sato K, Kohmura E, Hayakawa T, Takagi T, Tohyama M. Cloning and functional expression of a brain peptide/histidine transporter. J. Biol. Chem. 1997;272:10205–10211. doi: 10.1074/jbc.272.15.10205. [DOI] [PubMed] [Google Scholar]


