Abstract
The oligosaccharidoses are a group of metabolic disorders resulting from a deficiency in enzymes responsible for the catabolism of protein bound oligosaccharides and are typified by the accumulation of corresponding sugars in the urine. Screening is typically accomplished using thin layer chromatography. However, analyte specificity can be a problem and thus complicate interpretation of results. For this reason we developed a mixed mode liquid chromatography tandem mass spectrometry assay for the screening of the oligosaccharidoses which potentially mitigates many of the problems associated with thin layer chromatography. Samples from patients previously diagnosed with I-Cell disease, mannosidosis, Pompe, galactosialidosis, and fucosidosis were derivatized with 3-Methyl-1-Phenyl-2-pyrazolin-5-one and subjected to analysis by liquid chromatography tandem mass spectrometry. Results were compared to normal control samples. Preliminary results suggest that each oligosaccharidoses produces a unique selected reaction monitoring fingerprint and that the developed method may be an effective screening and diagnostic tool for these disorders.
1. Introduction
The primary function of the lysosome is to break down cellular macromolecules, lipids, nucleic acids, sugars, etc., for reuse or elimination. These catabolic processes are typically enzyme mediated. The lysosomal storage disorders (LSDs) are a group of predominantly autosomal recessive genetic disorders, resulting from mutations in genes coding for lysosomal enzymes. Catabolic intermediates accumulate in the cell due to the loss of enzymatic function, and ultimately result in cellular dysfunction [1–3].
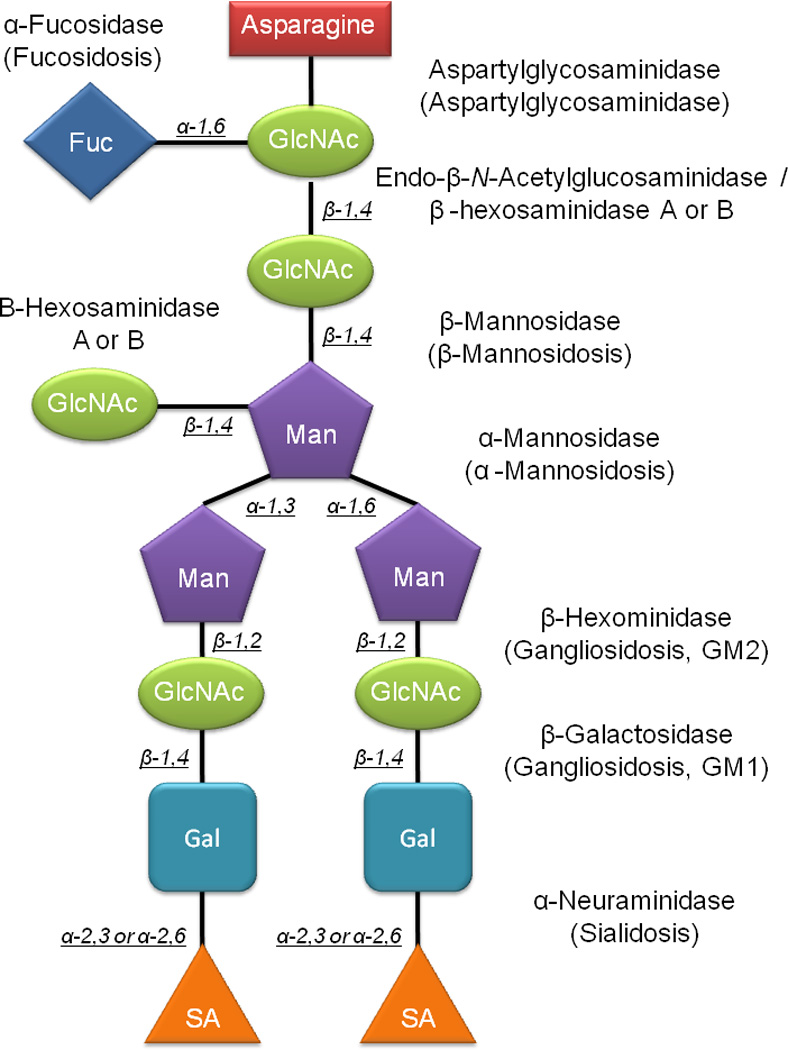
The oligosaccharidoses are a subset of the LSDs, characterized by an enzyme deficiency in the catabolic pathway responsible for the breakdown of the oligosaccharide component of glycosylated proteins. The glycosidic groups on glycoproteins are either N-linked (asaparagine) or O-linked (serine or threonine), and are composed of fucose, mannose, sialic acids, galactose, and N-acetylglucosamine residues [4]. Glycosylated proteins are shuttled to the lysosome, and the glycosidic residues are targeted for catabolism. N-linked oligosaccharides are initially cleaved from the protein, and then sequentially degraded from the reducing end of the oligosaccharide. Conversely, the O-linked oligosaccharides are sequentially cleaved from the reducing end of the sugar, prior to being cleaved from the protein [4]. An enzymatic deficiency in any of these steps results in the accumulation of oligosaccharides in the lysosome and elevated urinary concentrations. Specific examples of the oligosaccharidoses include Pompe, galactosialidosis, I-Cell, fucosidosis, and mannosidosis. Shown in Figure 1 is a theoretical lysosomal complex oligosaccharide, the associated catabolic enzymes, and the disorder resulting from a deficiency in an enzyme.
Figure 1.

Lysosomal degradation mechanism for a theoretical complex oligosaccharide. Enzymes are indicated at each of the steps and the resulting disorders are in parenthesis.
Clinical diagnosis of the oligosaccharidoses is difficult due to the variability of clinical features [2, 5]. Examples include bone abnormalities, coarse facial features, corneal cloudiness, organomegaly, muscle weakness, hypotonia, developmental delay, and ataxia [2, 3, 6]. Treatment for the LSDs and specifically the oligosaccharidoses, is currently limited to bone marrow transportation, enzyme replacement therapy, and to a lesser extent small molecule pharmaceuticals. Stem cell transplantation has been used with varying degrees of success [2, 7–9]. However, complications such as graft versus host disease are frequent, and thus compromise its efficacy as a treatment modality [3]. More recently, enzyme therapy and small molecules have become available for the treatment of various LSDs. Furthermore, with the adoption of the Orphan Drug Act which subsidizes pharmaceutical research and development for rare diseases, treatment options for LSDs will likely increase.
The rapid development of treatment options for oligosaccharidoses has called attention to the need for accurate analytical methods to screen for LSDs, especially in light of the fact that new treatments and early intervention can mitigate many of the adverse effects of the disorders provided that detection occurs prior to irreversible pathology. A multitude of analytical tests have been developed to screen for the oligosaccharidoses, including enzyme assays [10–13], thin layer chromatography (TLC) [14], high performance liquid chromatography [15, 16], and more recently, mass spectrometry [4, 6, 17–23].
While mass spectrometry based analytical techniques have proven invaluable in the general area of clinical chemistry, carbohydrate analysis by mass spectrometry is difficult due to the chemical nature of the compounds. Carbohydrates and oligosaccharides are problematic analytes for mass spectrometry due to their poor ionization efficiencies. This parameter may be improved somewhat by looking at formate and ammonium adducts, but derivatization is often necessary. Additionally, they are typically quite polar, and thus not amenable to reverse phase HPLC. Finally, when focusing on the oligosaccharidoses, analyte complexity is tremendous. A group of oligosaccharides present in an affected individual may only share the commonality of being improperly degraded, with no other shared chemical functionality or structure. Thus, there is typically no single unique biomarker for these disorders. Consequently, the development of analytical screening methods for the oligosaccharidoses is challenging.
In the present work we have developed a mixed mode HPLC-MS/MS method that potentially circumvents the previously mentioned analytical difficulties associated with screening for the oligosaccharidoses. Specifically, oligosaccharides are derivatized with 3-methyl-1-phenyl-2-pyrazolin-5-one. A targeted metabolomic approach, which capitalizes on the fact that all oligosaccharides share a common fragment ion, was adopted. This approach allowed for the development of a series of unique selected reaction monitoring transitions to be identified and implemented in a fingerprinting type approach for the identification galactosialidosis, Pompe, mannosidosis, fucosidosis, and I Cell disease.
2. Materials and Methods
2.1 Materials
Maltose, arabinose, ribose, maltotetraose, maltoheptaose, 3-methyl-1-phenyl-2-pyrazolin-5-one (PMP), sodium hydroxide, and formic acid were purchased from Sigma (St. Louis, MO). Acetonitrile was purchased from Fisher Scientific (Pittsburg, PA).
2.2 Samples
Urine samples were obtained from anonymized clinical samples. All test subjects had been previously diagnosed. Diagnosis was accomplished through TLC screening followed by enzymatic tests. The ages of the subjects were as follows; 8–17 yrs for I-Cell, 9–60 yrs for Mannosidosis, 13 yrs for fucosidosis, 1 yr for Pompe, and 6 yrs for galactosialidosis. Clinical features were typical for each disorder. Control subjects were anonymized samples from healthy individuals.
2.3 Sample Preparation
Clinical urine samples were derivatized with PMP using a modified version of the method originally described by Honda and coworkers [24]. Briefly, 450 µL of urine, 100 µL of 1 M NaOH, and 450 µL of 0.5 M methanolic PMP were allowed to mix at 65 °C for 1 h. Following derivatization, the 50 µL of the sample was mixed with 150 µL of 0.1% formic acid in Milli Q water.
2.4 Reverse Phase Chromatography
All chromatography experiments were performed on a Waters 2795 separation module using a Phenomenex Luna PFP column (100 × 2 mm, 3 µm). A 5 µL injection volume was used. Mobile phase A (MPA) consisted of 0.1% formic acid in Milli-Q water. Mobile phase B (MPB) consisted of 0.1% formic acid in acetonitrile. MPA was used as the needle wash solution. Mobile phases were sparged with Helium prior to use. Column flow rate was 300 µL/min for all analysis. Analyte separation was achieved using a linear gradient profile, where MPB changed from 20% to 25% over the course of 10 min. A one minute column flush at 90% MPB was then applied, followed by re-equilibration at 20% MPB for 4 min.
2.5 Mass Spectrometry
All experiments were performed on a Waters Micromass Quattro Micro triple quadrupole mass spectrometer operated in positive ion mode. All work was performed using electrospray ionization. Nitrogen and argon were used as the source gas and collision gas, respectively. The capillary voltage was 3.5 kV. The cone voltage was 33 V. The source temperature was set to 150 °C and the desolvation temperature was set to 400 °C. The instrument was operated in selected reaction monitoring mode (SRM) with a 100 ms dwell time. The collision energy was 40 eV.
2.6 Data Analysis
Data analysis was conducted using Masslynx/Quanlynx, version 4.1. A Savitzky-Golay smoothing filter was used for SRM peak processing.
3.0 Results
3.1 Mass Spectrometry
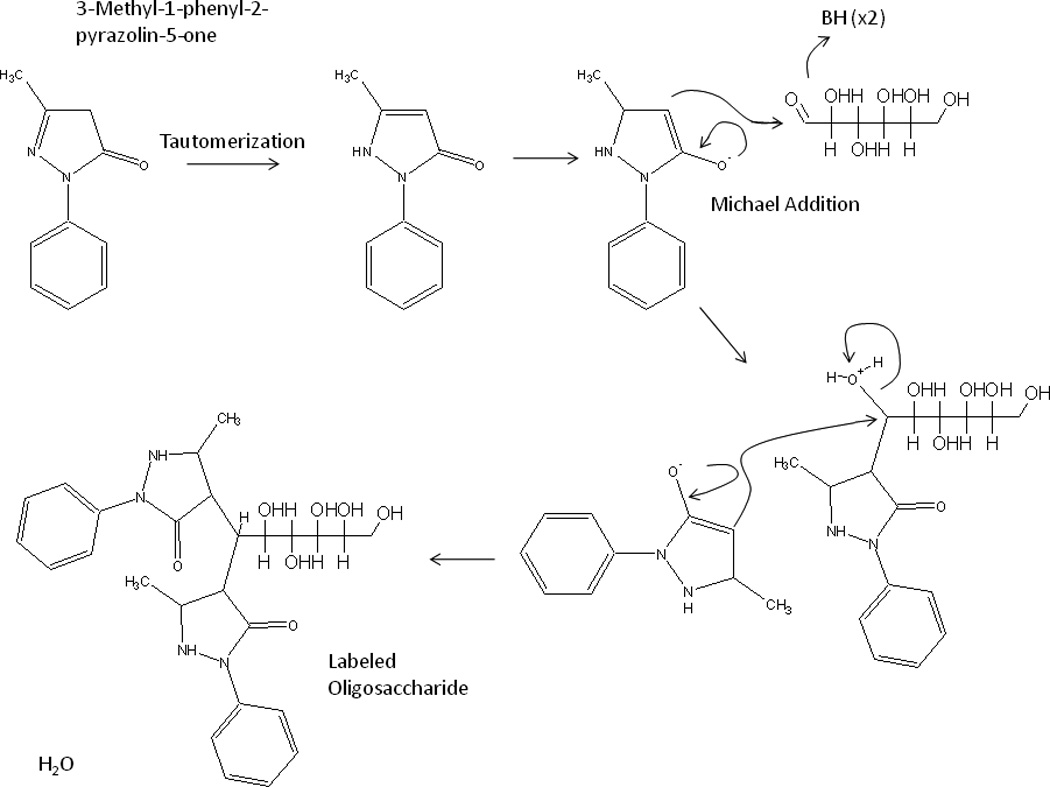
Given the poor chromatographic resolution and specificity associated with thin layer chromatography, we sought to develop a liquid chromatography tandem mass spectrometry assay for screening of the oligosaccharidoses. To this end we expanded on the work done by Ramsay and coworkers, utilizing PMP as a derivatizing agent [4]. Following tautomerization, the reaction proceeds via base-catalyzed sequential Michael additions, as shown in Figure 2. The target analytes for the assay are poorly defined, thus, authentic standards are not available. Consequently, we chose to use structural analogs in order to optimize the MS parameters. Aqueous solutions (1 mM) of arabinose, maltose, ribose, maltotetraose, and maltoheptaose were derivatized with PMP and infused into the mass spectrometer via a post column T junction. MS parameters were optimized for each of the compounds and fragmentation patterns were identified (Figure 3). It was observed that, independent of the oligosaccharide derivatized, the 5-methyl-3-oxo-2-phenyl-2,3-dihydro-1H-pyrazol-4-ylium ion (m/z 175) was always present in product ion scans (Figure 3). This behavior is advantageous in that it will allow for an extrapolated Selected Reaction Monitoring (SRM) or targeted metabolomics approach to be utilized for the development of the assay. While the analytical targets are complex and poorly defined, the m/z values for various oligosaccharides can be calculated. Thus SRM transitions can be generated since they will presumably all give the common m/z 175 fragment. A second advantage of utilizing PMP as a derivatizing reagent is that it functions as an ionophore, greatly increasing the ionization efficiency of the poorly ionizable oligosaccharides.
Figure 2.

Proposed mechanism for derivatization of oligosaccharides with PMP. Following tautomerization, PMP functions as a Michael donor, attacking the carbonyl moiety of the sugar residue. A second PMP attacks the sugar residue to form the final product.
Figure 3.

Product ion scan of derivatized maltose. The primary fragment generated was the 5-methyl-3-oxo-2-phenyl-2,3-dihydro-1H-pyrazol-4-ylium ion. A second fragment was observed from the cleavage of the glycosidic linkage on the terminal side of the oxygen.
3.2 Method Development
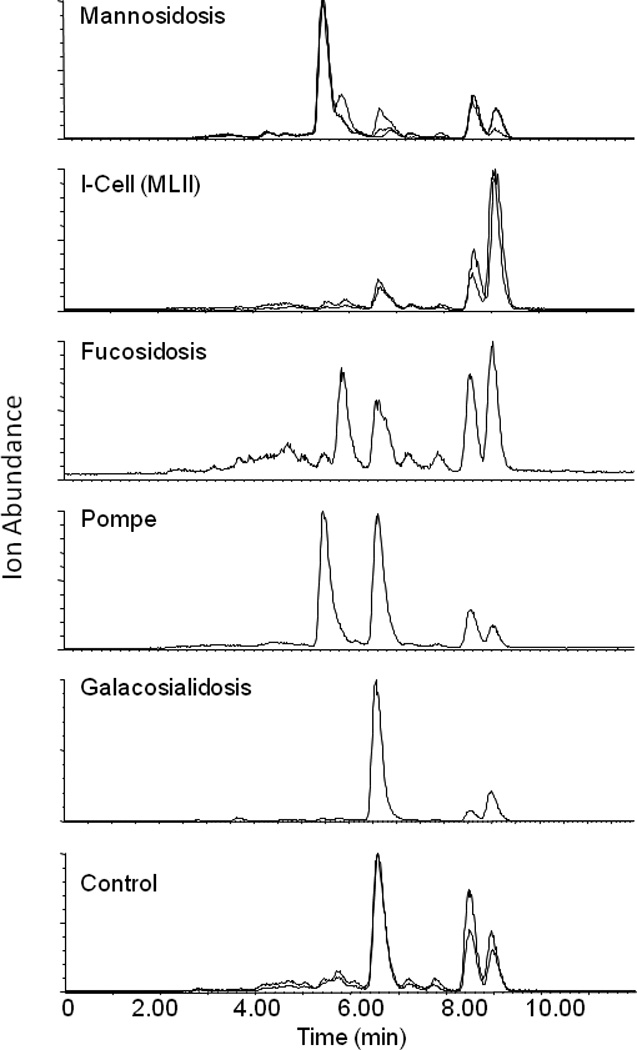
Once the MS behavior of the derivatized oligosaccharides was characterized, we proceeded to analyze clinical urine samples. All of the samples screened had been previously diagnosed as either normal (control samples, n = 6), or positive for various oligosaccharidoses (galactosialidosis n = 1, mannosidosis n = 5, I-Cell disease n = 4, fucosidosis n = 1, or Pompe n = 1). Samples were derivatized and theoretical SRM transitions were generated using the assumption that the molecular ion would generate the m/z 175 fragment. For example, theoretical transitions for the hexose series Hex2, Hex3, Hex4, Hex5, Hex6, and Hex7 would be m/z 673 → 175, 835 → 175, 997 → 175, 1159 → 175, 1321 → 175, and 1483 → 175. The process was repeated in an iterative fashion, taking into account possible acetylation, deoxyhexoses, and pentoses. All samples were screened and transitions which appeared to be of diagnostic utility were retained, whereas nonspecific transitions were not used. This was accomplished by visual inspection of the SRM chromatograms as unique transitions for the oligosaccharidoses were typically not present in controls. Results are shown in Figure 4. When utilizing this approach, many analytical difficulties are eliminated. Examples include the stereochemistry of the sugar units, the type of glycosidic linkage, and positions of acetylation.
Figure 4.

Selected Reaction Monitoring fingerprint analysis of clinical urine samples. The mass chromatograms shown are total ion chromatograms.
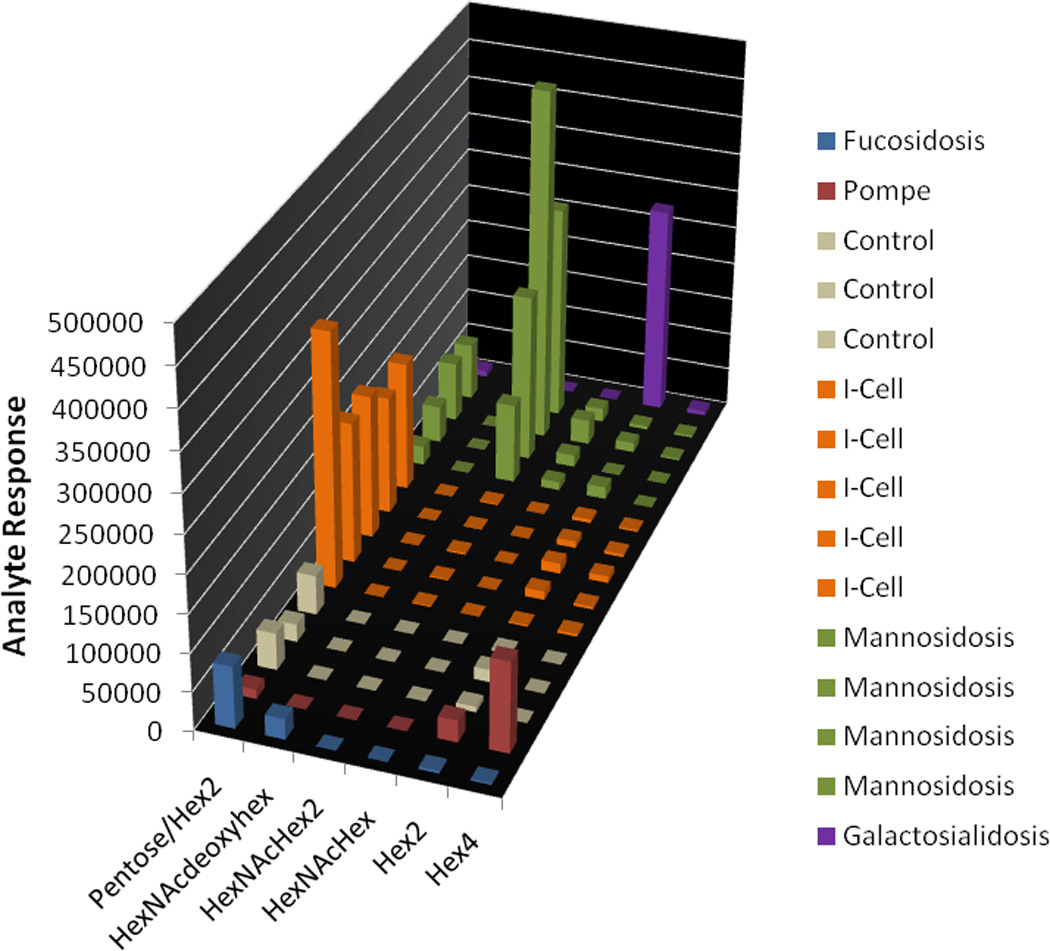
In order to achieve the results shown in Figure 4, development of highly selective chromatography was necessary. Initially, hydrophilic interaction chromatography (HILIC) was tested. While hilic showed excellent retention of the polar analytes, selectivity was poor (data not shown). We then switched to a mixed mode separation, using a pentaflourophenylpropyl column. While reverse phase solvents are used, the column chemistry allows for separations based on hydrogen bonding, dipole-dipole interactions, hydrophobic partitioning, and π-π interactions. The additional selectivity parameters allowed for reasonable separation of the putatively assigned oligosaccharides. Each of the oligosaccharidoses screened for appears to generate a unique total ion chromatogram fingerprint, based on the sum of final SRM transitions used (Figure 4). The approach taken is similar to TLC in that the goal is to develop conditions that result in a unique pattern for each of the disorders, with little emphasis on absolute quantification. Figure 5 depicts a normalized numerical representation of the data shown in Figure 4. SRM peaks were integrated using a savitzky golay smoothing algorithm. The data are presented in graphical format by elucidating and plotting the proposed oligosaccharides that exhibit diagnostic utility for each of the oligosaccharidoses screened as a function of the normalized peak areas. Our data agree with the literature results in that we observe the following elevations or perturbations relative to control samples; hexose tetrasaccharide in Pompe, acetylated tri-hexose in mannosidosis, N acetyl hexose – deoxyhexose in fucosidosis, altered pentose/di-hexose ratios in I cell disease, and di-hexose in galactosialidosis [4, 6, 25].
Figure 5.

Graphical representation of SRM data. Normalized ion intensity is shown on the y axis. The z axis delineates individual samples and groups them by disorder. The x axis identifies the putative oligosaccharides. Hex = Hexose, NAc = N-Acetyl, deoxyHex = deoxyhexose.
3.3. Method Performance
Given the qualitative nature of the assay in conjunction with the lack of analytical standards and limited number of samples, a rigorous method validation was not possible. Nonetheless, we evaluated method performance by preparing technical (n = 6) and biological replicates (n = 3). Technical replicates are multiple injections of the same sample using a single preparation. Biological replicates are multiple injections of the same sample, prepared multiple times. They are used to separately assess system variability and sample preparation variability. The Inter and intraday relative standard deviations were determined for peak response and retention time for relevant SRM transitions. Data are shown in supplementary Table 1. The data show that peak responses and retention times were reproducible, with inter and intraday relative standard deviations being less than 20%. Additionally, carryover was evaluated and determined to be less than 0.05%, when measured as function of the peak area of the previous injection. Appreciable shifts in retention time and peak shape were not observed over the course of 50 injections. Taken together these data suggest that the assay is satisfactorily reproducible.
Experiments were conducted to determine the impact of matrix effects on the assay. 1 mg/mL solutions of maltotetraose and maltoheptaose were derivatized with PMP as described in the experimental section. Aliquots of these solutions were then spiked into urine and MilliQ water and analyzed. The percent differences for the analytes in the different matrices was 93% for maltotetraose and 95% for maltoheptaose. These results suggest that matrix effects are not affecting the assay to any appreciable degree.
4.1 Conclusions
We have developed a mixed mode LC tandem mass spectrometry assay for the screening of oligosaccharidoses. The method was demonstrated to be adequately reproducible with respect to retention time, peak response, and analytical precision. The use of PMP as a derivatizing agent offers multiple advantages. PMP improves the oligosaccharides’ inherently poor ionization efficiency and chromatographic retention. Furthermore, the MS fragmentation behavior allows for the use of a systematic targeted metabolomic approach to be implemented, thus eliminating many of the upfront difficulties associated with the development of screening tests for oligosaccharidoses, namely the enormous amount of biologic variability. The method is qualitative, in that the objective is to develop conditions that allow for the differentiation of various oligosaccharidoses. It appears that each of the oligosaccharidoses tested generates a unique SRM fingerprint, as seen in Figure 4. The authors are aware that the number of samples run to this point is somewhat limited, and, consequently, statistical power is compromised. However, the rarity of some of these disorders simply makes obtaining large number of samples a difficult and lengthy endeavor. Future work includes adding more lysosomal storage disease subtypes, in addition to running more samples of the oligosaccharidoses described here as they become clinically available. This would enable the establishment and adoption of cut off criteria and may allow for a semi-quantitative approach to be used, analogous to acylcarnitine analysis. Finally, the authors propose that the work presented may potentially be adapted or modified such that this technique could be used to monitor the efficacy of treatments such as enzyme replacement or chaperone therapies.
Supplementary Material
Shown in the table are the coefficients of variation for both retention time (tr) and instrument response. Panel A shows the results from technical replicates. Panel B shows the results from biological replicates. Each biological replicate was analyzed in triplicate. Panel C shows interday performance statistics.
References
- 1.Marsden D, Levy H. Clin Chem. 2010;56:1071–1079. doi: 10.1373/clinchem.2009.141622. [DOI] [PubMed] [Google Scholar]
- 2.Wenger DA, Coppola S, Liu SL. Arch Neurol. 2003;60:322–328. doi: 10.1001/archneur.60.3.322. [DOI] [PubMed] [Google Scholar]
- 3.Wilcox WR. J Pediatr. 2004;144:S3–S14. doi: 10.1016/j.jpeds.2004.01.049. [DOI] [PubMed] [Google Scholar]
- 4.Ramsay SL, Meikle PJ, Hopwood JJ, Clements PR. Anal Biochem. 2005;345:30–46. doi: 10.1016/j.ab.2005.06.042. [DOI] [PubMed] [Google Scholar]
- 5.Beck M. J Inherit Metab Dis. 2001;24(Suppl 2):47–51. doi: 10.1023/a:1012463605992. discussion 45–6. [DOI] [PubMed] [Google Scholar]
- 6.Rozaklis T, Ramsay SL, Whitfield PD, Ranieri E, Hopwood JJ, Meikle PJ. Clin Chem. 2002;48:131–139. [PubMed] [Google Scholar]
- 7.Malatack JJ, Consolini DM, Bayever E. Pediatr Neurol. 2003;29:391–403. doi: 10.1016/j.pediatrneurol.2003.09.003. [DOI] [PubMed] [Google Scholar]
- 8.Kennedy DW, Abkowitz JL. Blood. 1997;90:986–993. [PubMed] [Google Scholar]
- 9.Krivit W, Aubourg P, Shapiro E, Peters C. Curr Opin Hematol. 1999;6:377–382. doi: 10.1097/00062752-199911000-00004. [DOI] [PubMed] [Google Scholar]
- 10.Chamoles NA, Blanco M, Gaggioli D. Clin Chim Acta. 2001;308:195–196. doi: 10.1016/s0009-8981(01)00478-8. [DOI] [PubMed] [Google Scholar]
- 11.Chamoles NA, Blanco M, Gaggioli D, Casentini C. Clin Chim Acta. 2002;318:133–137. doi: 10.1016/s0009-8981(02)00002-5. [DOI] [PubMed] [Google Scholar]
- 12.Chamoles NA, Blanco M, Gaggioli D, Casentini C. Clin Chim Acta. 2002;317:191–197. doi: 10.1016/s0009-8981(01)00798-7. [DOI] [PubMed] [Google Scholar]
- 13.Chamoles NA, Niizawa G, Blanco M, Gaggioli D, Casentini C. Clin Chim Acta. 2004;347:97–102. doi: 10.1016/j.cccn.2004.04.009. [DOI] [PubMed] [Google Scholar]
- 14.Kuriyama M, Hiwatari R, Igata A. Tohoku J Exp Med. 1990;161:335–341. doi: 10.1620/tjem.161.335. [DOI] [PubMed] [Google Scholar]
- 15.Peelen GO, de Jong JG, Wevers RA. Clin Chem. 1994;40:914–921. [PubMed] [Google Scholar]
- 16.An Y, Young SP, Hillman SL, Van Hove JL, Chen YT, Millington DS. Anal Biochem. 2000;287:136–143. doi: 10.1006/abio.2000.4838. [DOI] [PubMed] [Google Scholar]
- 17.Dajnoki A, Muhl A, Fekete G, Keutzer J, Orsini J, Dejesus V, et al. Clin Chem. 2008;54:1624–1629. doi: 10.1373/clinchem.2008.107722. [DOI] [PubMed] [Google Scholar]
- 18.Dajnoki A, Fekete G, Keutzer J, Orsini JJ, De Jesus VR, Chien YH, et al. Clin Chim Acta. 2010;411:1428–1431. doi: 10.1016/j.cca.2010.03.009. [DOI] [PubMed] [Google Scholar]
- 19.Ramsay SL, Maire I, Bindloss C, Fuller M, Whitfield PD, Piraud M, et al. Mol Genet Metab. 2004;83:231–238. doi: 10.1016/j.ymgme.2004.07.015. [DOI] [PubMed] [Google Scholar]
- 20.Whitfield PD, Sharp PC, Taylor R, Meikle P. J Lipid Res. 2001;42:2092–2095. [PubMed] [Google Scholar]
- 21.Whitfield PD, Sharp PC, Johnson DW, Nelson P, Meikle PJ. Mol Genet Metab. 2001;73:30–37. doi: 10.1006/mgme.2001.3165. [DOI] [PubMed] [Google Scholar]
- 22.Whitfield PD, Nelson P, Sharp PC, Bindloss CA, Dean C, Ravenscroft EM, et al. Mol Genet Metab. 2002;75:46–55. doi: 10.1006/mgme.2001.3269. [DOI] [PubMed] [Google Scholar]
- 23.Ramsay SL, Meikle PJ, Hopwood JJ. Mol Genet Metab. 2003;78:193–204. doi: 10.1016/s1096-7192(03)00018-0. [DOI] [PubMed] [Google Scholar]
- 24.Honda S, Akao E, Suzuki S, Okuda M, Kakehi K, Nakamura J. Anal Biochem. 1989;180:351–357. doi: 10.1016/0003-2697(89)90444-2. [DOI] [PubMed] [Google Scholar]
- 25.Young SP, Stevens RD, An Y, Chen YT, Millington DS. Anal Biochem. 2003;316:175–180. doi: 10.1016/s0003-2697(03)00056-3. [DOI] [PubMed] [Google Scholar]
Associated Data
This section collects any data citations, data availability statements, or supplementary materials included in this article.
Supplementary Materials
Shown in the table are the coefficients of variation for both retention time (tr) and instrument response. Panel A shows the results from technical replicates. Panel B shows the results from biological replicates. Each biological replicate was analyzed in triplicate. Panel C shows interday performance statistics.


