Abstract
Background
We have shown previously that 17β-estradiol (E2) increases left ventricular (LV) and cardiomyocyte hypertrophy following myocardial infarction (MI). However, E2 decreases hypertrophy in pressure overload models. We hypothesized that the effect of estrogen on cardiac hypertrophy was dependent on the type of hypertrophic stimulus.
Methods
Ovariectomized wild type female mice (n=192) were given vehicle or E2 treatment followed by coronary ligation (MI), transverse aortic constriction (TAC), or sham operation. Signaling pathway activation was studied at 3, 24, and 48 hours while echocardiography and hemodynamic studies were performed at 14 days.
Results
MI induced early but transient activation of p38 and p42/44 MAPK pathways, whereas TAC induced sustained activation of both pathways. E2 had no effect on these pathways, but increased Stat3 activation following MI while decreasing Stat3 activation following TAC. MI caused LV dilation, and decreased fractional shortening (FS), that were unaltered by E2. TAC caused LV dilation, reduced FS, and increased LV mass, but in this model, E2 improved these parameters. Following MI, E2 led to increases in myocyte cross-sectional area, atrial natriuretic peptide (ANP) and β-myosin heavy chain (MHC) gene expression, but E2 diminished TAC-induced increases ANP and β-MHC gene expression.
Conclusions
These data demonstrate that the effects of E2 on LV and myocyte remodeling depend on the nature of the hypertrophic stimulus. The opposing influence of E2 on hypertrophy in these models may, in part, result from differential effects of E2 on Stat3 activation. Further work will be necessary to explore this and other potential mechanisms by which estrogen affects hypertrophy in these models.
Keywords: Estrogen, LV Remodeling, Myocyte Hypertrophy, Myocardial Infarction, Pressure Overload, Signal Transducer and Activator of Transcription
Heart failure is an increasing public health problem,[1] with the vast majority of cases in the United States resulting from ischemic heart disease and/or hypertension. Myocardial infarction (MI) and chronic hypertension often lead to progressive left ventricular (LV) remodeling that contributes to the development of heart failure. LV remodeling is largely reflective of cardiomyocyte hypertrophy that, in turn, results from activation of signaling pathways and a reprogramming of gene expression.[2,3]
Clinical and experimental studies have established that gender influences LV remodeling,[4,5] though, the role of sex hormones in LV remodeling is not well understood. We previously observed in a mouse MI model that treatment with 17β-estradiol (E2), the main circulating form of estrogen, in ovariectomized females led to an increase in LV and myocyte hypertrophy.[6] These findings contrast with results in pressure overload models in which E2 has been shown to reduce LV hypertrophy.[6–8] Taken together, these studies suggest that E2 may differentially influence LV remodeling in a manner dependent on the type of hypertrophic stimulus. In the present study, we directly compared the effects of E2 treatment on LV remodeling following MI or pressure overload induced by transverse aortic constriction (TAC). We now show that E2 promotes hypertrophy following MI, but inhibits hypertrophy after TAC.
Methods
Materials
All chemical agents were obtained from Sigma unless otherwise specified. Antibodies used included the following: Anti-phosho-thr242/tyr248Extracellar signal regulated kinases (ERK1/2), ERK1/2, anti-phospho-thr180/tyr182-p38 mitogen activated protein kinase (MAPK), p38-MAPK, anti-phospho-tyr705-Stat3 and Stat3 antibodies were all purchased from Cell Signaling. Horseradish Peroxidase-tagged secondary antibodies and enhanced Chemilluminescence reagents for western blotting were obtained from Amersham. All polymerase chain reaction reagents were obtained from Invitrogen unless otherwise specified.
Overall Study Plan
On day −14, all mice underwent ovariectomy followed seven days later (day −7) by the placement of subcutaneous pellets containing placebo or E2. In prior studies from this lab,[9,10] we showed that E2 delivered subcutaneously reaches a steady state level by 4 days following the start of therapy. This experimental scheme therefore assures that steady state levels of E2 are reached at the time that the hypertrophic stimulus is applied. On day 0, mice underwent one of three procedures: Sham surgery, coronary ligation to induce MI, or transverse aortic constriction (TAC) resulting in 6 groups: placebo-Sham, E2-Sham, placebo-MI, E2-MI, placebo-TAC, and E2-TAC. A total of 192 female C57/BL6 mice 8–10 weeks of age were used. Twenty two animals were included in each of the placebo-Sham and the E2-Sham groups; 45 E2- and 36 placebo-treated mice underwent coronary ligation; 35 E2- and 32 placebo-treated mice were assigned to TAC. Both short-term and long-term studies were performed. In the short-term study, 4 animals in each of the six groups were harvested at 3, 24, and 48 hours following MI or TAC for a total of 72 mice. In the long-term study, the remaining animals in each group (10 in each of the placebo- and E2-Shams, 33 E2-MI, 24 placebo-MI, 23 E2-TAC, 20 placebo-TAC groups; total =120 mice) underwent echocardiography on day 13 and hemodynamic evaluation and sacrifice on day 14.
Animals
8–10 week old female C57/BL6 mice were housed at no more than five per cage in an AAALAC approved animal facility, with 12 hour light-dark cycles and given free access to standard rodent chow (PROLAB, Syracuse, NY) and water. This protocol was approved by the Institutional Animal Care and Use Committee at the Tufts-New England Medical Center.
Surgical Procedures
All procedures were performed under general anesthesia using 2.0–2.5% isoflurane. Ovariectomy, subcutaneous pellet placement, MIs, and TAC were performed as described previously.[6,10–12] Estrogen or placebo was administered via 60-day release pellets placed subcutaneously (0.25mg/60 day release pellet; Innovative Research of America, Sarasota FL). For the Sham, MI, or TAC operations mice were anesthetized, intubated, and ventilated with a small animal respirator (Harvard Rodent Ventilator, Model 683, Natick, MA). A left thoracotomy was performed. For the MI group, a ligature was tied around the left coronary artery approximately 1mm below the left atrial appendage as described (12). TAC was induced by tying a 7-0 polypropylene suture around the transverse aorta, against a 27-gauge needle.
Echocardiography
Transthoracic echocardiography was performed under light sedation with 1.5% isoflurane administered via nose cone while the core body temperature was maintained at 37.0±0.2 °C as described.[6,11–13] Analysis of the echocardiographic images was performed by a blinded investigator. LV end diastolic diameter (EDD) and LV end systolic diameter (ESD) were indexed to femoral length (FL) that was measured post mortem to the nearest 0.01mm with a micro-caliper (Fisher Scientific).
Hemodynamic Evaluation
In the long-term study, terminal hemodynamic evaluation was performed as described [6,13] using 2.0% isoflurane anesthesia administered via nose cone. Pressures were acquired sequentially from the left internal carotid, right internal carotid, ascending aorta, and the left ventricle.
Tissue Harvest
At sacrifice, the heart was arrested in diastole by the intravenous injection of 0.3ml of 1M KCl, the heart was then rapidly removed, the RV free wall carefully separated from the LV. All tissues were weighed. LV weights were indexed to FL measured to the nearest 0.01mm with a micro-caliper. In the short-term study, the LV (excluding infarct and peri-infarct tissue in the case of MI hearts) was snap frozen in liquid nitrogen (N2) for biochemical analyses. In the long-term study, a small portion (10–20mg) of the LV base was removed and snap-frozen in liquid nitrogen (N2) and stored at −70°C for future RNA extraction. The remaining portion of the LV was fixed in 10% formalin overnight and embedded in paraffin for histologic analyses described below.
Serum Estradiol Levels
Estradiol levels were determined using a standard radio-immunoassay as described.[6,9,10,14]
Infarct Size and Myocyte Cross Sectional Area
Infarct size and myocyte cross sectional area (CSA) were measured by a blinded observer (AA) as described.[6] For CSA and gene expression measurements, a total of 5 samples each for the Placebo and E2 sham groups and 10 samples each for the Placebo-MI, E2-MI, Placebo-TAC, and E2-TAC groups were analyzed. The E2 and placebo-MI groups were matched for infarct size and the TAC groups matched for TAC-induced pressure gradients. Groups were matched in this fashion to assure an approximately equivalent stimulus to hypertrophy between the groups.
Western Blotting
Myocardial segments (excluding infarct or peri-infarct tissue in the MI group) were pulverized under liquid nitrogen using a mortar and pestle and placed in lysis buffer containing: 50mM NaCl, 50mM NaF, 20mM TrisHCl, 10mM EDTA, 20mM Na4P2O8, 1mM Na3VO4, 1% Triton, 1mM PMSF, 10mM β-glycerophosphate, and 10μM microcystin plus protease inhibitors; western blotting was performed on the cleared lysates as described.[15]
Semi-quantitative Reverse Transcription Polymerase Chain Reaction (rtPCR)
From each frozen LV segment, total cellular RNA was isolated using the Trizol reagent (Invitrogen) as described.[13] rtPCR was performed using a multiplex approach by adding primers for glyceraldehyde-3-phosphate dehydrogenase (GAPDH) as a comparative internal standard to each reaction. Primers and PCR conditions to measure the expression of atrial natriuretic peptide (ANP) were performed exactly as described.[13] β-myosin heavy chain (MHC) expression was quantified using the following primers (5′-3′): sense: CTGGAGAAGATCCGAAAGCA; and antisense: GTGTCCTTCAGCAAACTCTGG resulting in a 383 base pair product. β-MHC PCR was performed using the following cycling conditions: 94°C × 30″, 57°C x30″, and 72°C × 30″ for a total of 29 cycles. All rtPCR samples were run on 1–2% agarose gels stained with ethidium bromide and visualized under UV light. A digital image of the illuminated gel was obtained and the amount of a given PCR product was quantified by densitometric scanning using a commercially available system (Alpha Innotec Corp.).
Statistical Analysis
All data are shown as mean ± standard error of the mean (sem). Survival plots were constructed using Kaplan Meier Analysis and survival between the groups was compared using the Mantel Cox log-rank test. Two-way analysis of variance (ANOVA) was used to detect an interaction between treatments (E2 vs. Placebo) and the hypertrophic stimulus (MI vs. TAC). Where appropriate, individual pair-wise comparisons were conducted using the Student Newman-Keuls test to correct for multiple group comparisons.
Results
Survival
None of the mice in the short-term study died. In the long-term study, 2 E2 shams died. Following MI, 88% (21/24 mice) survived in the placebo-treated group compared with only 64% (21 of 33 mice) in the E2-treated group (p<0.05). Following TAC, 100% (20/20 mice) of the placebo-treated mice survived compared with 78% (18/23 mice) of the E2-treated group (p<0.01).
Estrogen Levels and Uterine Weights
Estradiol levels in the E2-treated mice were significantly greater than the placebo-treated mice (217±25 vs. 7.5±0.6pg/ml, p<0.01). Uterine weights were also significantly increased in the E2-treated mice compared with the placebo-treated mice (111±4 vs. 11.3±0.3mg, p<0.01). In the short-term study, a similar pattern of uterine weights was evident.
Infarct Size
Infarct size data are shown in Table I. Infarct sizes were similar in the placebo-MI and E2-MI groups. In the short-term study, infarct sizes were not measured but infarcts were visually inspected to ensure involvement of the apex and anterior wall.
Table I.
Hemodynamic Data
| Sham | MI | TAC | ||||
|---|---|---|---|---|---|---|
|
| ||||||
| Placebo (N=10) | E2 (N=8) | Placebo (N=21) | E2 (N=21) | Placebo (N=20) | E2 (N=18) | |
| Infarct Size (%) | 28.4±1.5 | 31.3±1.6 | ||||
| HR (bpm) | 529±14 | 530±19 | 507±11 | 564±6* | 554±10 | 580±6† |
| LVSP (mmHg) | 94.6±2.2 | 95.0±3.1 | 89.0±1.4 | 84.9±2.1† | 149±2‡ | 144±3‡ |
| Gradient (mmHg) | 4.4±2.1 | 4.0±4.0 | - | - | 64.2±3.1† | 55.1±6.5† |
| LVEDP (mmHg) | 3.1±1.0 | 2.7±1.4 | 7.3±0.8† | 9.3±1.3† | 11.8±1.4† | 12.4±1.5† |
| +dP/dt (mmHg s−1) | 10452±535 | 9575±315 | 8378±211† | 6734±289†* | 8836±190† | 8467±213† |
All data are means±sem. HR=heart rate, LVSP=LV systolic pressure; Gradient refers to systolic pressure drop across the aortic stricture in TAC animals. LVEDP=LV end diastolic pressure; +dP/dt=peak positive dP/dt derived from the first differential of the LV pressure tracing.
p<0.05 vs. Placebo-MI,
p<0.05 vs. the respective sham group.
p<0.01 vs. the respective sham and MI group.
Hemodynamic Parameters
Mice sacrificed at two weeks underwent hemodynamic evaluation, the results of which are shown in Table I. The E2-MI group had a significantly higher heart rate compared to the placebo-MI group; the E2-TAC group had a significantly higher heart rate than E2 shams. MI had no significant effect on LV systolic pressure in the placebo group but E2 treatment significantly lowered LVSP compared to E2-shams. TAC increased LV systolic pressure to a similar extent in the placebo- and E2-treated mice. Systolic pressure gradients across the aortic constriction were also statistically similar between the placebo- and E2-TAC groups. MI and TAC raised LV end diastolic pressure (LVEDP) to a similar degree in the placebo and E2 groups. MI decreased peak positive LV dP/dt in the placebo group, that was even lower in the E2 group. TAC caused a similar decline in peak positive LV dP/dt in the placebo and E2-treated groups.
LV Chamber Size and Mass
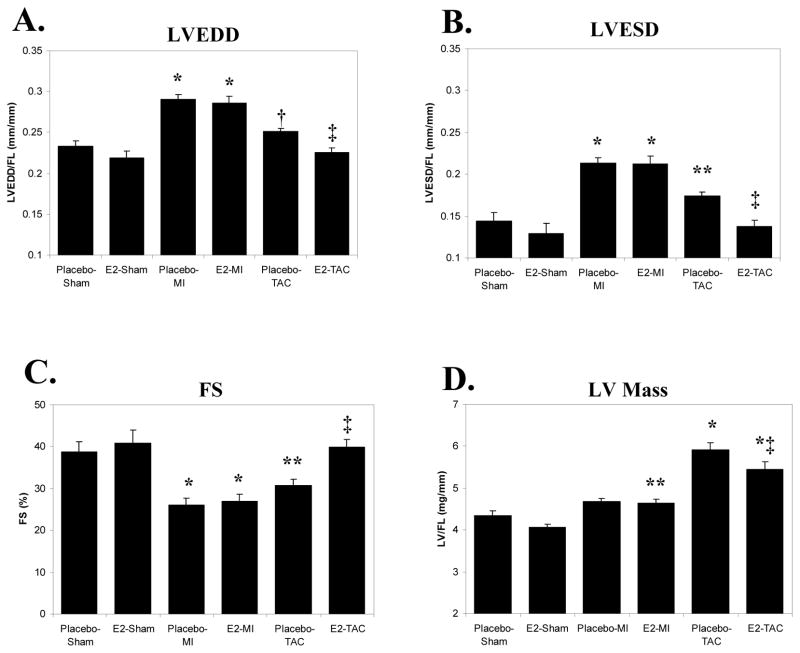
LVEDD and LVESD measurements are shown in Figure 1. These values along with LV mass were indexed to FL rather than body weight (BW) because of differences in body weight between E2 and placebo-treated mice. MI increased LVEDD/FL (Fig 1A), LVESD/FL (Fig 1B), and decreased fractional shortening (FS-Fig 1C) in the placebo group. None of these parameters were altered significantly by E2 treatment. In the placebo-treated mice, TAC led to a trend for increased LVEDD/FL (p=0.09 vs. placebo-shams) and E2 significantly limited the increase in LVEDD/FL. TAC caused a significant increase in LVESD/FL and decrease in FS in the placebo group that were normalized by E2 treatment. As shown in Figure 1D, MI did not significantly increase LV mass (LV/FL) in the placebo group (p=0.13 vs. placebo-shams). E2 treatment, however, significantly increased LV/FL post-MI compared to E2-shams. TAC led to an increase in LV/FL in the placebo group but in this model, E2 treatment limited the increase in LV/FL following TAC (p<0.05 vs. placebo-TAC).
Figure 1. LV Chamber Size, Function, and LV Mass 2 Weeks Following MI vs. TAC.
All data are means±sem; bar graphs represent echocardiographically derived LV chamber size and function; LV mass was measured immediately post-mortem. LV end diastolic diameter (LVEDD), end systolic diameter (ESD), and LV mass are indexed to femoral length (FL). MI=myocardial infarction; TAC=transverse aortic constriction; E2=17β-estradiol; FS=fractional shortening. * p<0.01 vs. the respective sham group; † p=0.09 vs. placebo-shams; ‡ p<0.05 vs. placebo-TAC; ** p<0.05 vs. the respective sham group.
Myocyte Hypertrophy
Compared to shams, the placebo-MI group demonstrated a statistically similar myocyte CSA compared to shams (226±28 vs. 214±9μm2, p=NS). Consistent with our prior study,[6] E2 treatment caused a significant increase in myocyte CSA following MI (263±16μm2, p<0.05 vs. Placebo-MI and Shams). TAC significantly increased myocyte CSA in the placebo group (273±17μm2), and E2 treatment led to a non-significant reduction in myocyte CSA following TAC (255±15μm2). By 2-way ANOVA, there was a significant interaction (p<0.05) between treatment and the hypertrophic stimulus supporting that the effect of E2 treatment on myocyte CSA differed significantly between the MI and TAC models.
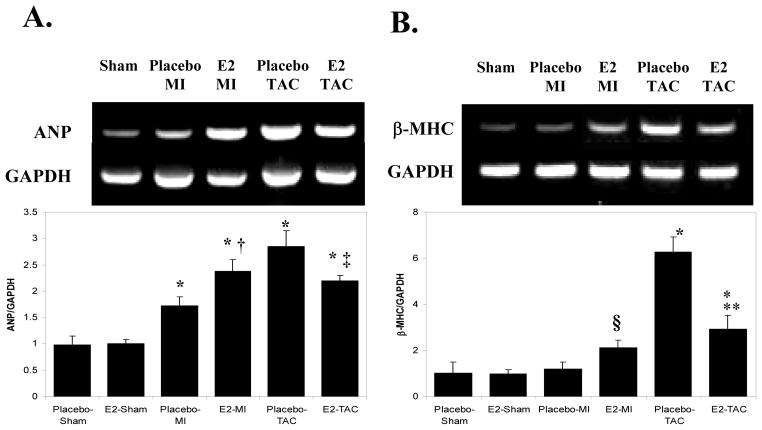
During hypertrophy, myocytes express increased ANP and β-MHC mRNA comparable to those in the fetal heart during development.[16] As shown in Figures 2A and 2B, MI increased ANP gene expression in the placebo group compared to placebo-shams; E2 treatment led to a significantly greater increase in ANP expression following MI. TAC also increased ANP expression in the placebo group; E2 replacement significantly limited the TAC-induced increase in ANP expression. MI did not increase the expression of β-MHC in the placebo-group but E2 treatment resulted in a 2-fold increase in β-MHC expression post-MI (p=0.09 vs. E2-sham). TAC caused a significant increase in β-MHC expression in placebo treated mice; E2 treatment limited the increase in β-MHC expression following TAC. 2-way ANOVA analysis for both ANP and β-MHC gene expression were significant (p<0.01 for ANP and β-MHC) supporting that E2 treatment has different effects on the expression of these hypertrophic markers between the MI and TAC models. Taken together, these data support that E2 treatment augments hypertrophy following MI but inhibits hypertrophy following TAC.
Figure 2. Gene Expression Markers of Myocyte Hypertrophy 2 weeks following MI vs. TAC.
A. ANP Gene Expression. Measured semi-quantitatively using multiplex rtPCR, simultaneously measuring GAPDH and ANP. The figure represents an example of an ethidium bromide-stained agarose gel from which ANP gene expression (above) was quantified by densitometry, correcting for GAPDH levels (below). B. β-MHC Gene Expression: Measured by multiplex rtPCR as with ANP. * p<0.01 vs. the respective sham group. † p<0.05 vs. placebo-MI. ‡p<0.05 vs. placebo-TAC. ** p<0.01 vs. placebo-TAC. § p=0.09 vs. E2-Sham
p38 and ERK 1/2 Activation Following MI vs. TAC
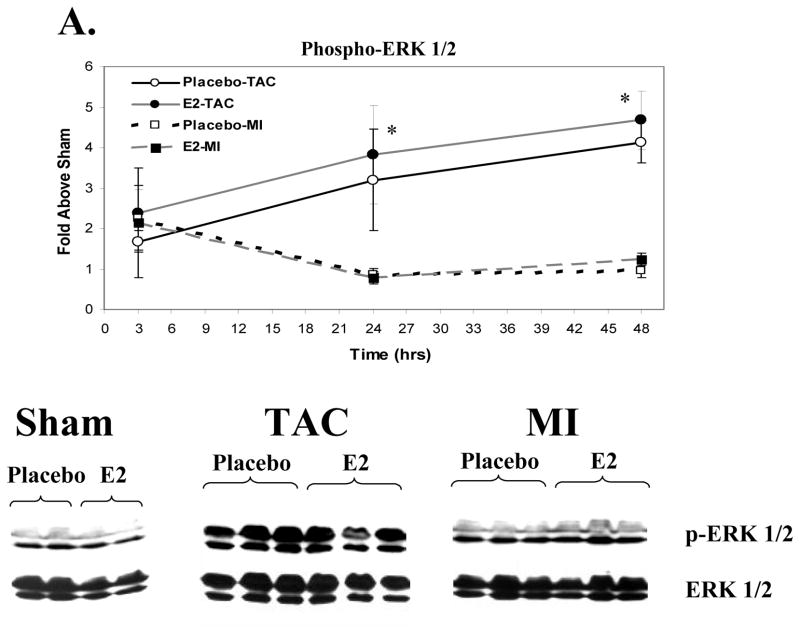
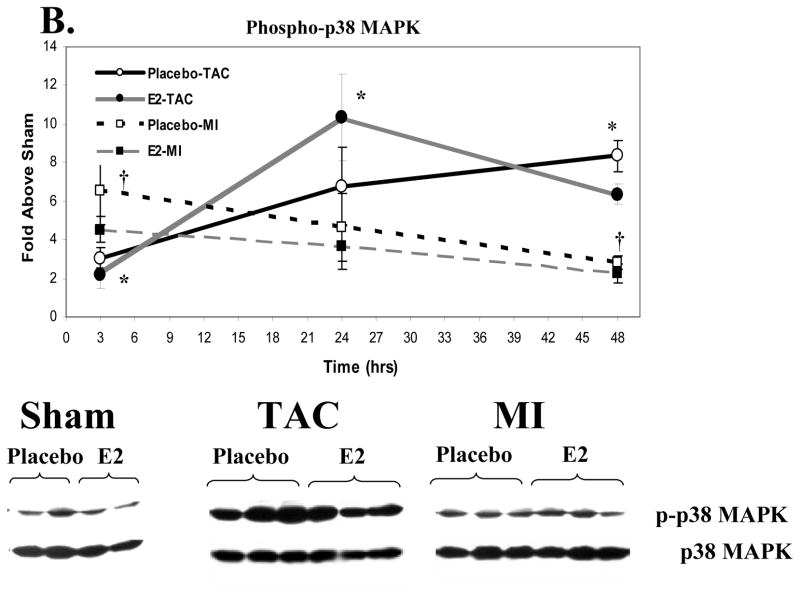
We utilized myocardial samples from the short term study to explore whether differences in early signaling pathway activation contribute to the disparate effects of E2 on hypertrophy in the MI and TAC models. MI and TAC induced a modest rise in ERK1/2 phosphorylation at 3 hours (Figure 3A). ERK1/2 phosphorylation in the MI group decreased to a level similar to Shams at 24 and 48 hours. In both the estrogen and placebo groups, TAC led to a significant and sustained increase in phosphorylation of ERK1/2 at 24 and 48 hours compared to MI and sham groups. MI caused a significant increase in p38 MAPK phosphorylation at 3 hours compared to Shams (Figure 3B) that waned at 24 and 48 hours. TAC significantly increased p38 phosphorylation at 3 hours compared to shams but significantly less than MI. At 24 and 48 hours, TAC increased p38 phosphorylation to a greater degree compared to Shams and MI. E2 treatment did not affect activation of p38 MAPK following MI or TAC. Thus, MI and TAC lead to different activation patterns of ERK 1/2 and p38 MAPK. No significant increases in Akt or Glycogen synthase kinase 3β phosphorylation were observed at these selected time points (data not shown).
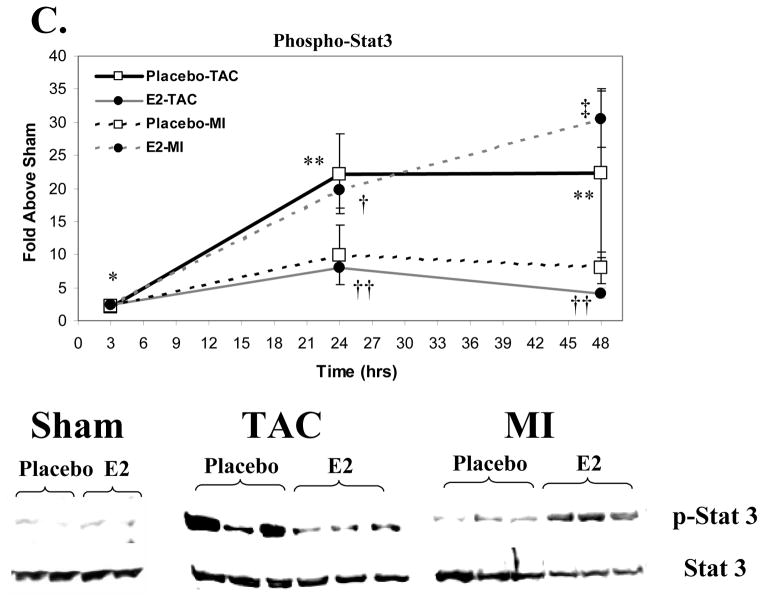
Figure 3. Signaling Pathway Activation Following MI vs. TAC.
Activation of these signaling kinases was assessed by western blotting for the activated, phospho-form, correcting for total kinase levels. Data represent the fold increase vs. the respective sham group (not included). Placebo groups (N=4 each for Sham, MI and TAC at each time point) are represented in open squares with black lines that are either solid (TAC) or dashed (MI); Estrogen groups (N=4 for Sham, MI and TAC at each time point) are depicted as black circles with grey lines that are either solid (TAC) or dashed (MI). The western blots shown are representative of the 48-hour time point. Data are means±sem. A. ERK1/2 Activation. *p<0.01 TAC (E2 and placebo) vs. sham and MI groups within a given time point. B. p38 MAPK Activation. * p<0.05 TAC (E2 and placebo) vs. sham and MI groups within a given time point. † p<0.05 MI (E2 and placebo) vs. shams. No significant differences were observed between E2 and placebo groups in the activation of these signaling kinases following MI or TAC. C. Stat3 Activation. *p<0.05, MI or TAC (placebo and E2) vs. shams; † p<0.05 E2-MI vs. E2-shams; ‡p<0.05 E2-MI vs. E2-shams and placebo-MI. **p<0.05 placebo-TAC vs. placebo-shams. †† p<0.05 E2-TAC vs. placebo-TAC. 2 way-ANOVA revealed a signficant treatment by procedure interaction supporting that the effect of E2 treatment on Stat3 activation differed between the MI and TAC models (p<0.05 at 24 hours and p<0.01 at 48 hours).
Activation of Signal Transducer and Activator of Transcription 3 (Stat3) Following MI versus TAC
Because of the known importance of Stat3 activation in cardiac hypertrophy,[17,18] we analyzed the relative phosphorylation of Tyr705, a residue targeted by Janus kinases (JAK) thereby activating Stat3 (Figure 3C). In both E2 and placebo treated mice, MI increased Tyr705-phosphorylated Stat3 (p-Stat3) at 3 hours compared to shams. In the placebo group, MI led to a modest rise in p-Stat3 at 24 and 48 hours, that was significantly augmented by E2 treatment at both time points. TAC increased p-Stat3 at 3 hours to a similar degree in placebo and E2 groups. With placebo, TAC further increased p-Stat3 at 24 and 48 hours compared to shams. In contrast to that seen following MI, however, E2 reduced p-Stat3 at 24 and 48 hours compared to placebo-treated TAC mice. By 2-way ANOVA, a significant interaction between treatment and stimulus for hypertrophy was present (p<0.05 at 24 hours and p<0.01 at 48 hours) supporting that effects of E2 treatment on Stat3 activation differed significantly between the MI and TAC model.
Discussion
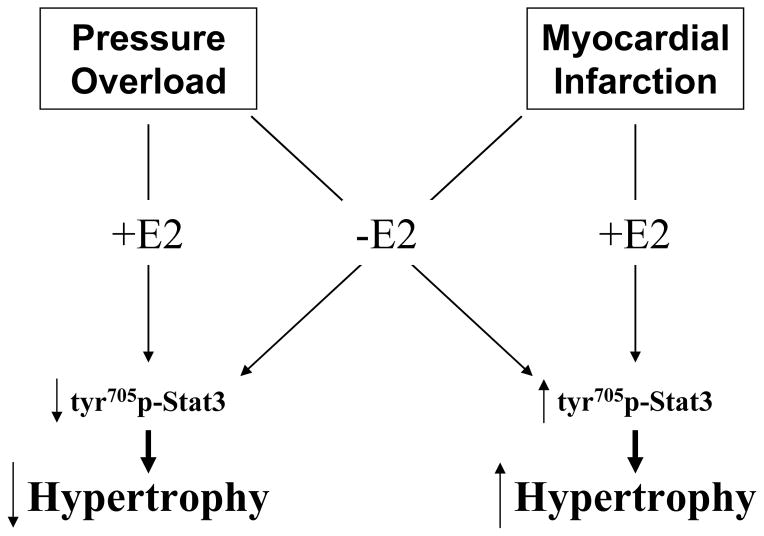
In a prior study, we observed that E2 treatment resulted in greater LV remodeling and myocyte hypertrophy 6-weeks following MI. These findings are in contrast to the effects of E2 treatment on LV remodeling reported in pressure overload models.[6–8] The discrepancy among these studies could be the result of experimental variations such as differences in species/strains, E2 administration or dose, animal age or operator techniques. However, these findings suggest that the effects of E2 on LV remodeling might depend on the stimulus for hypertrophy. To test this hypothesis, we directly compared the effects of E2 on LV hypertrophy, myocyte cross sectional area, and molecular markers of remodeling in mouse models of MI or pressure overload induced by TAC. We demonstrate here that 2 weeks following MI, treatment with 17β-estradiol in ovariectomized female mice results in a greater increase in myocyte CSA, ANP and β-MHC gene expression consistent with increased myocyte hypertrophy, though these changes at the cellular level were not apparent in the echocardiographic or gross morphologic assessment of LV remodeling. In contrast, E2 treatment following TAC limited the increase in LV mass, ANP and β-MHC gene expression, while preserving LV chamber size and function. As summarized in the schematic within Figure 4, these data support our initial hypothesis that estrogen treatment can increase or inhibit LV or myocyte remodeling in a manner dependent on the nature of the hypertrophic stimulus.
Figure 4.
Flow diagram summarizing the manner in which estrogen replacement differentially influences Stat3 phosphorylation and hypertrophy in the mouse MI and TAC models.
In our prior 6-week MI study,[6] estrogen increased the extent of LV hypertrophy and dilation. While the current results at 2-weeks presented here differ from our previous study, this likely results from continued and more rapid progression of LV and myocyte hypertrophy between two and six weeks following MI in E2-treated mice compared to placebo. Consistent with our previous study, however, myocyte CSA increased only in the E2-MI, but not in the placebo-MI group, further substantiating that E2 treatment may promote a more concentric pattern of myocyte remodeling. On the contrary, the placebo-MI group at 6 weeks developed a significant increase in LV mass but no increase in myocyte CSA was observed at both 2 and 6 weeks. Because myocyte size is a major determinant of LV mass, these findings suggest that lack of E2 following MI leads to the development of a more eccentric pattern of hypertrophy, i.e. myocytes increasing in length rather than width. Due to the nature of our studies here we were unable to perform myocyte morphometric measurements on freshly dispersed cardiac myocytes. Further studies are required to explore how E2 affects myocyte length in these models.
The effects of E2 on hypertrophy in response to pressure overload are in agreement with a prior study in ovariectomized female mice 4 weeks following TAC.[14] In this study, van Eickels et al demonstrated enhanced ANP protein expression in the E2-treated TAC animals at 4 weeks, while ANP mRNA expression in our study appeared to mirror closely the effects of E2 on hypertrophy. The reasons for these discrepant results may be related to the methods used to measure ANP (western blotting vs. rtPCR) or the time at which mice were sacrificed (4 vs. 2 weeks). Based on our findings, however, we cannot invoke ANP as important to the anti-hypertrophic effects of E2 in response to pressure overload. On the contrary, enhanced ANP expression in the E2-MI group was associated with greater hypertrophy.
While the mechanisms of these opposing E2-effects on LV and myocyte remodeling in the MI and TAC models are not entirely clear, our data provide some potentially important and novel insights. The short-term study was conducted to address whether differences exist in the early activation of signaling pathways following TAC versus MI. The current findings demonstrate interesting differences in signaling pathway activation between the MI and TAC models: MI led to greater early (3 hours) but transient activation of p38 MAPK and ERK1/2 compared to TAC which produced a progressive and sustained increase in the activation of both signaling pathways. It is interesting to note that both p38 MAPK and ERK1/2 have been reported to phosphorylate estrogen receptors.[19,20] Thus, the different patterns of kinase activation between the TAC and MI models observed here may have led to differences in estrogen receptor phosphorylation that in turn might alter the signaling responses to E2.
We also chose to analyze the effects of E2 on phosphorylation of Stat3, the activation of which occurs immediately downstream to the gp130-associated cytokine receptors. Upon phosphorylation at tyrosine 705, Stat3 enters the nucleus and promotes the transcription of hypertrophic genes including β-MHC within cardiac myocytes.[17,18] In line with the observed differences on hypertrophy and remodeling between the TAC and MI models, E2 had opposing effects on activation of Stat3, increasing Stat3 phosphorylation following MI and decreasing Stat3 phosphorylation following TAC. As also demonstrated in Figure 4, these novel findings support that the E2-induced differences in Stat3 activation may, in part, account for the opposing effects of E2 in these models. The mechanism by which estrogen influences the activation of the Stat family of transcription factors has not been elucidated in cardiac myocytes. However, in cultured osteoclasts, estrogen rapidly induces Stat1 tyrosine phosphorylation and DNA binding in a manner dependent on Src kinase.[21] Similar findings have been reported in endothelial cells.[22] Elucidation of the precise molecular mechanisms that underlie the differential effects of E2 on Stat3 activation and myocyte hypertrophy following MI or TAC will require further investigation.
Other signaling pathways that may play a role in the myocyte hypertrophic response include Akt and glycogen synthase kinase 3β, among many others. We did not observe an effect of E2 on the Akt or GSK3β phosphorylation in this study. In a prior study, we showed that E2 replacement led to increased activation of Akt in the peri-infarct zone in the early period following MI.[23] The time points of this prior study differed from those chosen in our present analysis in which non-infarct zone tissue (rather than peri-infarct zone) was analyzed. In the post-MI heart, we also demonstrated previously that E2 replacement limits myocyte apoptosis in the peri-infarct zone at 24 and 72 hours following coronary ligation.[6,23] Our primary interest in the present study was to explore the effects of E2 replacement on hypertrophy and not apoptosis. If E2 replacement also reduced the low level of apoptosis following TAC, this may, if at all, contribute to an increase in LV mass in this pressure overload model due to a reduction in myocyte cell loss.
Analyses of clinical heart failure trials have shown that postmenopausal women taking estrogen have improved morbidity and mortality compared with those not on estrogen.[24,25] Importantly, a majority of women in these trials had heart failure secondary to non-ischemic etiologies and a subgroup analysis from the study by Lindenfeld et al demonstrated that the benefits of HRT were only significant in those with non-ischemic etiology.[24,25] Aside from effects on heart failure incidence or progression, recent randomized trials that included women with either elevated risk for, or known coronary artery disease demonstrated that hormone replacement therapy (including estrogen and progesterone) does not reduce cardiovascular events and in some circumstances may increase morbidity.[26–29] While our findings in short term mouse models cannot be extrapolated to explain clinical observations, LV remodeling is increasingly being recognized as an important prognostic variable and potential surrogate for clinical outcomes.[30] The disparities among hormone replacement therapy studies may, in part, result from differential effects of estrogen on LV remodeling. Clearly, further investigation is needed to more fully understand the complex effects of estrogen and its receptors on cardiomyocyte growth and LV remodeling.
In summary, we demonstrate here that E2 treatment increases myocyte hypertrophy following MI, yet reduces LV and myocyte hypertrophy following TAC in association with preserved LV chamber size and function. The effects of E2 on hypertrophy are mirrored by differential activation of Stat3 activation that may, in part, contribute to the disparate effects of E2 in these models. These data therefore support that estrogen treatment can promote or inhibit LV and myocyte remodeling in a manner dependent on the nature of the hypertrophic stimulus. Further work will be needed to more completely understand the mechanisms underlying these E2-mediated effects on cardiomyocyte growth.
Acknowledgments
This work was supported in part by the American Heart Association (Grant #0256206T-RDP), NIH R01-HL078003 (RDP) and NIH R01-HL61298 (RHK). Dr. Karas is also supported by an AHA Established Investigator Award.
Footnotes
The contents of this manuscript are solely the responsibility of the authors and do not necessarily represent the official view of the NIH or AHA.
Publisher's Disclaimer: This is a PDF file of an unedited manuscript that has been accepted for publication. As a service to our customers we are providing this early version of the manuscript. The manuscript will undergo copyediting, typesetting, and review of the resulting proof before it is published in its final citable form. Please note that during the production process errors may be discovered which could affect the content, and all legal disclaimers that apply to the journal pertain.
References
- 1.American Heart Association. Heart Disease and Stroke Statistics: 2005 Statistical Supplement. Dallas, TX: 2005. pp. 1–60. [Google Scholar]
- 2.Molkentin JD, Dorn GW., II Cytoplasmic Signaling Pathways That Regulate Cardiac Hypertrophy. Annual Review of Physiology. 2001;63:391–426. doi: 10.1146/annurev.physiol.63.1.391. [DOI] [PubMed] [Google Scholar]
- 3.Nicol RL, Frey N, Olson EN. From The Sarcomere To The Nucleus: Role of Genetics and Signaling in Structural Heart Disease. Annual Review of Genomics and Human Genetics. 2000;1:179–223. doi: 10.1146/annurev.genom.1.1.179. [DOI] [PubMed] [Google Scholar]
- 4.Hayward CS, Kelly RP, Collins P. The roles of gender, the menopause and hormone replacement on cardiovascular function. Cardiovasc Res. 2000;46:28–49. doi: 10.1016/s0008-6363(00)00005-5. [DOI] [PubMed] [Google Scholar]
- 5.Leinwand LA. Sex is a potent modifier of the cardiovascular system. J Clin Invest. 2003;112:302–307. doi: 10.1172/JCI19429. [DOI] [PMC free article] [PubMed] [Google Scholar]
- 6.van Eickels M, Patten RD, Aronovitz MJ, Alsheikh-Ali A, Gostyla K, Celestin F, et al. 17-Beta-Estradiol increases cardiac remodeling and mortality in mice with myocardial infarction. Journal of the American College of Cardiology. 2003;41:2084–2092. doi: 10.1016/s0735-1097(03)00423-6. [DOI] [PubMed] [Google Scholar]
- 7.Xin HB, Senbonmatsu T, Cheng DS, Wang YX, Copello JA, Ji GJ, et al. Oestrogen protects FKBP12. 6 null mice from cardiac hypertrophy. Nature. 2002;416:334–8. doi: 10.1038/416334a. [DOI] [PubMed] [Google Scholar]
- 8.Sharkey LC, Holycross BJ, Park S, Shiry LJ, Hoepf TM, McCune SA, et al. Effect of ovariectomy and estrogen replacement on cardiovascular disease in heart failure-prone SHHF/Mcc- fa cp rats. J Mol Cell Cardiol. 1999;31:1527–37. doi: 10.1006/jmcc.1999.0985. [DOI] [PubMed] [Google Scholar]
- 9.Sullivan TR, Karas RH, Aronovitz M, Faller GT, Ziar JP, O’Donnell TF, Mendelsohn ME. Estrogen inhibits the response-to-injury in a mouse carotid artery injury model. J Clin Invest. 1995;96:2482–2488. doi: 10.1172/JCI118307. [DOI] [PMC free article] [PubMed] [Google Scholar]
- 10.Iafrati MD, Karas RH, Aronovitz M, Kim S, Sullivan TR, Jr, Lubahn DB, et al. Estrogen inhibits the vascular injury response in estrogen receptor alpha-deficient mice. Nat Med. 1997;3:545–8. doi: 10.1038/nm0597-545. [DOI] [PubMed] [Google Scholar]
- 11.Patten RD, Aronovitz MJ, Bridgman P, Pandian NG. Use of pulse wave and color flow Doppler echocardiography in mouse models of human disease. Journal of the American Society of Echocardiography. 2002;15:708–714. doi: 10.1067/mje.2002.118912. [DOI] [PubMed] [Google Scholar]
- 12.Patten RD, Aronovitz MJ, Deras-Mejia L, Pandian NG, Hanak GG, Smith JJ, et al. Ventricular remodeling in a mouse model of myocardial infarction. Am J Physiol Heart Circ Physiol. 1998;274:H1812–1820. doi: 10.1152/ajpheart.1998.274.5.H1812. [DOI] [PubMed] [Google Scholar]
- 13.Patten RD, Aronovitz MJ, Einstein M, Lambert M, Pandian NG, Mendelsohn ME, et al. Effects of angiotensin II receptor blockade versus angiotensin-converting-enzyme inhibition on ventricular remodelling following myocardial infarction in the mouse. Clin Sci (Lond) 2003;104:109–18. doi: 10.1042/CS20020219. [DOI] [PubMed] [Google Scholar]
- 14.van Eickels M, Grohe C, Cleutjens JP, Janssen BJ, Wellens HJ, Doevendans PA. 17beta-Estradiol attenuates the development of pressure-overload hypertrophy. Circulation. 2001;104:1419–23. doi: 10.1161/hc3601.095577. [DOI] [PubMed] [Google Scholar]
- 15.Haq S, Kilter H, Michael A, Tao J, O’Leary E, Sun XM, et al. Deletion of cytosolic phospholipase A2 promotes striated muscle growth. Nature Medicine. 2003;9:944–951. doi: 10.1038/nm891. [DOI] [PubMed] [Google Scholar]
- 16.Chien KR, Knowlton KU, Zhu H, Chien S. Regulation of cardiac gene expression during myocardial growth and hypertrophy: molecular studies of an adaptive physiologic response. FASEB J. 1991;5:3037–3046. doi: 10.1096/fasebj.5.15.1835945. [DOI] [PubMed] [Google Scholar]
- 17.Hilfiker-Kleiner D, Hilfiker A, Drexler H. Many good reasons to have STAT3 in the heart. Pharmacology & Therapeutics. 2005;107:131–137. doi: 10.1016/j.pharmthera.2005.02.003. [DOI] [PubMed] [Google Scholar]
- 18.Booz GW, Day JNE, Baker KM. Interplay Between the Cardiac Renin Angiotensin System and JAK-STAT Signaling: Role in Cardiac Hypertrophy, Ischemia/Reperfusion Dysfunction, and Heart Failure. Journal of Molecular and Cellular Cardiology. 2002;34:1443–1453. doi: 10.1006/jmcc.2002.2076. [DOI] [PubMed] [Google Scholar]
- 19.Lu Q, Ebling H, Mittler J, Baur WE, Karas RH. MAP kinase mediates growth factor-induced nuclear translocation of estrogen receptor [alpha] FEBS Letters. 2002;516:1–8. doi: 10.1016/s0014-5793(02)02432-8. [DOI] [PubMed] [Google Scholar]
- 20.Likhite VS, Stossi F, Kim K, Katzenellenbogen BS, Katzenellenbogen JA. Kinase-Specific Phosphorylation of the Estrogen Receptor Changes Receptor Interactions with Ligand, Deoxyribonucleic Acid, and Coregulators Associated with Alterations in Estrogen and Tamoxifen Activity. Mol Endocrinol. 2006;20:3120–3132. doi: 10.1210/me.2006-0068. [DOI] [PubMed] [Google Scholar]
- 21.Kennedy AM, Shogren KL, Zhang M, Turner RT, Spelsberg TC, Maran A. 17{beta}-Estradiol-Dependent Activation of Signal Transducer and Activator of Transcription-1 in Human Fetal Osteoblasts Is Dependent on Src Kinase Activity. Endocrinology. 2005;146:201–207. doi: 10.1210/en.2004-0486. [DOI] [PubMed] [Google Scholar]
- 22.Bjornstrom L, Sjoberg M. Signal Transducers and Activators of Transcription as Downstream Targets of Nongenomic Estrogen Receptor Actions. Mol Endocrinol. 2002;16:2202–2214. doi: 10.1210/me.2002-0072. [DOI] [PubMed] [Google Scholar]
- 23.Patten RD, Pourati I, Aronovitz MJ, Baur J, Celestin F, Chen X, et al. 17{beta}-Estradiol Reduces Cardiomyocyte Apoptosis In Vivo and In Vitro via Activation of Phospho-Inositide-3 Kinase/Akt Signaling. Circ Res. 2004;95:692–699. doi: 10.1161/01.RES.0000144126.57786.89. [DOI] [PubMed] [Google Scholar]
- 24.Reis SE, Holubkov R, Young JB, White BG, Cohn JN, Feldman AM. Estrogen is associated with improved survival in aging women with congestive heart failure: analysis of the vesnarinone studies. J Am Coll Cardiol. 2000;36:529–33. doi: 10.1016/s0735-1097(00)00738-5. [DOI] [PubMed] [Google Scholar]
- 25.Lindenfeld J, Ghali JK, Krause-Steinrauf HJ, Khan S, Adams J, Kirkwood, Goldman S, et al. Hormone replacement therapy is associated with improved survival in women with advanced heart failure. Journal of the American College of Cardiology. 2003;42:1238–1245. doi: 10.1016/s0735-1097(03)00938-0. [DOI] [PubMed] [Google Scholar]
- 26.Grady D, Herrington D, Bittner V, Blumenthal R, Davidson M, Hlatky M, et al. Cardiovascular disease outcomes during 6. 8 years of hormone therapy: Heart and Estrogen/progestin Replacement Study follow-up (HERS II) JAMA. 2002;288:49–57. doi: 10.1001/jama.288.1.49. [DOI] [PubMed] [Google Scholar]
- 27.Hulley S, Grady D, Bush T, Furberg C, Herrington D, Riggs B, et al. Randomized trial of estrogen plus progestin for secondary prevention of coronary heart disease in postmenopausal women. Heart and Estrogen/progestin Replacement Study (HERS) Research Group. JAMA. 1998;280:605–13. doi: 10.1001/jama.280.7.605. [DOI] [PubMed] [Google Scholar]
- 28.Rossouw JE, Anderson GL, Prentice RL, LaCroix AZ, Kooperberg C, Stefanick ML, et al. Risks and benefits of estrogen plus progestin in healthy postmenopausal women: principal results From the Women’s Health Initiative randomized controlled trial. JAMA. 2002;288:321–33. doi: 10.1001/jama.288.3.321. [DOI] [PubMed] [Google Scholar]
- 29.Manson JE, Hsia J, Johnson KC, Rossouw JE, Assaf AR, Lasser NL, et al. Estrogen plus Progestin and the Risk of Coronary Heart Disease. N Engl J Med. 2003;349:523–534. doi: 10.1056/NEJMoa030808. [DOI] [PubMed] [Google Scholar]
- 30.Udelson JE, Patten RD, Konstam MA. New concepts in post-infarction ventricular remodeling. Rev Cardiovasc Med. 2003;4:S3–12. [PubMed] [Google Scholar]


