

Abstract
Objective
The purpose of this study was to summarize the existing scientific literature on the relationship between economic factors and life expectancy (LE) after spinal cord injury (SCI), present new data on the relationship between household income and LE, and present a revised theoretical risk model to account for the observed relationships.
Research Design
Data were from a prospective cohort study of 1386 participants with SCI which began in 1997. Mortality status was determined 10 years later. Person year logistic regression was used to evaluate predictors of mortality and to generate LE estimates, as each year of follow-up was treated as a separate observation (rather than a single observation per person).
Results
Results indicated significant relationships between age, injury severity, household income and LE, which suggest the need for more refined models of economic factors and LE.
Conclusions
LE estimates in life care plans need to account for economic factors in order to improve accuracy. It is important to allocate resources to meet all healthcare needs throughout the lifecycle to ensure that LE is not compromised.
Keywords: spinal cord injuries, life expectancy, mortality, economics
Introduction
Life expectancy (LE) estimates have taken on great importance in life care plans. They reflect the number by which annual costs will be multiplied and ultimately the extent to which services and goods will be provided in order to meet the lifetime needs of an individual with a catastrophic disability. Inaccurate estimates of LE will result in either provision of additional money and resources beyond that required (over estimation of LE) or insufficient allocation of resources to meet the lifetime health needs of the individual (underestimation of LE). Because these goods and services, such as attendant care, medications, and diagnostic tests, may be required to maintain life, underestimates of LE have the potential to undermine access to the very resources required for survival. Socioeconomic factors are related to longevity within the general population, so allocation of resources for medical needs is important to not compromise LE (Lin, Rogot, Johnson, Sorlie, & Arias, 2003; Rogot, Sorlie, & Johnson, 1992).
The purpose of this manuscript is to identify the association of economic factors with LE after traumatic injury, using spinal cord injury (SCI) as the example, and to summarize the importance of these findings in life care planning. The primary objectives are to: (a) present a summary of the relevant literature on economic factors and LE after SCI, (b) analyze new data regarding the relationship between economic factors, as defined by household income, with LE, and (c) describe an expanded theoretical risk model for identifying factors that mediate the relationship between economic status and LE. This study has significant implications for the life care plan, although LE estimates are typically done by expert consultants rather than the life care planner.
Background and Theoretical Risk Model
The vast majority of research has assessed the relationship between biographic and injury factors with mortality and LE, with little attention to other types of factors. This research is widely used in life care planning. Frequently, LE estimates in life care plans are generated by accounting for the individuals’ biographic characteristics, such as age, race, and gender, as well as their injury characteristics, particularly level and ASIA grade. Age is the most important predictor of longevity. LE predictions also vary substantially as a function of injury severity. LE tables generated from a combination of age at injury and injury severity are summarized under SCI Facts and Figures (Spinal Cord Injury Facts and Figures at a Glance, 2009) from the National SCI Statistical Center (NSCISC) in Birmingham, AL. These data are collected as part of the federally funded Model SCI Systems.
Krause (1996) proposed a theoretical model to account for the full range of factors related to risk of mortality. The model includes several sets of predictive factors, including: (a) biographic and injury related, (b) psychological, (c) environmental, (d) behavioral, and (e) health and secondary conditions. According to the model (Figure 1), with the exception of biographic and injury factors, the factors most proximal to mortality are the strongest and most important predictors. Therefore, health and secondary conditions are the strongest predictors of mortality, followed by behaviors, and environmental and psychological factors (the latter two sets of factors are viewed on a parallel plane). In essence, each set of factors explains for an increasing variation in mortality, in addition to that accounted for by the biographic and injury factors.
Figure 1.
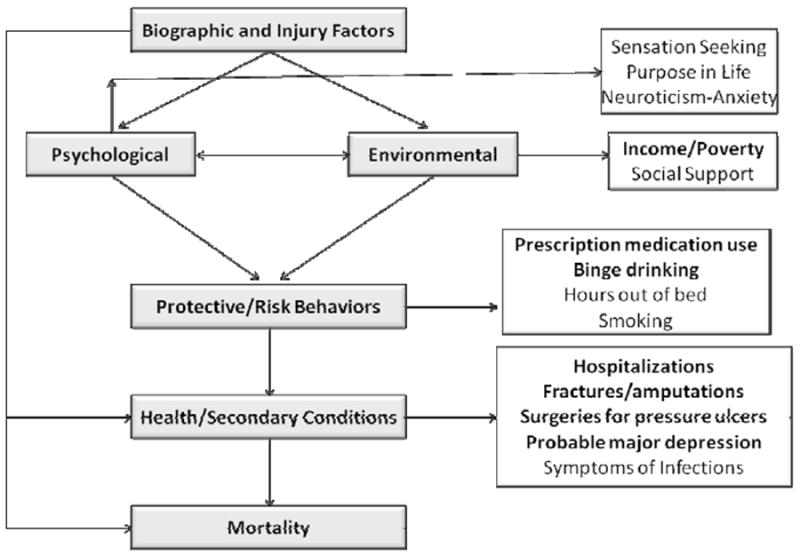
Theoretical risk model of mortality.
Krause, J. S. (1996). Secondary conditions and spinal cord injury: A model for prediction and prevention. Topics in Spinal Cord Injury Rehabilitation, 2, 217-227.
The overall model includes a series of mediational models where consideration of one set of factors explains a more distal set of factors. For instance, any observed relationships between health behaviors and mortality should be mediated by health factors, such that introduction of health factors into the prediction would result in behavioral predictors being less important or no longer significant. Similarly, any relationship between environmental factors and mortality would be mediated by health behaviors and health factors. An example of an environmental variable would be income, which would serve as a proxy variable for factors such as access to care. Therefore, although we would expect income to be related to mortality, we would not anticipate this to be a direct relationship and that it would no longer be significant after accounting for these other factors.
We have conducted several studies utilizing data from 1386 participants who have identified significant predictors of mortality after SCI. These predictors are highlighted on the Figure 1. Each of the variables indicated in the boxes were statistically significant in relation to mortality in a series of analyses, using biographic and injury variables as statistical controls (i.e., separate analyses were conducted for environmental, psychological, behavioral, and health predictors). Five health factors were significant risk factors for early mortality including: probable major depression, surgeries to repair pressure ulcers, fractures/amputations, symptoms of infections, and number of days hospitalized (Krause, Carter, Pickelsimer, & Wilson, 2008). Three behavioral factors were related to a greater risk of mortality (smoking, binge drinking, and prescription medication use), and one factor, hours out of bed, was protective of mortality (i.e., associated with a lower risk of mortality) (Krause, Carter, & Pickelsimer, 2009). Three psychological factors were significantly related to mortality (Krause, Carter, Zhai, & Reed, 2009): impulsive sensation seeking, neuroticism-anxiety, and the Purpose in Life scale (the first two factors were personality traits and the third a theoretical construct related to meaning in life). Two environmental factors, social support and income, were predictive of mortality (Krause & Carter, 2009). The seven factors in bold were statistically significant when all factors were included simultaneously (Krause, Zhai, Saunders, & Carter, 2009).
Although the research findings are generally consistent with the model, it is particularly noteworthy that income remains statistically significant even after accounting for all other predictors. Income clearly should not have a direct effect on mortality but should be significant by virtue of its relationship with other variables, such as the ability to purchase needed equipment and services related to maintaining health. The fact that it remains statistically significant after inclusion of the other predictors suggests the variables utilized in the study do not fully account for its importance. So how important then is income to survival and LE?
Economic Factors and LE
Few studies have investigated the role of economic factors and mortality after SCI onset. In an early analysis of data from the aforementioned study of 1386 participants, we found that compared to those in the lowest income category (< $25,000), those who reported household income of $75,000 or greater were 4.5 times more likely to survive the follow-up interval of four years (Krause, 2002). Although this establishes the importance of household income with mortality, the odds ratios were not translated into LE.
In an analysis of data from the NSCISC, Krause, DeVivo, and Jackson (2004) identified the relationship of multiple sets of predictors, categorized according to the aforementioned theoretical risk model, in relation with risk of mortality and LE. Economic factors, including workers compensation insurance coverage and scores 75-100 on the Economic Self- Sufficiency Scale of the Craig Handicap Assessment Reporting Technique (CHART) were significantly related to mortality. They provided two examples where these findings were translated into LE estimates. In the first example, after controlling for other health and environmental factors, LE of a 25 year old increased from 34.5 to 41.2 years after accounting for a high Economic Self- Sufficiency score and worker’s compensation insurance (an increase from 64.8% to 80.6% of normal LE). The same example was assessed using a 50 year old, and LE increased from 16.1 to 19.4 years (an increase from 56.4% to 68.8% of normal LE).
Strauss, DeVivo, Shavelle, Brooks, and Paculdo (2008) later analyzed the data on economics using an augmented sample from the study by Krause et al. (2004). They replicated the methods, emphasizing the role of economic factors in LE and summarized their findings in a brief report. They found workers compensation was no longer significantly related to mortality and eliminated this from the equation. Because workers compensation was no longer statistically significant in relation to mortality and there was additional mortality, the overall LE, using the 25 year old example, only increased from 32.2 to 33.7 years (66% of normal). The authors concluded the association of economics with mortality was less than previously reported. Unfortunately, they did not report data on the other example, making it difficult to directly compare the studies. An updated analysis has been prepared using household income as a predictor, rather than the CHART subscale, but is not yet available (Krause, Saunders, DeVivo, unpublished data).
Perhaps the most critical issue in the aforementioned research was the measurement of economic factors via the CHART. The Economic Self- Sufficiency Scale ranges from 0 to 100, with a score of 50 being equivalent to poverty level after removal of out-of-pocket health care related expenses and after adjusting for family size. A score of 75 would be 50% above poverty-level income, and a score of 100 would be at least twice poverty-level income. In both of the studies using the NSCISC data, the CHART was broken down into three economic strata of scores less than 50, 50-75, and 75-100.
From the perspective of the life care plan, it is important to use proxy variables for economic factors that are sensitive to the magnitude of resources that may be available. Twice the poverty level is not a good proxy for the financial resources allocated within life care plans for medical needs or lost income. The highest income category from the aforementioned study by Krause (2002) was only $75,000 and greater. This is a better proxy variable than CHART scores, as it directly relates to income, yet it maintains a low ceiling, particularly within the context of money summarized in the life care plan.
Methods
Participants and Procedures
In order to evaluate the relative strength of the relationships between household income with mortality and LE, we have conducted statistical analysis of 1361 persons with SCI who participated in a study of outcomes after SCI. All were identified in the Southeastern United States through the Model SCI Systems catchment area, registry, and through outpatient records. All were adult participants who had traumatic SCI of at least one year duration.
After receiving approval from the institutional review board, participants were identified and first contacted by mail. The preliminary letter described the nature of the study and alerted participants that subsequent material would be forthcoming. Actual materials were sent four to five weeks later. Aggressive follow-up procedures were utilized to maximize participation, including two subsequent mailings to non-respondents and a follow-up telephone call. Participants were offered $20 in remuneration for completing the study materials and were made eligible for drawings totaling $1500. Data collection began July 1997 and ended April 1998. Out of 1,929 potential participants, 1,386 (72%) participated. For these analyses, we excluded 11 participants who had a questionable diagnosis of SCI, 11 participants who did not report a date of injury, and 3 persons who did not give information on their age, leaving 1,361 for analysis.
Mortality status was determined as of December 31, 2007 using the National Death Index (NDI), where information on decedents is housed in a centralized computer index. The NDI provides information on when and where the death occurred and up to 20 causes of death. Death records are available approximately 16 months after the conclusion of a given year.
Through the questionnaire administered between 1997-1998, data was collected on demographic (gender, age) and injury characteristics (C1-C4, Non-ambulatory; C5-C8, Non-ambulatory; Non-cervical, Non-ambulatory; Ambulatory regardless of level). Additionally, annual household income was reported using the levels: <$10,000, $10,000-14,999, $15,000-$19,999, $20,000-$24,999, $25,000-$34,999, $35,000-49,999, $50,000-74,999, and $75,000 or more.
Analyses
Two sets of data analyses were conducted. First, in order to simply convey the relationship between household income and mortality, we summarized the portion of deaths as a function of household income level.
In the next set of analyses, logistic regression with person-years was used to generate models relating the predictor variables with mortality. Using person-years enabled calculation of the probability of dying in any given year by treating each follow-up year for each person as a separate observation (i.e., the relationship of each characteristic with the probability of dying in that year). This method has been used previously in studies of mortality after SCI (Strauss, Shavelle, DeVivo, & Day, 2000). All persons not found deceased through NDI as of December 31, 2007 were assumed to be alive at that date. Hosmer-Lemeshow and global χ2 tests were used to assess goodness-of-fit of the model (Hosmer & Lemeshow, 2000). The C-statistic, measuring area under the Receiver Operating Characteristic curve, was used to assess discriminatory ability (Hosmer & Lemeshow, 2000). Life expectancies were calculated based on three age groups (20, 40, and 60 years), four groups based on injury severity, and three levels of income (High: >$75,000; Medium: $25,000-74,999; Low: < $25,000). The income levels represent collapsed categories to insure a sufficient number of cases in each group.
Results
Of participants, 43.6% had a cervical injury and were non-ambulatory, 34.8% had a non-cervical injury and were non-ambulatory, and 21.6% were ambulatory (regardless of injury level). Additionally, 74.1% were male. The average age was 41.3 years, and the average number of years since injury was 9.7 years. Nine percent of participants had high income (>$75,000) and 58.7% low income (<$25,000). A bachelor’s degree or higher was reported by 23.6%, 26.3% had some college or an associate’s degree, 31.0% had a high school degree or GED, and 19.1% had not completed a high school degree.
Figure 2 summarizes the basic relationship between household income and risk of mortality. It is apparent that risk of mortality decreases substantially with increasing income. The highest levels of mortality were in the lowest income groups, whereas the lowest levels of mortality were in the highest income groups. This relationship was statistically significant (χ2=17.95; p=0.0122). A linear trend line has been inserted to demonstrate the nature of the relationship (χ2=17.32; p=0.0155). The trend line suggests decreasing mortality with increasing income through the highest income level.
Figure 2.

Mortality percentage as a function of household income.
Table 1 summarizes the regression coefficients from the model. Age, injury severity, and income were significantly related with mortality. Education and gender were not significant after controlling for the other variables in the model. Persons with low income had 2.40 times the odds of mortality as persons with high income (95% CI: 1.41-4.13), and compared with high income, persons in the middle income group had 1.58 times the odds of mortality, although it was not significant (95% CI: 0.89-2.79). As expected, increasing age and increasing injury severity were associated with greater odds of mortality.
Table 1.
Summary table for the regression analysis of mortality.
| Demographic/Injury Characteristics | OR (95% CI) | p-value* |
|---|---|---|
| Gender | ||
| Male | 1.20 (0.90-1.61) | 0.2148 |
| Female | Reference | |
| Age | ||
| 18-34 | Reference | <.0001 |
| 35-39 | 1.63 (0.87-3.05) | |
| 40-44 | 3.06 (1.75-5.36) | |
| 45-49 | 3.19 (1.80-5.66) | |
| 50-54 | 4.23 (2.40-7.47) | |
| 55-59 | 5.19 (2.88-9.36) | |
| 60-64 | 8.57 (4.70-15.62) | |
| 65-69 | 8.79 (4.55-16.99) | |
| 70-74 | 18.74 (10.19-34.48) | |
| 75-79 | 23.27 (11.47-47.20) | |
| 80+ | 41.86 (20.82-84.14) | |
| Injury Severity | ||
| C1-C4 | 4.56 (2.93-7.10) | <.0001 |
| C5-C8 | 2.70 (1.79-4.07) | |
| Non-cervical | 2.67 (1.78-4.01) | |
| Ambulatory | Reference | |
| Years Post-Injury | ||
| 2-4 | 2.14 (1.11-4.31) | 0.1520 |
| 5-9 | 1.28 (0.91-1.79) | |
| 10-19 | Reference | |
| 20-29 | 1.02 (0.75-1.40) | |
| 30+ | 1.17 (0.72-1.90) | |
| Income | ||
| <$25,000 | 2.40 (1.41-4.13) | 0.0002 |
| $25,000-74,000 | 1.58 (0.89-2.79) | |
| $75,000+ | Reference |
Hosmer-Lemeshow goodness of fit: χ2=4.58, DF=8, p=0.8014; C-statistic= 0.749
Life expectancy varied substantially as a function of age, injury severity, and income. Table 2 details these relationships. From the table, it is possible to compare relative LE between different groups. For instance, the LE of those age 20 with high income ranges from 41.41 years for those in the most severe injury category to 59.11 for those who are ambulatory. However, when comparing those in the most severe group with high income to those who are ambulatory but have low income, LE estimates are much more similar (59.11, 50.14).
Table 2.
Life expectancy as a function of injury severity, age, and household income for a male.
| Injury Level | Income Level | Age
|
||
|---|---|---|---|---|
| 20 | 40 | 60 | ||
| U.S. | 56.1 | 37.6 | 20.7 | |
| C1-C4, Non-Ambulatory | High | 41.41 | 24.07 | 11.96 |
| Middle | 35.00 | 19.35 | 9.05 | |
| Low | 29.22 | 15.40 | 6.85 | |
|
| ||||
| Base* | 32.04 | 18.06 | 8.53 | |
| NSCIS† | 30.89 | 18.17 | 8.85 | |
|
| ||||
| C5-C8, Non-Ambulatory | High | 48.66 | 29.90 | 15.89 |
| Middle | 42.35 | 24.80 | 12.43 | |
| Low | 36.44 | 20.38 | 9.66 | |
|
| ||||
| Base* | 38.43 | 22.59 | 11.17 | |
| NSCIS† | 36.41 | 22.26 | 11.28 | |
|
| ||||
| Non-Cervical, Non-Ambulatory | High | 48.79 | 30.01 | 15.97 |
| Middle | 42.49 | 24.91 | 12.50 | |
| Low | 36.58 | 20.48 | 9.72 | |
|
| ||||
| Base* | 38.19 | 22.41 | 11.06 | |
| NSCIS† | 41.87 | 26.52 | 14.02 | |
|
| ||||
| Ambulatory | High | 59.11 | 38.35 | 22.38 |
| Middle | 55.02 | 35.57 | 19.85 | |
| Low | 50.14 | 30.17 | 16.78 | |
|
| ||||
| Base* | 51.94 | 33.37 | 18.37 | |
| NSCIS† | 49.55 | 32.79 | 18.33 | |
Base model does not account for income and uses data from 12,280 person years.
Base-NSCISC does not account for income and uses data from 305,861 person years from the National Spinal Cord Injury Statistical Center. The NSCISC data uses a somewhat different classification in that ambulatory status is replaced by ASIA-D, such that the first three injury severity categories are ASIA-A-C (corresponding to non-ambulatory in our analysis).
Table 3 is a further elaboration of the relative changes in LE as a function of the individual’s characteristics and income. In each case, the percentage of increase in LE is noted between those with low income and those with either middle or high income. Two things are apparent from this table. First, the magnitude of the percentage increase in LE between the three income levels is typically higher for those with the most severe SCI compared with those who are ambulatory. For instance, at age 20, among those who are ambulatory, there is a 17.9% increase in LE between low and high income, compared with a 41.7% difference between low and high income for those with more severe SCI (C1-C4, non-ambulatory). Second, the percentage increase in LE as a function of income is more profound at higher ages. For those with C1-C4 injuries (non-ambulatory), the percentage difference in LE increases from 41.7% at age 20, to 56.3% for those at age 40, and 74.6% of those at age 60.
Table 3.
Percentage of change in life expectancy from low income to middle and high income as a function of injury severity and age.
| Age | ||||
|---|---|---|---|---|
| Injury Level | Income Level | 20 | 40 | 60 |
| C1-C4, Non-Ambulatory | High | 41.7% | 56.3% | 74.6% |
| Middle | 19.8% | 25.6% | 32.1% | |
| C5-C8, Non-Ambulatory | High | 33.5% | 46.7% | 64.5% |
| Middle | 16.2% | 21.7% | 28.7% | |
| Non-Cervical, Non-Ambulatory | High | 33.4% | 46.5% | 64.3% |
| Middle | 16.2% | 21.6% | 28.6% | |
| Ambulatory | High | 17.9% | 27.1% | 33.4% |
| Middle | 9.7% | 17.9% | 18.3% | |
Life expectancy estimates also include those for the general population, our base estimates that do not account for income (i.e., no consideration of income), and independent estimates from the NSCISC using a similar, but not identical, classification of injury severity. As a result, the estimates are not directly comparable. Specifically, whereas we used ambulatory status as the definition of motor functional, ASIA D is the definition used in the NSCISC data. Therefore, those who were technically ASIA D, but not ambulatory, were classified according to the level of injury using our data (one of the three groups). Since most participants who were non-cervical and motor functional would be ambulatory, the majority of ASIA D participants who were non-ambulatory were likely in the C1-C4 and C5-C8 groups. Those who were not technically ASIA D in our sample but who were ambulatory were classified in the least severely injured ambulatory group. These were most likely non-cervical injuries. These differences in classification could account for the higher LE estimates in the base calculation using our data for the C1-C4, and C5-C8, as these groups likely included some ASIA D, and could also account for the higher base estimates in the final group that included ambulatory individuals only in our data, but all ASIA D with the NSCISC data. Similarly, this could account for the lower base estimates in our data for the non-cervical group, since all ambulatory participants were moved to the least severe category and compared with the ASIA D from the NSCISC.
Discussion
The analyses reported here provide compelling evidence for the strength of the relationship between income and mortality/LE. Should we be surprised? No, factors such as socioeconomic status and access to health care are powerful predictors of longevity in the general population (Lin et al., 2003; Rogot et al., 1992). Given the current evidence and that from other studies, this information needs to be used in LE estimates for life care planning.
How do we explain this relationship, and what are the implications for life care planning? First, from the perspective of the theoretical risk model, household income or other resources themselves should not be predictive of mortality, after consideration of other factors including health behaviors and health status/secondary conditions. For income to be related to mortality there must be some intervening variable or variables, such as differential access to resources required to prevent complications or maintain health or provide treatment under the circumstances in which health problems develop.
A Model for Income and Mortality
Figure 3 presents a refined model of how income may relate to resources and result in a diminished likelihood of mortality (i.e., increased LE). The factors in the elaborated model are organized within the theoretical risk model and therefore fully consistent with the model. The solid circles represent the relationships already identified. The broken circles represent new hypothetical constructs, and the broken lines represent hypothetical relationships that intervene between income and mortality. According to the elaboration, we would expect that income or economics is associated with access to resources, as well as intrinsic psychological factors, such as the reduced stress associated with low income and financial concerns. Clearly people with SCI who do not have sufficient resources to manage their health needs will experience more stressors than those who have the resources to meet such needs. At a behavioral level, individuals can use the resources to purchase needed equipment, services, and other tangibles that will allow them to maintain health. Although we are in the process of collecting more elaborate data that can be used to help us better understand factors related to access to services and service utilization, this data will not be available for years, so we must draw implications from the data currently available.
Figure 3.

Elaborated model of income and mortality, with additional theoretical constructs.
From the perspective of life care planning, the general relationship between income and LE is important to the extent that it is accounted for within the life care plan consistent with the findings related to economics. The underlying relationships do not need to be identified in order to apply general findings between income as a proxy for access to resources and LE. No suggestion is being made that life care planners are responsible for establishing LE or making economic calculations, as these estimates are typically made by experts qualified in this area. Nevertheless, the life care planner should remain cognizant of the importance of appropriate allocation of resources for both preventative and other medical services and the likely consequence of inadequate resources to maintain health and longevity. In other words, although the life care planner will not be responsible for making the LE estimate (unless qualified in this area), she/he should understand the factors that go into the estimate and understand that data suggests having favorable economics will likely promote greater longevity.
Limitations
There are several limitations in our current state of knowledge. First, with regards to the overall field, we have been limited to proxy variables of economic status. Optimally, we would have much more detailed information on different types of income sources, particularly those resulting from the life care planning process, as well as an assessment of the actual resources that have accompanied differential levels of income. Second, there is an absence of large-scale data sets from which to calculate LE after SCI onset. Although the NSCISC data has been widely used and represents collected data from a system of nationally recognized hospitals, it has limited data on variables beyond biographic and injury factors and has not been widely used to investigate the role of other factors in mortality. When it has been used for this purpose, the data are a subset of the overall cases and are comprised of those collected during a certain period of time when more elaborate data/variables were used. Third, the data are left censored, and there was selective response (i.e., not everybody participated). Left censoring results from enrollment of a cross-sectional cohort well after onset of SCI. This results in an unknown number of deaths occurring prior to enrollment and data collection. In the current study, this limits our ability to definitively identify LE, given that we cannot quantify the bias and adjust estimates accordingly. We simply do not know the effect of left truncation of LE estimates. However, the relative comparisons as a function of participant characteristics would not likely be as influenced by truncation. Also, our estimates are relatively close to those using NSCISC data or at least for some injury severity categories. Fourth, the sample size was relatively small for a mortality study, and this limited our statistical power to identify significant relationships. For instance, although the univariate comparison of mortality and income was significant, in the regression analysis, the odds ratio between middle and high income was not significant. This is true even though the value (1.58) was nearly identical to that observed with NSCISC data (1.61) using similar statistical controls (unpublished data). Fifth, it takes population data to fully understand population parameters such as LE. Epidemiologic studies are carried out using surveillance systems or registries in a given area, generally a particular region, such as one of the 50 states. Population data reflects all cases from a given region which contrasts dramatically from clinical data where participants are identified in a clinical setting, such as a regional hospital. Enrollment through clinical settings adds highly significant biases that may reflect admission policies, insurance coverage, geographic distance, and other select factors. Therefore, clinical data, including that used in the current study and that used in the Model SCI Systems, falls short of population data. Lastly, LE estimates for those with the least severe SCI who are in the highest income group actually exceed those of the general population. Although the LE estimates of individuals with high income in the general population are higher than the overall estimates, provided they do not consider economic factors, this almost certainly reflects some unknown factors in the data or estimation method.
In summary, given the study limitations, we do not recommend using the LE estimate examples provided in this manuscript for individual life care plans. However, the relative comparisons, such as the relative differences between low, middle, and high income (i.e. percentage added LE) are likely to be more stable, regardless of bias. This is because bias would most likely affect all estimates in a similar fashion (lead to an under or over estimation in all cases), whereas the relative differences in LE as a function of injury severity, income, or age are more likely to be valid.
Future Considerations
Although life care planners frequently use LE as the endpoint in the life care plan, stopping all resource allocation at that time, a better procedure would be to multiply the amount of funds allocated in each year by the probability of survival for that year. For instance, if the probability of survival were .95 for the first year, and the total projected costs were $100,000, the resulting value would be $95,000. Rather than stopping at the projected LE, which is the point where the probability of survival dips below 50%, this procedure would be continued until the probability of survival is essentially zero. That way, should the individual survive longer than the LE and accrue expenses at a faster rate due to aging and health decline, this would be reflected in the life care plan. The fundamental point is LE is a probability, and using LE as the endpoint assumes the person will die at that time.
Conclusions
Prediction of LE for the life care plan is a complex task. Although age and injury severity are important considerations, they represent a starting point rather than concluding point. Additional factors are critical to the prediction. Income is an important proxy factor that is present in nearly all life care plans, at least those cases where litigation is successful. Other factors, such as psychological and environmental characteristics, health behaviors, and overall health are also important in the prediction. However, these are much more difficult to consider in LE estimates for life care plans, as these typically need to be determined shortly after injury and it often takes several years for many of these parameters to stabilize. Life care planners must use the best available information with all aspects of their life care plan, including LE estimates typically provided by experts, and that includes attention to economic factors. As research continues to unravel the parameters of LE, estimates will become even more precise. It is only through a combination of research, education, and careful evaluation and planning that life care planners may develop the best possible care plans that fully encompass the needed resources for the individual to achieve the greatest longevity.
Acknowledgments
The contents of this publication were developed under grants from the Department of Education, NIDRR grant numbers H133N50022, H133G050165, and H133B090005. However, those contents do not necessarily represent the policy of the Department of Education, and you should not assume endorsement by the Federal Government.
This publication was made possible by Grant Number 1R01 NS 48117 from the National Institutes of Health. The content is solely the responsibility of the authors and does not necessarily represent the official views of the National Institutes of Health.
The authors would like to thank Dr. Michael DeVivo for his review of portions related to the NSCISC data and more generally to the manuscript itself.
Biographies
James S. Krause, PhD, is the Associate Dean for Research and a Professor in the College of Health Professions at the Medical University of South Carolina. Dr. Krause has extensive experience with SCI outcomes research including the areas of employment, psychological status, aging, secondary health conditions, and mortality.
Lee L. Saunders, PhD, is a Research Assistant Professor in the College of Health Professions at the Medical University of South Carolina. Dr. Saunders is an epidemiologist who is focused in the areas of SCI and TBI.
References
- Hosmer DW, Lemeshow S. Applied logistic regression. 2. New York, New York: John Wiley and Sons; 2000. [Google Scholar]
- Krause JS. Secondary conditions and spinal cord injury: A model for prediction and prevention. Topics in Spinal Cord Injury Rehabilitation. 1996;2:217–227. [Google Scholar]
- Krause JS. Accuracy of life expectancy estimates in life care plans: Consideration of non-biographical and injury related factors. Topics in Spinal Cord Injury Rehabilitation. 2002;7:59–68. [Google Scholar]
- Krause JS, Carter R, Zhai Y, Reed K. Psychologic factors and risk of mortality after spinal cord injury. Archives of Physical Medicine and Rehabilitation. 2009;90:628–633. doi: 10.1016/j.apmr.2008.10.014. [DOI] [PMC free article] [PubMed] [Google Scholar]
- Krause JS, Carter RE. Risk of mortality after spinal cord injury: Relationship with social support, education, and income. Spinal Cord. 2009;47(8):592–596. doi: 10.1038/sc.2009.15. [DOI] [PMC free article] [PubMed] [Google Scholar]
- Krause JS, Carter RE, Pickelsimer E. Behavioral risk factors of mortality after spinal cord injury. Archives of Physical Medicine and Rehabilitation. 2009;90:95–101. doi: 10.1016/j.apmr.2008.07.012. [DOI] [PMC free article] [PubMed] [Google Scholar]
- Krause JS, Carter RE, Pickelsimer E, Wilson D. A prospective study of health and risk of mortality after spinal cord injury. Archives of Physical Medicine and Rehabilitation. 2008;89:1482–1491. doi: 10.1016/j.apmr.2007.11.062. [DOI] [PMC free article] [PubMed] [Google Scholar]
- Krause JS, DeVivo MJ, Jackson AB. Health status, community integration, and economic risk factors for mortality after spinal cord injury. Archives of Physical Medicine and Rehabilitation. 2004;85:1764–1773. doi: 10.1016/j.apmr.2004.06.062. [DOI] [PubMed] [Google Scholar]
- Krause JS, Zhai Y, Saunders LL, Carter RE. Risk of mortality after spinal cord injury: An 8-year prospective study. Archives of Physical Medicine and Rehabilitation. 2009;90:1708–1715. doi: 10.1016/j.apmr.2009.04.020. [DOI] [PMC free article] [PubMed] [Google Scholar]
- Lin CC, Rogot E, Johnson NJ, Sorlie PD, Arias E. A further study of life expectancy by socioeconomic factors in the National Longitudinal Mortality Study. Ethnicity and Disease. 2003;13:240–247. [PubMed] [Google Scholar]
- Rogot E, Sorlie PD, Johnson NJ. Life expectancy by employment status, income, and education in the National Longitudinal Mortality Study. Public Health Report. 1992;107:457–461. [PMC free article] [PubMed] [Google Scholar]
- Spinal Cord Injury Facts and Figures at a Glance. 2009 Retrieved July 14, 2009, from http://images.main.uab.edu/spinalcord/pdffiles/FactsApr09.pdf.
- Strauss D, DeVivo M, Shavelle R, Brooks J, Paculdo D. Economic factors and longevity in spinal cord injury: A reappraisal. Archives of Physical Medicine and Rehabilitation. 2008;89:572–574. doi: 10.1016/j.apmr.2007.11.025. [DOI] [PubMed] [Google Scholar]
- Strauss D, Shavelle R, DeVivo MJ, Day S. An analytic method for longitudinal mortality studies. Journal of Insurance Medicine. 2000;32:217–225. [PubMed] [Google Scholar]