Abstract
Signal transducer and activator of transcription (STAT) 3 regulates many cardinal features of cancer including cancer cell growth, apoptosis resistance, DNA damage response, metastasis, immune escape, tumor angiogenesis, the Warburg effect, and oncogene addiction and has been validated as a drug target for cancer therapy. Several strategies have been employed to identify agents that target Stat3 in breast cancer but none has yet entered into clinical use. We used a high-throughput fluorescence microscopy search strategy to identify compounds in a drug-repositioning library (Prestwick library) that block ligand-induced nuclear translocation of Stat3 and identified piperlongumine (PL), a natural product isolated from the fruit of the pepper Piper longum. Piperlongumine inhibited Stat3 nuclear translocation, inhibited ligand-induced and constitutive Stat3 phosphorylation, and modulated expression of multiple Stat3-regulated genes. Surface plasmon resonance assay revealed that piperlongumine directly inhibited binding of Stat3 to its phosphotyrosyl (pY) peptide ligand. Phosphoprotein antibody array analysis revealed that PL does not modulate kinases known to activate Stat3 such as JAKs, Src kinase family members, or RTKs. PL inhibited anchorage-independent and anchorage-dependent growth of multiple breast cancer cell lines having increased pStat3 or total Stat3, and induced apoptosis. PL also inhibited mammosphere formation by tumor cells from patient derived xenografts (PDX). PL’s anti-tumorigenic function was causally linked to its Stat3-inhibitory effect. PL was non-toxic in mice up to a dose of 30 mg/Kg/day for 14 days and caused regression of breast cancer cell line xenografts in nude mice. Thus, PL represents a promising new agent for rapid entry into the clinic for use in treating breast cancer, as well as other cancers in which Stat3 plays a role.
Keywords: Stat3, Piperlongumine, Breast Cancer, Drug repositioning, High throughput
INTRODUCTION
Signal transducer and activator of transcription 3 (Stat3) is a member of a family of seven closely related proteins responsible for transmission of peptide hormone signals from the extracellular surface of cells to the nucleus 1. Stat3 was subsequently demonstrated to be a master regulator of several key hallmarks and enablers of cancer cells 2–5 including cell proliferation 6, resistance to apoptosis 7, metastasis 2, immune evasion 8, tumor angiogenesis 9, epithelial mesenchymal transition (EMT) 10, response to DNA damage 11, and the Warburg effect 12. In addition, Stat3 is a key mediator of oncogene addiction in several types of tumors 13. In breast cancer, Stat3 activity is increased in the self-renewing CD44+CD24− tumor initiating cell population where it contributes to cancer initiation, maintenance and relapse 14–16. Thus, Stat3 is an attractive target for anti-cancer drug development, including treatment for breast cancer.
Peptide hormone binding to growth factor or cytokine receptors 17, 18 causes receptor oligomerization and activation of intrinsic or receptor-associated tyrosine kinases, respectively. These activated kinases phosphorylate receptor tyrosine residues creating docking sites for recruitment of cytoplasmic Stat3 17, 18. Stat3 docks to receptor phosphotyrosyl (pY) peptide sites through its Src-homology (SH) 2 domain, which leads to its phosphorylation on Y705 followed by Stat3 tail-to-tail homodimerization (SH2 domain of each monomer binds the pY705 peptide domain of its partner). Stat3 homodimers accumulate in the nucleus, where they bind to specific Stat3 response elements in the promoter of target genes and regulate their transcription.
Stat3 activity is increased in ~50% of all cancers 19. While increased Stat3 activity in human cancers can result from naturally occurring Stat3 mutations, e.g. human inflammatory hepatocellular adenomas and large granular lymphocytic leukemia 20, 21, it more commonly results from activation of upstream receptor tyrosine-kinases (RTK), e.g. epidermal growth factor receptor (EGFR), or tyrosine-kinase associated receptors e.g. the family of IL-6–type (IL-6) cytokine receptors, or G-protein coupled receptors (GPCR) 17, 18, 22, 23. In addition, members of the Src kinase family such as Src, Lck, Hck, Lyn, Fyn, or Fgr can activate Stat3 either directly or downstream of an RTK or GPCR 22, 23.
Several small molecule drug-development programs have emerged directed at identifying drug-like compounds that target Stat3. These programs have targeted either the Stat3 homodimer or the Stat3 SH2 domain 24–27 While these programs have identified drug-like candidates that show activity in cell-based assays and pre-clinical cancer models, none has yet entered into clinical use.
In an effort to fill this clinical need, we employed a single-cell, high throughput fluorescent cell based assay to screen the Prestwick drug-repositioning chemical library for compounds with ability to block nuclear accumulation of ligand-activated GFP-Stat3. This screen identified piperlongumine (PL), an alkyl amide, and an active component of the long pepper (Piper longum) fruit, used for centuries in Ayurvedic medicine to treat a variety of illnesses including stomach ulcers, tumors and circulatory problems. PL inhibited Stat3 cytoplasmic-to-nuclear translocation and ligand-mediated activation of Stat3 phosphorylation and reduced constitutive Stat3 phosphorylation in breast cancer cell lines, mediating its effect by inhibiting Stat3 binding to its pY-peptide ligand. PL reduced levels of Stat3 target genes in breast cancer cells, inhibited anchorage-dependent and independent growth of breast cancer cells, inhibited mammosphere formation by patient-derived human breast cancer xenografts that expressed moderate-to-high levels of constitutively activated Stat3, and inhibited growth of breast cancer line xenograft tumors in nude mice. Thus, PL represents a promising new agent for potential hit-to-lead development and rapid entry into the clinic for use in treating breast cancer, as well as other cancers in which Stat3 plays a role.
RESULTS
HTFM screening of the Prestwick chemical library identified piperlongumine as a potent inhibitor of ligand-stimulated Stat3 nuclear translocation
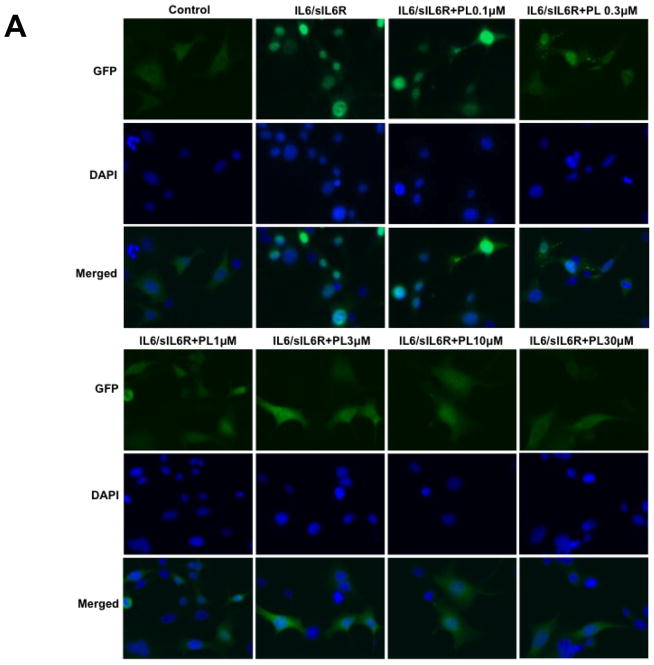
Screening of the Prestwick chemical library identified 6 compounds that inhibited Stat3α nuclear translocation. Out of these, three were cytotoxic drugs used in chemotherapy; the other three were chrysene 1,4 quinone (IC50=10 μM), merbromin (IC50=10 μM), and piperlongumine (IC50=1.7 μM; Figure 1A, 1C and Table 1), Chrysene is a weakly carcinogenic polycyclic aromatic hydrocarbon 28. Merbromin/Mercurochrome is an organomercuric disodium salt. Piperlongumine is an alkyl amide isolated from the long pepper (Piper longum) fruit, which has been used for centuries in Ayurvedic medicine to treat a variety of illnesses including stomach ulcers, tumors and circulatory problems.
Figure 1.
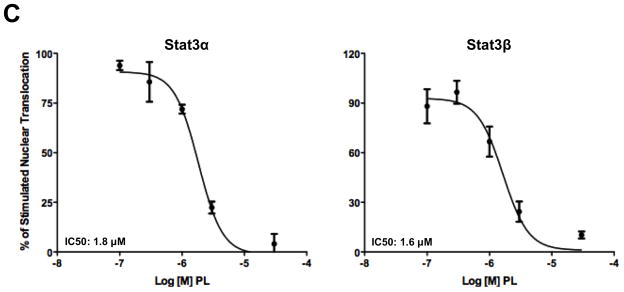
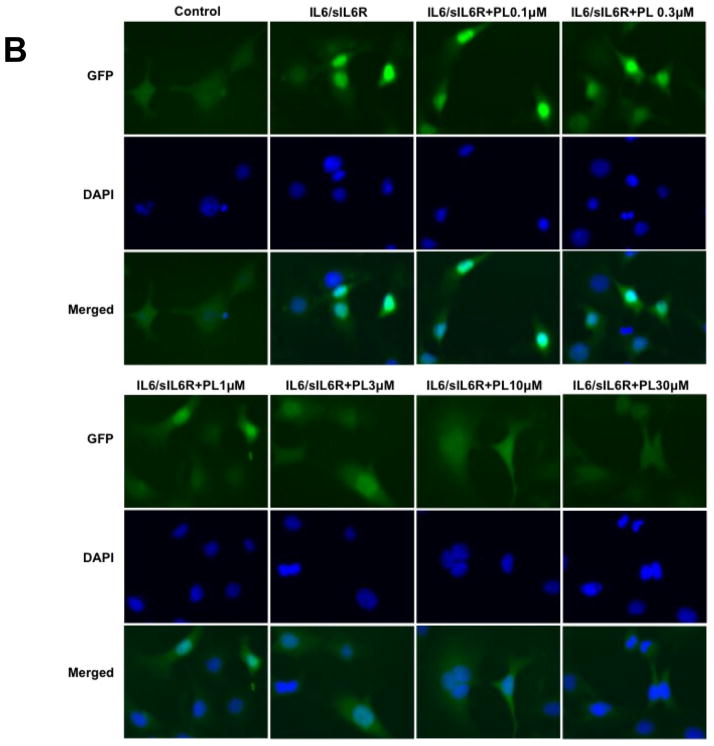
Piperlongumine inhibits cytoplasmic-to-nuclear translocation of Stat3 assessed by confocal and high-throughput fluorescence microscopy (HTFM). A, B. MEF/GFP-Stat3α (A) or MEF/GFP-Stat3β (B) cells were pretreated with vehicle control (DMSO; column 2) or (0.1/0.3/1/3/10/30/100 μM) of PL (columns 3–8) for 1 hour and stimulated without (column 1) or with IL-6 + IL-6sR (150 ng/ml) for 30′ (columns 2–8). Plates were examined by confocal fluorescent microscopy using filters to detect GFP (row 1), DAPI (row 2) or both (merge; row 3). C. MEF-GFP-Stat3α (left) or MEF-GFP-Stat3β (right) cells, treated as above, fixed and examined by HTFM to determine the fluorescence intensity in the nucleus (FLIN). Percent of maximum change (delta, D) in FLIN was plotted as a function of Log [M] PL. Data shown (mean ± SD) representative of ≥ 2 experiments. Best-fit curves were determined and IC50 values determined (Table 1) using 4-Parameter Logistic Model/Dose Response using GraphPad
Table 1.
Summary of Piperlongumine activities
| Function/Parameter | IC50 (Mean ± SEM, n ≥ 2) |
|---|---|
| Nuclear translocation | |
| GFP-Stat3α | 1.7 ± 1.1 |
| GFP-Stat3β | 0.9 ± 0.6 |
| G-CSF stimulated Stat3 phosphorylation | 3.7 ± 1.7 |
| Constitutive Stat3 phosphorylation | |
| MDA-MB 231 | 0.4 ± 0.5 |
| MDA-MB 468 | 2.8 ± 2.1 |
| IL6/sIL6R stimulated Stat3 phosphorylation | |
| MCF-7 | 0.9 * |
| MDA-MB-453 | 0.9 * |
| T47D | 2.7 * |
| Stat3 Binding to pY peptide | 1.5 ± 0.8 (Ki= 68 nM) |
| Anchorage independent growth (MTT) | |
| MDA-MB 231 | 1.2 ± 1.8 |
| MDA-MB 468 | 4.6 ± 4.8 |
| Hs 578T | 0.2 ± 0.1 |
| Anchorage dependent growth (MTT) | |
| MDA-MB 231 | 3.4 ± 2.8 |
| MDA-MB 468 | 4.2 ± 0.9 |
| Hs 578T | 3.0 ± 5.0 |
| Mammosphere assay | |
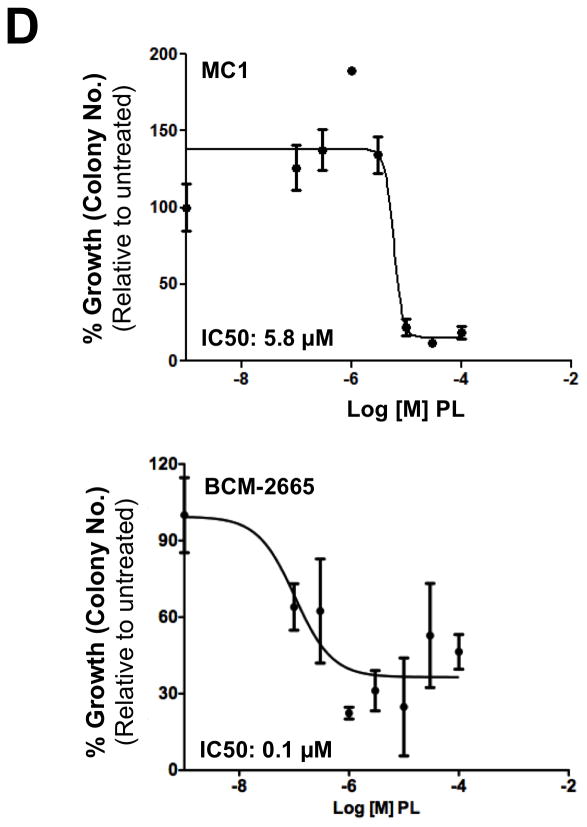
| MC1 | 4.2 ± 2.3 |
| BCM-2665 | 0.1 ± 0.0 |
All values showed in μM, except Ki (inhibition constant) for inhibition of Stat3 binding to pY peptide
These experiments were done once
Two isoforms of Stat3 (α/p92 and β/p83), resulting from alternative splicing, are present within cells at a 4:1 ratio 29. We previously demonstrated that both isoforms exhibited similar dynamics of nuclear accumulation in MEF cells following stimulation with IL-6/sIL-6Rα 30. To determine if PL inhibited nuclear translocation of Stat3β in addition to Stat3α, we used stably expressing MEF/GFP-Stat3β in HTFM assay. PL blocked ligand-induced nuclear translocation of GFP-Stat3β cells with an IC50 similar to that in GFP-Stat3α cells (IC50 = 0.9 ± 0.6 μM; Figure 1B and 1C; Table 1).
Piperlongumine inhibits ligand-stimulated phosphorylation of Stat3 in the myeloid leukemia cell line, Kasumi-1, and in breast cancer cell lines, and rapidly decreases constitutive phosphorylation of Stat3 in breast cancer cell lines through inhibition of Stat3 binding to its pY-peptide ligand
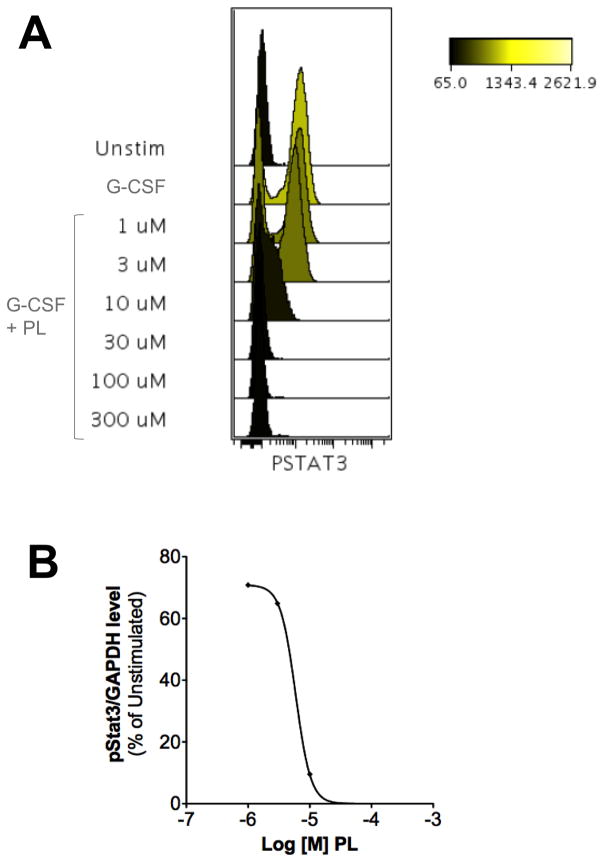
Nuclear accumulation of Stat3 is facilitated by its phosphorylation on Y705. To assess if PL inhibited ligand-mediated Stat3 phosphorylation, we examined the ability of PL to inhibit G-CSF-induced Stat3 phosphorylation of the myeloid leukemia cell line, Kasumi-1, by phosphoflow. PL potently inhibited G-CSF-induced Stat3 phosphorylation (IC50 = 3.7 ± 1.7 μM; Figure 2 and Table 1).
Figure 2.
Piperlongumine inhibits ligand-induced Stat3 phosphorylation in Kasumi1 cells. Serum-starved (1 hour) Kasumi-1 cells, pre-incubated with PL/DMSO (1 hour), were treated with G-CSF (10 ng/ml, 15′). Cells were permeabilized and stained with Alexa647-pStat3, and analyzed on BD LSR2. FCS files were uploaded to Cytobank for pStat3 quantitation. Histograms depicting pStat3 levels (A) are shown. These mean fluorescence (pStat3) levels were plotted as function of the Log [M] PL, and IC50 calculated using GraphPad. 2B shows IC50 curve from representative experiment.
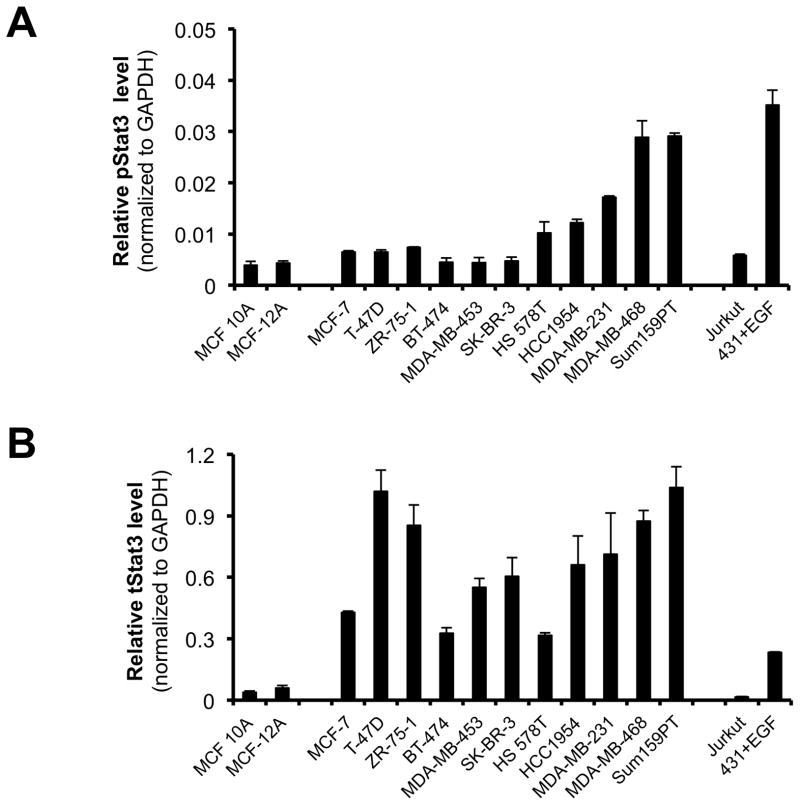
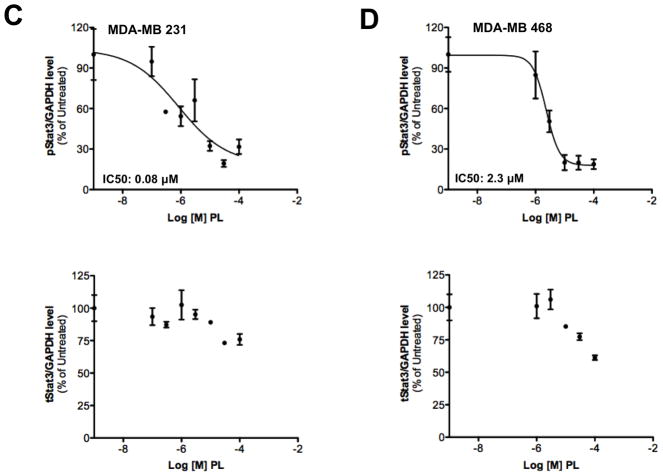
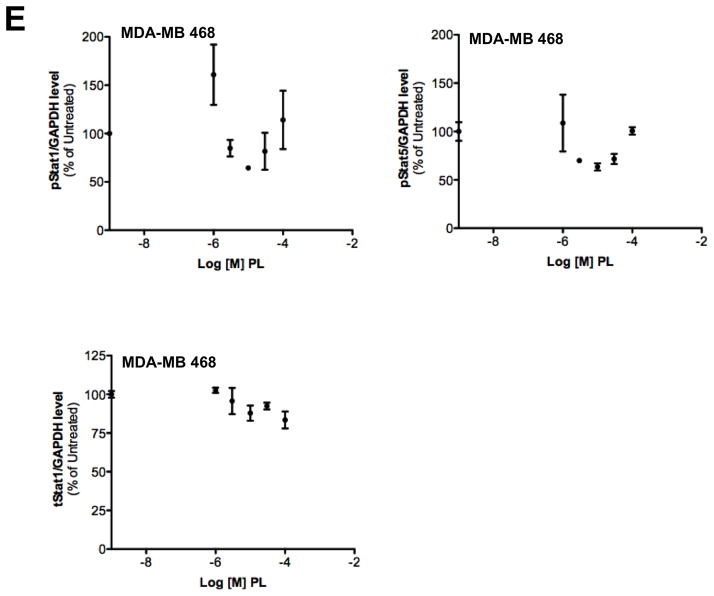
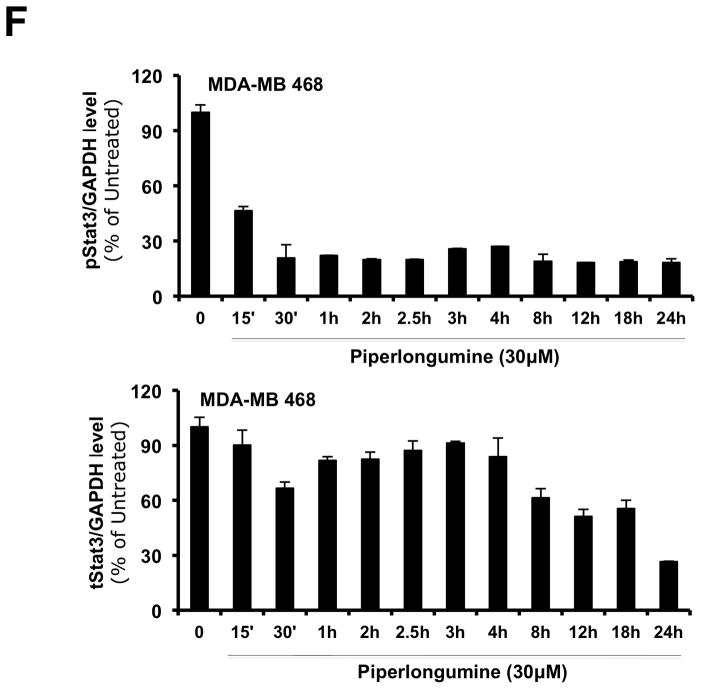
Stat3 is constitutively phosphorylated in multiple cancers, including breast cancer2. We examined levels of pStat3 in a panel of breast cell lines (Figure 3A). The non-tumorigenic epithelial breast cell lines (MCF-10A and MCF-12A) and six breast cancer cell lines (MCF-7, T47D, ZR-75-1, BT-474, MDA-MB 453 and SK-BR-3) had low levels of pStat3 while five cell lines (Hs578T, HCC-1954, MDA-MB-231, MDA-MB-468 and Sum159PT) had high pStat3 levels. PL treatment of two of the breast cancer cell lines with high constitutive levels of pStat3, MDA-MB-231 and MDA-MB-468, for 1.5 hr reduced pStat3 levels in each by >70% (Figure 3C, D and Table 1; IC50=0.4–2.8 μM) without substantially affecting levels of total Stat3 or pStat1, pStat5 and total Stat1 (Figure 3E). To determine the kinetics of reduction of constitutive pStat3 by PL, we treated MDA-MB-468 cells with PL (30 μM) for 15′ - 24 hrs and determined pStat3, total Stat3, and GAPDH (Figure 3F). Levels of pStat3 were reduced by >50% as early as 15 min and maximally reduced by 30 min.
Figure 3.

Piperlongumine inhibits constitutive and ligand-stimulated Stat3 activation in multiple breast cancer cell lines. Whole protein from MCF-10A, MCF-12A, MCF-7, T47D, ZR-75-1, BT-474, MDA-MB 453, Hs578T, HCC1954, MDA-MB-231, MDA-MB-468, and Sum159PT cells were assayed for pStat3/tStat3/GAPDH protein by Luminex. GAPDH-normalized pStat3 (± SD, A) and tStat3 (B) are shown along Y-axis. (C, D). Whole proteins from MDA-MB-231 (C) and MDA-MB-468 (D) cells, treated with PL (0/0.1/0.3/1/3/10/100 μM, 2.5 hrs) were assayed for pStat3/tStat3/GAPDH by Luminex. GAPDH-normalized pStat3 values were divided by that for untreated cells and expressed in percentage. These values were plotted as a function of Log [M] PL, and IC50 values calculated using GraphPad. Upper panel shows pStat3 data from representative experiments from each cell line. GAPDH-normalized total Stat3 from each treatment was similarly calculated and shown in the lower panel graphs. E. Whole proteins from MDA-MB-468 cells treated as in (D), were assayed for pStat1, pStat5, and total Stat1 and GAPDH. Upper panel (E) shows relative pStat1, pStat5 values and lower panel (E) shows total Stat1 values. F. Whole protein collected from MDA-MB-468 cells treated with 30 μM piperlongumine for indicated times were assayed for pStat3, total Stat3, and GAPDH using Luminex. GAPDH-normalized pStat3 (upper panel) or total Stat3 (lower panel) values (± SD) are shown along Y-axis. G. MCF7, MDA-MB-453 and T47D cells, were serum-starved (1hr), pre-treated with PL or DMSO (0/0.1/0.3/1/3/10/100 μM, 2hrs) and then stimulated with IL6/sIL6R (150ng/ml, 15′). Whole protein was extracted and pStat3, and GAPDH levels were determined by Luminex. GAPDH-normalized pStat3 values were divided by that for IL6/sIL6R-stimulated cells and expressed in percentage. These values were plotted as a function of Log [M] PL, and IC50 values calculated using GraphPad.
We also tested PL’s effect Stat3 phosphorylation induced by IL-6 plus sIL-6Rα in three pStat3-low breast cancer cell lines MCF7, MDA-MB-453 and T47D (Figure 3G). IL-6/sIL6Rα treatment (@ 150ng/ml for 20 minutes) increased the pStat3 levels by 6.8, 14.9 and 26.6 fold in MCF-7, MDA-MB-453 and T47D cells, respectively (data not shown). PL pre-treatment for 2 hours completely blocked the ability of IL6/sIL6R to stimulate Stat3 phosphorylation in MCF-7 (IC50 = 0.9 μM; Figure 3G and Table 1), MDA-MB-453 (IC50 = 0.9 μM; Figure 3G and Table 1) and T-47D cells (IC50 = 2.7 μM; Figure 3G and Table 1).
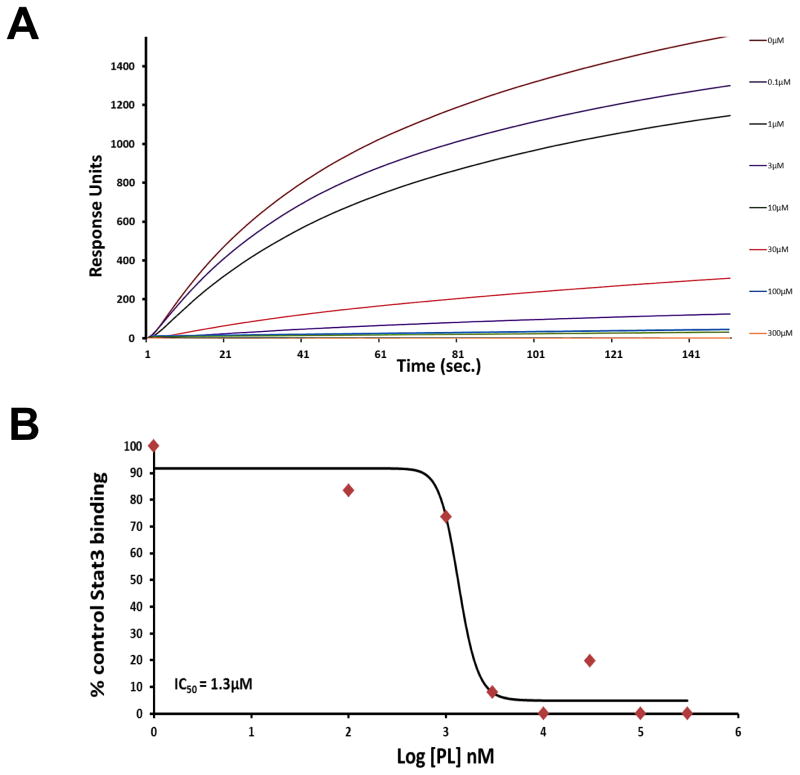
To determine the mechanism by which PL inhibits ligand-induced and constitutive phosphorylation of Stat3, we tested PL for its ability to inhibit Stat3 binding to its phosphopeptide ligand in a surface plasmon resonance (SPR)-based binding assay 27. PL potently inhibited Stat3 binding to its pY-peptide ligand with an IC50 = 1.5 μM (Figure 4, Table 1) which, using the Cheng-Prussoff equation, converts to a Ki of 68 nM.
Figure 4.
Inhibition of Stat3 binding to immobilized phosphopeptide ligand by piperlongumine. Binding of recombinant Stat3 (200 nM) to a Biacore sensor chip coated with a phosphododecapeptide (amino acids surrounding Y1068 within EGFR) was measured in real time by SPR in the absence (0 μM) or presence of piperlongumine (0.1 to 1,000 μM). Panel A shows resonance units as a function of time in seconds. In panel B, the equilibrium binding levels obtained ± piperlongumine were normalized (resonance obtained in the presence of compound ÷ the response obtained in the absence of compound × 100) and plotted against Log [nM] PL and IC50 value calculated.
Piperlongumine alters expression of multiple Stat3-regulated genes important for oncogenesis
To assess if the effects of PL on Stat3 extend to modulation of Stat3-regulated genes, we examined mRNA levels of 51 known Stat3-regulated gene targets (Supplemental Tables 2 and 3) by real time PCR in MDA-MB-468 cells treated with PL (30 μM, 6–8 hours). PL significantly down-regulated genes encoding cell cycle and apoptosis resistance proteins, mitochondrial proteins, and oxidative stress defense proteins (Supplemental Tables 2 and 3). Out of the 46 genes that had detectable mRNA (threshold cycle < 30), 21 (46%) genes had significantly altered expression (6 hrs) groups. Notably, PL affected 6/9 (67%), apoptosis-related genes, including the anti-apoptotic genes Bcl-2, BcL-xL, Survivin, XIAP, and CIAP. Treatment for 8 hrs increased the number of Stat3 gene targets affected by PL to 28/46 (61%) and increased the degree of PL-induced changes (Bcl-2 from 15% to 20%; Survivin/XIAP from 30% to 40%; CIAP/BcL-xL from 50–60% to 70%). Conversely, PUMA, a pro-apoptotic, BH3-only member of the Bcl-2 family shown to be upregulated by p53, was highly upregulated by PL both at 6h (~4 fold, p < 0.005, Supplemental Table 2) as well as 8h (~5 fold, p < 0.01); this result may have been anticipated as previous reports showed that Stat3 antagonizes the transcriptional activities of p53 31. Thus, the inhibitory effect of PL on Stat3 phosphorylation and nuclear translocation was accompanied by dramatic modulation in Stat3-regulated gene expression in breast cancer cells.
Piperlongumine inhibits anchorage-independent and anchorage-dependent growth of breast cancer cell lines and results in cell apoptosis
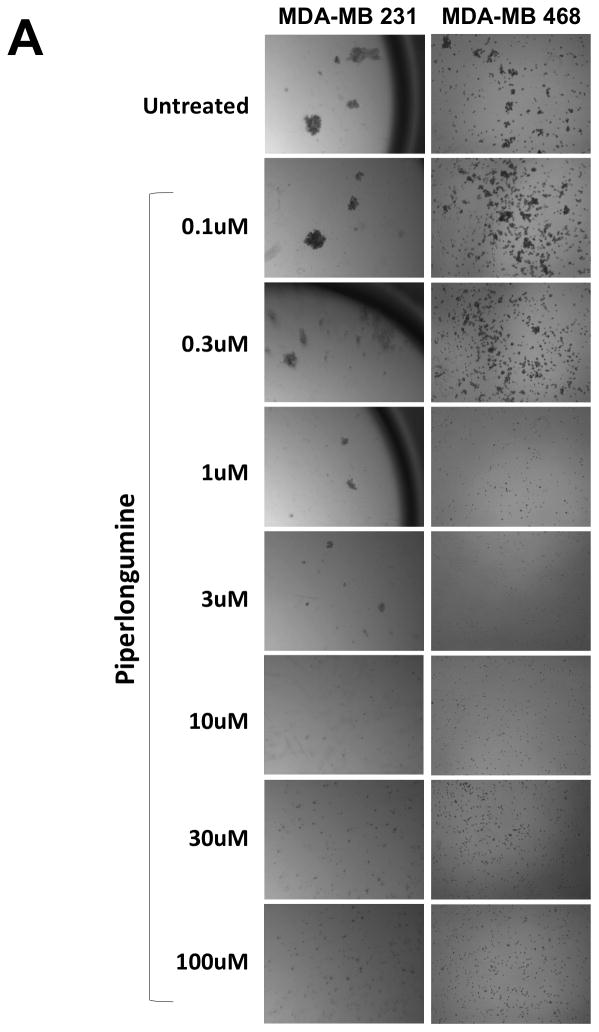
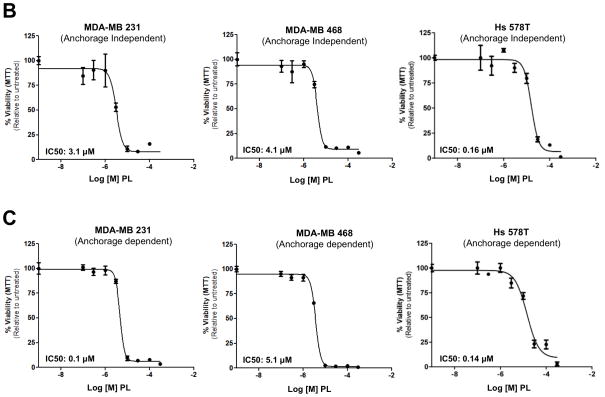
Previous reports indicated that breast cancer cell lines (MDA-MB-231, MDA-MB-468 and Hs578) depend on Stat3 for growth and/or survival 15, 32. To determine the effect of PL on their growth, cells were incubated without or with PL for 24–48hr and assessed for anchorage- independent and anchorage-dependent growth (Figure 5). The ability of epithelial cancer cells to grow under anchorage-independent conditions (i.e. in ultra-low attachment plates) is indicative of multiple tumorigenic properties e.g. survival, growth, anoikis resistance and hence closely approximates their tumor forming ability 33. PL potently inhibited both anchorage-independent (Figure 5A and B; Table 1) and anchorage-dependent growth (Figure 5C; Table 1) of MDA-MB-231 cells (IC50 = 1.2 and 3.4 μM, respectively), of MDA-MB-468 cells (IC50 = 4.6 and 4.2 μM, respectively) and of Hs 578T cells (IC50 = 0.2 and 3.0 μM, respectively).
Figure 5.
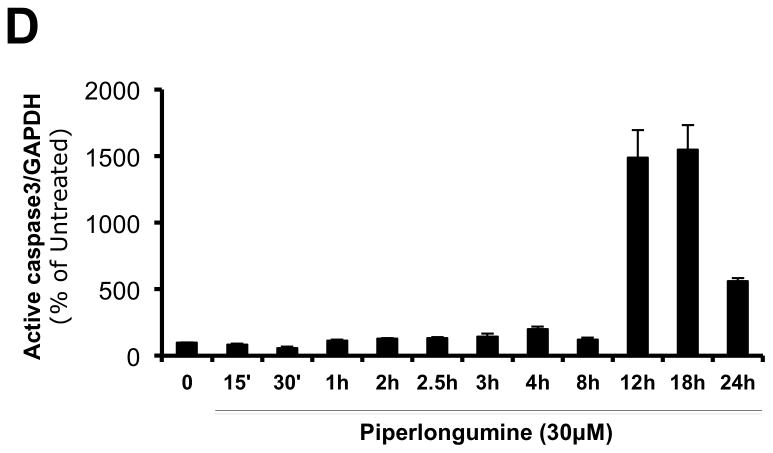
Piperlongumine blocks growth of breast cancer cell lines with activated Stat3 and induces apoptosis. A. MDA-MB-231 cells (left column) and MDA-MB-468 cells (right column) were treated in ultra-low attachment plates with complete media ± piperlongumine (0/0.1/0.3/1/3/10/100 μM, 72hrs) and photographed. Shown are representative wells for each treatment. B. Cells were treated as above and viable cells were quantitated using MTT. Relative % viability was measured by (viability after any treatment ÷ viability of untreated cells × 100) and plotted as a function of Log [M] PL, and IC50 values calculated using GraphPad. Data show representative experiments from ≥2 replicates. C. Piperlongumine blocks anchorage dependent growth of MDA-MB-231, MDA-MB-468 and Hs 578T cells. Cells were cultured for 24–48 hrs in complete DMEM with 10% FBS ± piperlongumine (0/0.1/0.3/1/3/10/100 μM) in cell-culture-treated 96-well plates. Viable cells quantitated using MTT. Relative % viability and IC50s were calculated as above. Data show representative experiments from ≥ 2 replicates. D. Proteins from MDA-MB-468 treated with 30μM PL (15′ - 24 hrs) were examined for cleaved caspase 3 and GAPDH by Luminex. GAPDH-normalized active caspase 3 values expressed as a percentage of the pre-treatment value (±SD) plotted along Y-axis.
To assess if PL induces apoptosis of breast cancer cells, MDA-MB-468 cells were incubated with PL (30μM) and sampled over time (15 min to 24 hrs) for measurement of cleaved caspase 3 (Figure 5D). Caspase 3 cleavage was first noted at 12 hrs, increasing ~12-fold compared to earlier time points, indicating that PL induces breast cancer cells to undergo apoptosis in a time-dependent manner.
Piperlongumine blocks mammosphere forming capacity of breast cancer cells isolated from patient-derived human breast cancer xenografts
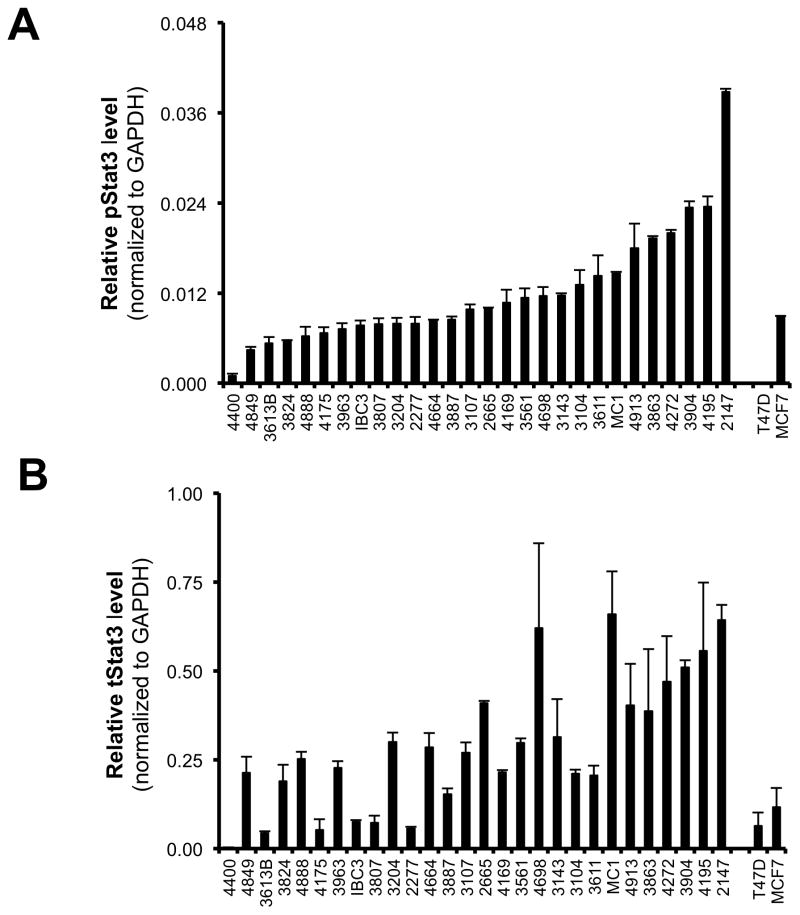
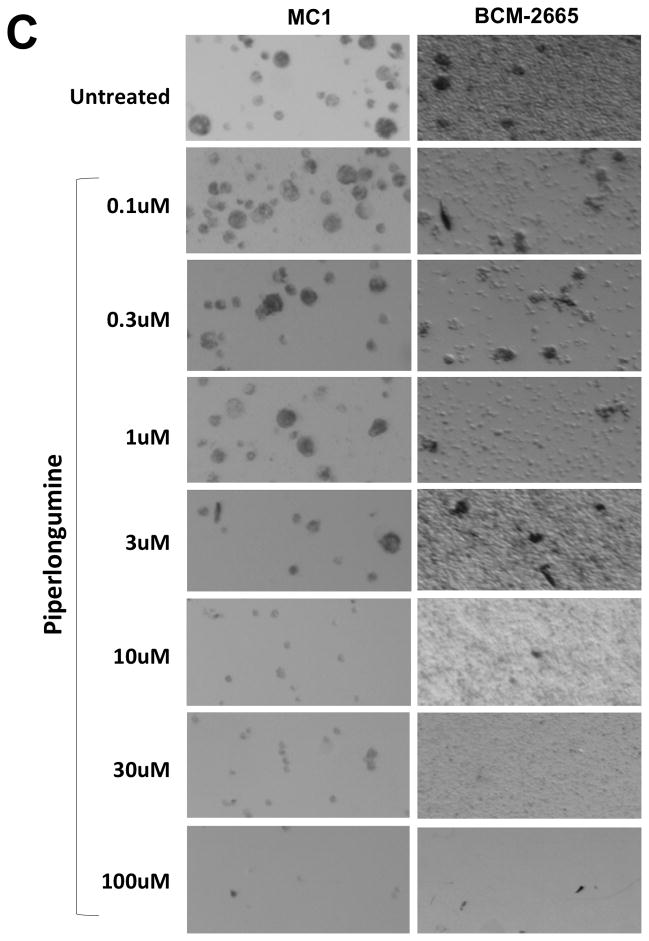
Previous reports demonstrated that Stat3 was activated within a subpopulation of breast cancer cells that have tumor-initiating characteristics, so called tumor-initiating cells (TIC) 15, including TIC described within breast cancer patient-derived xenografts (PDX) established from biopsies of patients and passaged in SCID/Beige mice 16, 34, 35. To examine the effect of PL on breast cancer PDX, we first determined pStat3-levels in 28 of them (Figure 6A). Levels of pStat3 in most PDX were higher than in T47D and MCF-7 tumor xenografts, which were generated in SCID/Beige mice from pStat3-low breast cancer cell lines. We examined whether PL inhibited the ability of single cell suspensions of two of these PDX, MC1 36 and BCM-2665, to form mammospheres, a well-described feature of TIC 15. PL inhibited mammosphere formation by both MC1 and BCM-2665 (IC50 = 4.2 and 0.1 μM respectively; Figure 6C and D; Table 1) suggesting it is capable of inhibiting Stat3 within breast cancer TIC.
Figure 6.
Piperlongumine blocks mammosphere forming ability of single cells isolated from patient-derived human breast cancer xenografts (PDX) serially transplanted and grown in SCID/Beige nude mice fat pad. A. Whole cell lysate from 28 snap-frozen tumor xenograft tissues (xenograft numbers are shown without the BCM-prefix) were tested for pStat3, tStat3, and GAPDH by Luminex. GAPDH-normalized pStat3 (A) and GAPDH-normalized total-Stat3 (B) ± SD, are shown along Y-axes. C. Single cells generated from two pStat3-positive xenografts (MC1 and BCM-2665) were grown for 5–7 days in serum-free, growth-factor-enriched conditions in low attachment 96 well plates ± piperlongumine (0/0.1/0.3/1/3/10/100 μM). Colonies (mammospheres) were photographed (C) and counted with an automated colony counter (Oxford Optronix, Oxford, UK). Relative % growth (number of mammospheres after any treatment ÷ number of mammospheres formed by untreated cells × 100) was plotted as function of Log [M] PL, and IC50 values calculated using GraphPad (D). Shown are data from representative experiments.
The ability of PL to inhibit Stat3 is linked to its ability to inhibit breast cancer cell growth
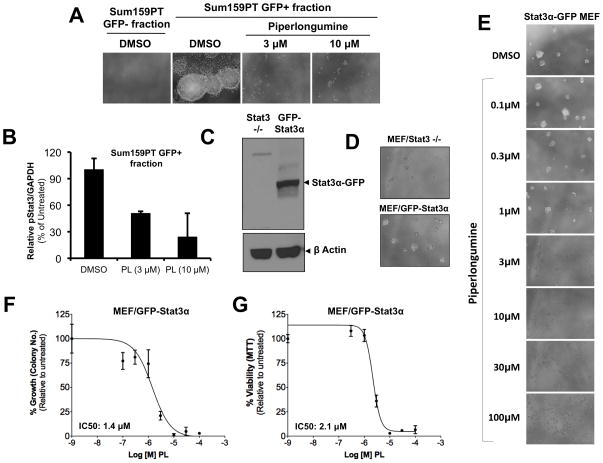
To examine the link between the specific anti-Stat3 activity of PL and its breast cancer cell growth inhibitory capabilities, we used two different model systems that demonstrate increased cancer cell functions as a direct consequence of increased Stat3 activity or expression. In the first one, we used a lentiviral reporter system (Wei et al, data communicated elsewhere) for detecting cells with high Stat3 activity. This system included the Stat3-GFP reporter (GFP under the control of four repeats of the M67 sequences, a high affinity variant of the Stat3 binding sequence from human c-fos promoter). The breast cancer cell line, SUM159PT was positive for reporter activity (reporter positivity defined by higher GFP intensity in Stat3-GFP transduced cells compared to TATA-GFP transduced cells), which matched with our findings regarding its pStat3 status (Figure 3A). SUM159PT cells transduced with the Stat3-GFP reporter were injected into pre-cleared mouse mammary gland of immunocompromised SCID/Beige mouse. Stat3-GFP infected Sum159 xenografts-derived cells with differential expression pattern of GFP were then FACS sorted into GFP+ and GFP− populations. The GFP+ cells (indicating high Stat3 transcriptional activity) formed mammospheres but the GFP− cells did not (Figure 7A). In presence of PL (3 and 10 μM) mammosphere formation by GFP+ cells was completely inhibited. Furthermore, treatment with PL decreased the pStat3 levels in the GFP+ cells in a dose-dependent manner (Fig 7B). Thus, PL inhibited endogenous Stat3-reporter activity and mammosphere growth by Stat3-active Sum159PT cells indicating a direct link between PL’s Stat3-inhibitory activity and its ability to inhibit breast cancer cell line growth.
Figure 7.
Piperlongumine inhibits Stat3-mediated oncogenic functions. A. SUM159PT cells transduced with a Stat3-GFP reporter (GFP under the control of four repeats of the M67 sequences, a high affinity variant of the Stat3 binding sequence from human c-fos promoter) were injected into pre-cleared mouse (SCID/Beige) mammary gland and grown as xenografts. A single-cell suspension of xenograft-derived cells with differential expression pattern of GFP were FACS sorted into GFP+ and GFP− populations and assayed for mammosphere formation efficiency (MSFE) in absence or presence of PL. Shown are pictures of colonies from representative wells. B. Sum159PT xenograft-derived GFP+ cells were treated with increasing doses of PL and levels of pStat3 and GAPDH measured by Luminex. GAPDH-normalized pStat3 values were divided by those for DMSO cells and expressed as a percentage and shown along the Y-axis. C. MEF/GFP-Stat3α cells (expressing GFP-Stat3α in a Stat3-null background) and Stat3−/− MEFs were examined for Stat3 expression (C) and tested for the ability to grow under anchorage-independent conditions (D). E. MEF/GFP-Stat3α cells were treated with increasing doses of PL and photographed. F. The mean number of colonies from duplicate wells for each treatment were counted, divided by the mean number in DMSO-treated cells and expressed as percentage. These values were plotted as a function of Log [M] PL, and IC50 values calculated using GraphPad. G. Relative % viability (viability after any treatment ÷ viability of DMSO-treated cells × 100) was measured using MTT assays and plotted as a function of Log [M] PL, and IC50 values calculated using GraphPad.
Our second model consisted of Stat3−/− MEF cells stably expressing GFP-Stat3α (Figure 7C), used in Figure 1 27, 37. Hedvat et al, using a similar YFP-tagged Stat3α stable transfectant of the original Stat3-null transformed MEF, showed that these YFP-Stat3 cells could form xenogenic tumor grafts after injection into mice whereas the Stat3−/− MEF cells could not form tumor grafts under identical conditions 38. As shown in Figure 7D, the Stat3α-GFP MEF cells formed much spheroid colonies under conditions of anchorage independence. PL inhibited the growth of these mammospheres (Figure 7E, F, IC50: 1.4 μM) with 3μM of PL completely abrogating spheroid colony formation by these cells. We also assessed the growth of Stat3α-GFP MEF cells and the inhibitory effect of PL using MTT assays, which also demonstrated increased growth of Stat3α-GFP MEF cells and the ability of PL to suppress their growth (Figure G, IC50=2.1 μM). Since this increased cell growth resulted from Stat3 expression, the ability of PL to suppress this growth directly supports the conclusion that PL suppressed Stat3-mediated oncogenic properties of these cells.
Piperlongumine treatment inhibits the growth of human breast cancer cell line xenografts by reducing levels of both pStat3 and Stat3-upregulated gene transcripts within tumors
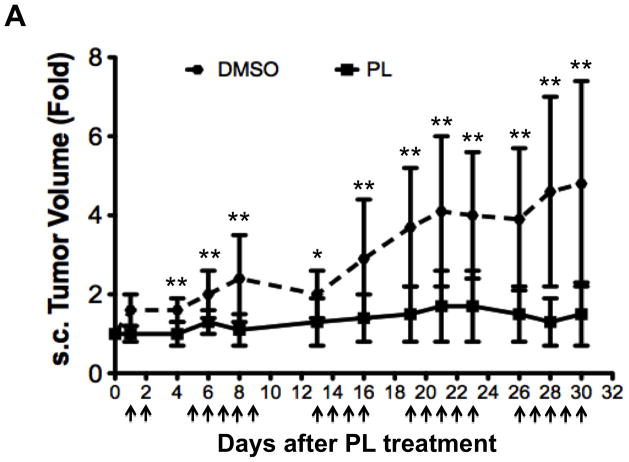
To test the ability of PL to inhibit growth of human breast cancer tumors in mice, PL (15 mg/Kg body weight/day) or DMSO (vehicle) was administered for three weeks by IP injection into nude mice bearing human breast cell line (MDA-MB-468) tumor xenografts starting when the average tumor size in each group was ~100 mm3. Tumor measurements were taken thrice weekly. PL inhibited tumor growth (Figure 8A) with the difference in tumor volume between PL- vs. vehicle-treated mice becoming significant after only two doses and continuing until the end of treatment. The mice were euthanized one day after the last treatment; tumors were excised and weighed. PL treatment over 21 days reduced tumor weight by >50% (Figure 8B; p < 0.05). Whole protein extracts of tumor tissue from DMSO-treated mice (n = 12) and PL-treated mice (n = 11) were examined for pStat3, tStat3 and GAPDH levels using Luminex assays. Levels of pStat3 were reduced by 40% in tumors from PL treated mice (0.09 ± 0.05) compared to tumors from vehicle treated mice (0.15 ± 0.04; p<0.01; Figure 8C).
Figure 8.
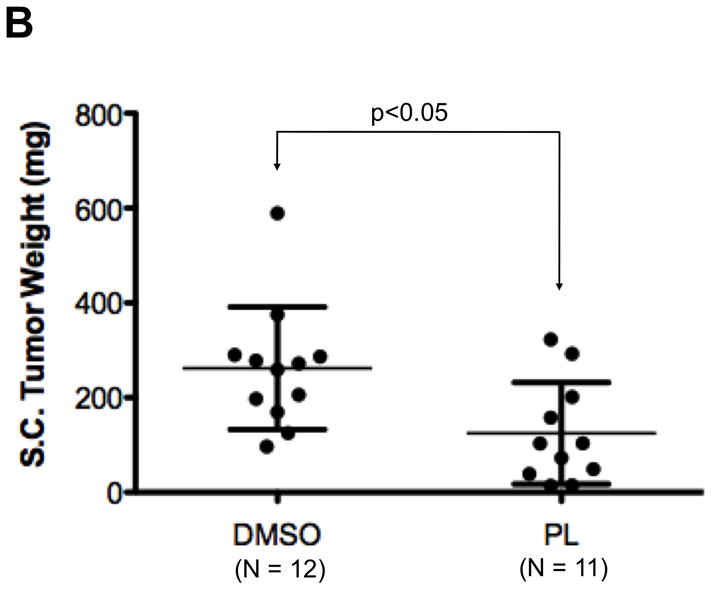
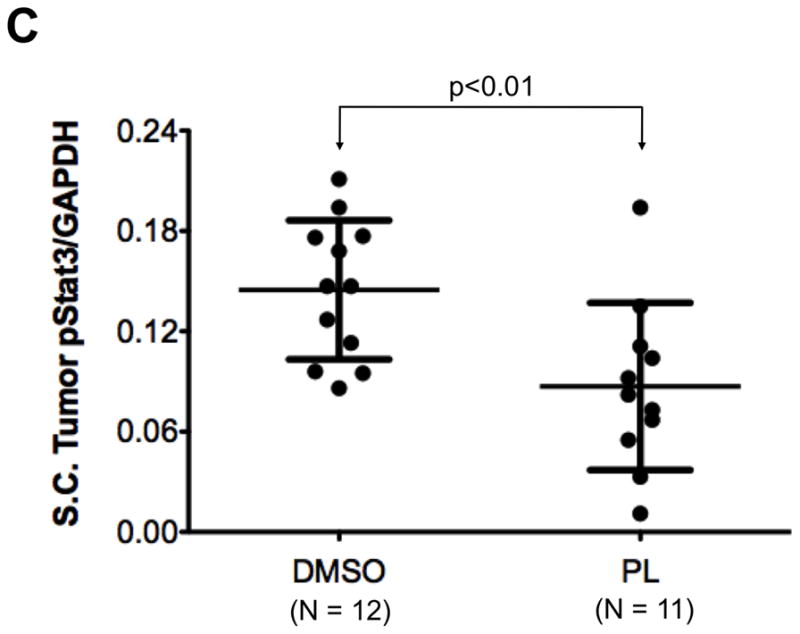
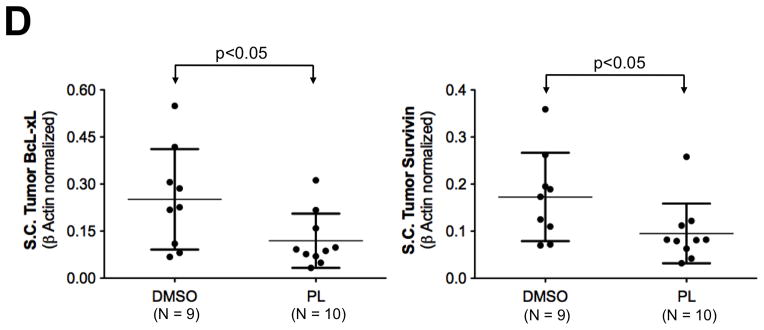
Breast cancer xenograft tumor growth inhibition by piperlongumine. A. Mice growing subcutaneous tumors (MDA-MB-468 cells, 3 × 10⁶, ~6wks) were randomized (average tumor vol ~100mm3) to receive 21 intraperitoneal injections of either DMSO or piperlongumine (15mg/Kg). Tumor volumes were measured thrice weekly. Average tumor volumes (0.5 × (long dimension) × (short dimension)2) are plotted along the Y axis (A) and were compared by t test (* p<0.05, **p < 0.01). Arrows indicate days of PL injection. B. After 21 injections, mice were euthanized, tumor tissue excised, weights measured and plotted and compared by t test (* p<0.05, **p < 0.01). C. Whole cell lysates from tumor tissue from DMSO or PL treated mice were tested for pStat3, total Stat3, and GAPDH. GAPDH-normalized pStat3 values are plotted along Y-axis and the difference compared using t test. D. mRNA from DMSO or PL treated mice were reverse-transcribed and tested for expression of selected Stat3-regulated genes by real time PCR. Relative β-actin-normalized mRNA levels [2^[Ct(β-actin)−Ct(Gene)] were plotted along Y axis, groups compared using t test.
We demonstrated above that the inhibitory effect of PL on Stat3 phosphorylation and nuclear translocation in cell lines was accompanied by dramatic reductions in mRNA transcripts of known Stat3-upregulated genes within breast cancer cell lines in vitro, including BcL-xL, Survivin, XIAP, CIAP, MT2A, NFE2L1 and Glut1. To determine the effects of PL treatment on their levels within tumors, we measured mRNA transcript levels of these genes in tumors from PL-treated mice and vehicle-treated mice by Q-RT-PCR. Transcript levels of each of these Stat3 upregulated gene targets were reduced up to 63% in tumors from PL-treated mice (N = 10) vs. tumors from vehicle-treated mice (N = 9; p<0.001, Supplemental Table 4). In particular, PL treatment reduced the β-actin-normalized levels of BcL-xL by 52.5% and of Survivin by 45% compared to vehicle-treated mice (p<0.05; Figure 8D). Thus, PL prevented growth of a Stat3-dependent breast cancer cell line xenografts, by reducing levels of pStat3 within the tumor and by down-modulating Stat3-regulated genes important for tumor growth.
DISCUSSION
Several strategies have been employed to identify agents that target Stat3 to treat cancer but none has yet entered into clinical use. Using a high-throughput fluorescence microscopy search strategy to identify drug-like compounds in a drug-repositioning library (Prestwick library) that were capable of blocking ligand-induced nuclear translocation of Stat3, we identified piperlongumine (PL), a natural product isolated from the fruit of the pepper Piper longum. Piperlongumine inhibited Stat3 binding to its pY-peptide ligand resulting in reduced nuclear translocation, inhibition of ligand-induced and constitutive Stat3 phosphorylation, and modulation of expression of multiple Stat3-regulated genes. PL inhibited anchorage-independent and anchorage-dependent breast cancer cell growth and induced apoptosis of these cells. PL treatment prevented growth of breast cancer cell line xenografts in nude mice through effectively targeting Stat3 within these tumors resulting in reduced levels of Stat3-regulated, tumor-survival genes. Thus, PL represents a promising new agent for hit-to-lead development and subsequent entry into the clinic for use in treating breast cancer, as well as other cancers in which Stat3 plays a role.
Evidence that PL mediates breast cancer cell apoptosis through Stat3-dependent modulation of key anti- and pro-apoptotic molecules clearly emerges from our results. PL treatment of the Stat3-dependent breast cancer cell line, MD-MB-468, for 6–8 hr decreased mRNA levels of five major anti-apoptotic proteins (Bcl-2, BcL-xL, Survivin, XIAP and CIAP) by 20% to 68% (Supplemental Table 2), while increasing mRNA levels of PUMA, a pro-apoptotic Bcl-2 member, by 5 fold, and FAS (CD95), the death domain containing receptor, by two fold. These mRNA changes at 6–8 hr were followed at 12 hr by activation of Caspase3 indicating induction of apoptosis. PL also inhibited growth of MDA-MB-468 xenografts in nude mice, through efficient in vivo reduction of pStat3 levels accompanied by reduction in 8 of 8 Stat3-regulated, anti-apoptosis genes examined including BcL-xL and Survivin (each by ~50%, p<0.05). While not specifically examined, it is likely that PL targets Stat3 in cell types within tumors, such as tumor epithelial cells, stromal fibroblasts, and endothelial cells, in addition to the breast cancer cells themselves. Tumor epithelial cells, stromal fibroblasts, and endothelial cells have been reported to contribute to oncogenic transformation and maintenance, in part, through a Stat3-dependent mechanism 39, thus, targeting Stat3 within them would be expected to augment the anti-tumor effects of PL.
A phosphoprotein antibody array analysis revealed that PL treatment (30uM for 2hrs) does not affect Stat3 activation indirectly through targeting other components of signaling pathway in breast cancer cell line MDA-MB-468. Using a >1.4 fold change (increase or decrease; p<0.01, t test) and minimum basal level of expression >40 as cut-off for designating a measurable change (Supplemental Table 5), we found that PL does not change phosphorylation of RTKs and non-RTKs known to be involved in Stat3 phosphorylation including Abl, Brk, EGFR, Her2, IGF1R, Lyn, Met and Src (implicated in Stat3 activation in breast cancer) and other known upstream kinases including Scr family kinases Lck, Hck, and Fyn. Neither does it affect other known positive regulators of Stat3 in breast and other cancers and cell-types e.g. integrin β3, integrin β4, ER-α, progesterone receptor. In addition, PL did not affect known inhibitors of Stat3 activation such as BTK, Gab1, SHP-1, SHP-2, GRB2 and WWOX (Supplemental Table 5). Thus, the mechanism of Stat3 inactivation by PL appears to be its ability to directly inhibit Stat3 binding to its pY-peptide ligand (Figure 4).
Using the same criteria as above to designate what constitutes a measurable change in phosphorylation, the phospho-proteome screen also revealed that PL did not significantly affect levels of various components of other major pro-oncogenic signaling pathways, e.g. AP1, PI3K/Akt/mTOR, FAK, and MAP kinase (ERK, JNK, and p38) pathway (Supplemental Table 6). There was, however, a significant decrease (by ~30–40%) in the absolute levels of p65, a major subunit of the NF-κB protein complex (Supplemental Table 6). However, p65 (RelA) has two potential Stat3 binding sites in its promoter (data not shown) suggesting that the PL-mediated decrease in p65 may be mediated indirectly through its effect on Stat3.
While we established that PL specifically targets breast cancer cell lines with increased pStat3 levels, PL was recently shown to inhibit the growth of two breast cancer cell lines with low levels of pStat3, BT-474 and MCF-7 40. Recently, unphosphorylated (U)-Stat3, which represents the bulk of total Stat3, has been described to be oncogenic 41, 42, in part, by modulating known pStat3 gene targets with pro-oncogenic effects including c-Myc, c-fos and Bcl-xL, as well as genes such as RANTES, cdc2, cyclin B1, IL-6, IL-8, Met and M-RAS through its co-operative binding with NF-κB to specific κB elements and/or other novel mechanisms 41, 43, 44. These observations raised the possibility that PL was targeting not only pStat3 but U-Stat3, as well. To address this possibility, we measured levels of constitutive pStat3 levels (Figure 3A) as well as total Stat3, as a surrogate of U-Stat3 (Figure 3B) in eleven breast cancer cell lines and two non-tumorigenic breast epithelial cell lines, MCF-10A and MCF-12A. The two normal breast cell lines, as well as 6 breast cancer cell lines (MCF-7, T47D, ZR-75-1, BT-474, MDA-MB-453 and SK-BR3) had low pStat3 levels, whereas 5 cell lines (Hs578T, HCC1954, MDA-MB-231, MDA-MB-468 and Sum159PT) had increased levels of pStat3 (Figure 3A). Interestingly, examining the total Stat3 levels in these cells revealed that the non-tumorigenic breast epithelial cells, MCF-10A and MCF-12A, had substantially lower levels of total Stat3 compared to the breast cancer cell lines. Irrespective of their differential levels of constitutive pStat3, all the cancer lines had from 10-to- 25 times the level of total Stat3 compared to these cells. Importantly two pStat3-low cell lines, T47D and ZR-75-1, had the highest levels of total Stat3. We examined six pStat3-low cell lines MCF-7, T47D, ZR-75-1, MDA-MB-453, MCF-10A and MCF-12A—along with three pStat3-high cell lines—MDA-MB-231, MDA-MB-468 and Sum159PT—for PL-sensitivity in anchorage-independent growth assays, which clearly revealed (Table 2) that all the pStat3-high cells were effectively inhibited within 16 hours with IC50s ranged from 2.8 to 12.9 μM. In contrast, the pStat3-low cells e.g. the MCF10A, MCF12A, MDA-MB-453, ZR-75-1 and T-47D had higher IC50s (ranging from 15.5 to 100 μM). Importantly, however, the results of incubation of cells lines with PL for a longer time period (80 hr) revealed that there is a significant negative correlation between PL IC50 values and the total Stat3 levels in these cell lines (Pearson r = −0.7739, p = 0.0144), indicating that with longer incubation, PL sensitivity correlates to levels of total or U-Stat3. Thus, it appears that PL not only is able to reduce levels of constitutive and ligand-induced pStat3 within breast cancer cells, it also is able to target U-Stat3; the mechanism for PL targeting of U-Stat3 is an area of active investigation in our laboratory.
Table 2.
Summary of relative pStat3 and total Stat3 levels and anchorage independent growth inhibitory activities of Piperlongumine (IC50) in breast cancer cell lines
| Relative pStat3/GAPDH (× 1000) | Anchorage Independent Growth IC50 (μM), 16 hrs | Relative tStat3/GAPDH (× 1000) | Anchorage independent Growth IC50 (μM), 80 hrs | |
|---|---|---|---|---|
| MCF 10A | 3.9 | 100.0 | 38.9 | 100.0 |
| MCF-12A | 4.4 | 16.2 | 59.3 | 100.0 |
| MCF-7 | 6.5 | 7.0 | 427.8 | 3.6 |
| MDA-MB-453 | 4.4 | 15.5 | 550.9 | 1.7 |
| MDA-MB-231 | 17.1 | 9.2 | 712.3 | 0.3 |
| ZR-75-1 | 7.4 | 80.6 | 854.0 | 0.8 |
| MDA-MB-468 | 28.8 | 2.8 | 873.7 | 0.9 |
| T-47D | 6.5 | 42.0 | 1018.6 | 0.3 |
| Sum159PT | 29.1 | 12.9 | 1037.1 | 0.8 |
Whole proteins from the cell lines were assayed for pStat3/tStat3/GAPDH protein, using Luminex. GAPDH-normalized pStat3 or tStat3 levels were multiplied by 1000 and entered in corresponding columns. The IC50s (in μM) for inhibition of anchorage independent growth by PL for two different time points (viz 16 and 80hrs) are mentioned in different columns. The tStat3/GAPDH levels (×1000) values and the 80hr IC50 values were used for correlation analysis. The IC50s for cell lines not showing any sensitivity were taken as 100 μM.
PL was shown previously to induce apoptosis of leukemia cell lines 45 but its mechanism of action was not explored. More recently, PL was identified in a high-throughput screen designed to identify compounds that activate p53 40. Detailed analysis demonstrated that PL selectively induced apoptosis in various cancer cells, including breast cancer, by decreasing their defense against reactive oxygen species (ROS)40. PL was shown to bind to glutathione S-transferase pi 1 (GSTP1) and carbonyl reductase 1 (CBR1) and to inhibit GSTP1 activity; however the IC50 for GSTP1 inhibition was modest (~100 μM) while the IC50 for CBR1 not reported. The high IC50 reported and the inability of over-expression of GSTP1 and CBR1 to fully rescue a PL-susceptible cancer cell from PL-induced apoptosis strongly suggests that apoptosis induction by PL is mediated, at least in part, by affecting other targets. Our findings clearly support Stat3 as another key PL target and that PL induces cancer cell apoptosis through modulating the balance of anti- and pro-apoptotic proteins within cancer cells by inhibiting Stat3.
Stat3 has previously been demonstrated to be a major regulator of cellular defense against ROS, which raises the distinct possibility that some of the effects of PL on ROS defense reported above 40, 46 may be mediated through Stat3 inhibition. When mice engineered to have tissue-specific Stat3 deletions were subjected to injury models, they displayed increased ROS production and injury within their cardiomyocytes, astrocytes, and osteoblast/osteocytes compared to WT mice 47–51. In these and other experiments, Stat3 was shown to upregulate expression of superoxide dismutase (MnSOD) 52, the metallothioneins MT1 and MT2 53 and to modulate a variety of other oxidative stress and defense genes. Specifically, MT2, IDH2, OPLAH, PRDX6, SOD3, GPX4, GSR, PRDX5, NFE2L1, MAPK10, BACE2, PRDX5, PARK7 and NDUFS4 were shown to be upregulated by Stat3 49 while GSS, GGTLA1, GPX7, ANPEP, GSTA3, Ptges, NQO1 and Ptgis were downregulated by Stat3 49. To determine if PL modulated mRNA transcript levels of ROS defense genes through its inhibitory effect on Stat3, we used a commercially obtained panel of Q-RT-PCR primers for 84 genes involved in ROS metabolism (PAHS 065A, SA Biosciences), which included many genes reported to be Stat3 regulated (Supplemental Table 3). Primers for the remaining 13 Stat3-regulated ROS metabolism genes, which were not included in this panel, were synthesized. Levels of mRNA transcript for these 97 (84+13) genes were determined in total RNA isolated from MDA-MB-468 cells incubated without or with PL (30μM PL for 6–8hr); 77 out of 97 genes had detectable levels for analysis. Out of these 77 genes, 19 genes (25%) were affected by PL treatment at 6hrs (≥ 20% change, p<0.05) and 34 (44%) were affected at 8hrs (≥ 20% change, p<0.05). Out of 14 anti-oxidant genes, previously shown to be upregulated by Stat3 (Supplemental Table 3), PL treatment for 8 hrs significantly downregulated 8 genes (MT2A, IDH2, NFE2L1, GSR, BACE2, NDUFS4, PARK7 and FOXM1). Out of the 8 genes, reported to be negatively regulated by Stat3 (Supplemental Table 3), 4 genes (NOS2, GSS, NQO1, and GGT5) were upregulated by PL treatment for 8 hr. In addition to known Stat3-regulated genes, PL significantly downregulated 6 additional transcripts encoding proteins with known anti-oxidant properties (MTL5, SCARA3, PXDN, GPX3, RNF7 and SELS (Supplemental Table 7). These genes could also be additional targets positively regulated by Stat3. In fact, Scara3 appears to be positively regulated by a constitutively active Stat3 mutant (Stat3-C) expression in 3T3 cells 54. HSP60, a Stat3-regulated gene 55, positively regulates GPX3 during human adipose tissue-derived stem cell (hATSC) differentiation 56. Thus, apart from PL’s role in directly binding to GSTP1 40, we provide convincing evidence of an additional mechanism of its ROS-modulatory action through its targeting of Stat3 and modulation of the Stat3-mediated anti-oxidant transcriptome.
MATERIALS AND METHODS
Cell culture, chemicals, and chemical library
Human breast cancer cell lines, MDA-MB-468, MDA-MB-231, Hs578T, MCF-7, T47D, breast epithelial cell line MCF-12A, and the AML cell line, Kasumi 1, were purchased from the American Type Culture Collection (ATCC, Rockville, MD). Culture media, antibiotics, FBS, and other supplements were bought from Invitrogen (Grand Island, NY). Cells were maintained in complete media with 10% FBS, with antibiotics (streptomycin and penicillin), an anti-fungal (amphotericin), Glutamax, and pyruvate and not passed continuously more than 4 weeks. Cell lines were originally authenticated by ATCC, but no further authentication was done. The Prestwick chemical library (http://www.prestwickchemical.com/index.php?pa=26) consisting of 1,120 compounds was purchased by the John S. Dunn Gulf Coast Consortium for Chemical Genomics (JSDGCCCG) and made available to the authors for use in their HTFM screen through a grant from the JSDGCCCG.
High throughput fluorescence microscopy (HTFM) screening assay
A robust, single-cell, HTFM screening assay was established using GFP-tagged Stat3α, stably expressed (>80% pos) in Stat3−/− MEF cells 27, 37 and used to measure Stat3 nuclear translocation. The detailed method is provided in Supplemental Information.
Phosphoflow assay
Kasumi-1 cells, were serum-starved, pre-treated with PL or DMSO and then stimulated with 20 μl of GCSF (10 ng/ml) for 15 minutes at 37°C. The assay was stopped by BD Phosflow Stop/Fix Buffer; cells were permeabilized and stained with Alexa647-pStat3. Equal aliquots from each treatment condition were added to a 96 well plate to facilitate the use of the BD HTS (High throughput sampler) using BD LSR2. FCS files were exported and uploaded to Cytobank 57 for determination of phosphoprotein. IC50 values were calculated using the GraphPad Prism.
Ligand-induced Stat3 phosphorylation Breast Cancer cell lines
MCF7, MDA-MB-453 and T47D cells, were serum-starved (1hr), pre-treated with PL or DMSO (2hrs) and then stimulated with IL6/sIL6R treatment (150ng/ml) for 15 minutes at 37°C. Whole protein was extracted and pStat3, and GAPDH levels were determined by Luminex.
Luminex assay
Total protein was plated in a 96 well filter plate pre-loaded with beads (Millipore, Danvers, MA) coupled to antibody against the indicated analytes. Bead-bound analytes were measured using biotinylated detection antibody specific for a different epitope and streptavidin-phycoerythrin (streptavidin-PE) 58, 59. Data were collected and analyzed using the Bio-Plex suspension array system (Luminex 100 system, Bio-Rad Laboratories, Hercules, CA). GAPDH-normalized pStat3 values from each treatment were corrected for untreated cells, expressed as percentage untreated, and used to determine the IC50 using GraphPad.
Surface plasmon resonance (SPR) assay
Binding of Stat3 (200nM in 20 mM Tris buffer, pH 8) pre-incubated without or with PL (0.1–1,000 μM; 4° for 18 hr) to phosphorylated and control non-phosphorylated biotinylated EGFR derived dodecapeptides based on sequence surrounding Y1068 60 was measured using a Biacore 3000 biosensor (Biacore inc., Piscataway NJ) at 25°C at a flow rate of 10 μL/min for 1–2 minute, as described 61. Analytical methods provided in Supplemental Information.
Quantitative RT-PCR
Total mRNAs from MDA-MB-468 cells, treated with 30 μM PL for various times were reverse transcribed and tested for expression of various Stat3-regulated and other relevant genes by real time PCR using SyBr green labeled dNTP mix. The results were expressed as relative mRNA levels normalized to the β-Actin mRNA level using the formula [2^[Ct(β-Actin)−Ct(Gene)]. The detailed method is provided in Supplemental Information.
Oxidative Stress and Antioxidant Defense PCR Microarray
Total mRNAs extracted from MDA-MB-468 cells treated without or with PL, reversed transcribed and used for real-time PCR using the Human Oxidative Stress and Antioxidant Defense RT2 Profiler PCR microarray according to the manufacturer’s protocol (Super-Array Bioscience, Frederick, MD). The detailed method is provided in Supplemental Information
Anchorage-independent cell growth
Cells were cultured in triplicates in ultra-low attachment 96 well plates in complete DMEM ± PL for 48–72 hrs and viable cells were quantitated using MTT. Relative % viability (viability after any treatment ÷ viability of untreated cells × 100) was plotted along Y-axis. At least 2 replicates experiments were performed and were used for IC50 calculation using GraphPad software.
Anchorage-dependent cell growth assay
Cells were grown in 96 well plates in DMEM with 10% FBS ± PL for 24–48 hrs and viability measured by MTT. Optical density (OD) was measured at 590 nm using a 96-well multi-scanner (EL-800 universal microplate reader, BioTek Inc, VT, USA). Percent viability was determined as before. At least 2 replicates experiments were performed and used for IC50 calculation using GraphPad software.
Patient-derived xenografts (PDX) models
With the exception of MC1 36, patient-derived human breast cancer xenografts were established in our laboratory 35. The detailed method is provided in Supplemental Information.
Mammosphere assay
Excised PDX or GFP+ Sum-159PT tumors were minced, digested with Collagenase, filtered through nylon mesh, suspended in MEGM+, and plated for mammospheres (MS) in 24 well plates in 0.4ml (20000/ml) or in 96 well plates in 200 μl (2000/100 μl). Cells were fed twice/week with 0.1 ml (or 50 μl for 96 well plates) of media. After 5–12 days, these were imaged and counted using GelCount at 2400 dpi. The percent growth was obtained by (number of colonies ÷ number of colonies formed by untreated cells × 100). These values were used for IC50 calculation using the GraphPad software
Phosphoprotein antibody array
Protein extracted from four pairs of MDA-MB-468 cells—untreated control and PL (30uM for 2hrs) treated—was examined for level of phosphorylation using a antibody array containing well-characterized antibodies against specific 1318 phosphoproteins (http://www.fullmoonbiosystems.com/Products/AntibodyArrays/PEX100.htm) and their unphosphorylated counterparts. Analytical methods are provided in Supplemental Information.
The lentiviral Stat3 reporter system and selection of GFP+ Sum159 xenograft derived cells
A lentiviral reporter system for detecting cells with high Stat3 activity was developed in our collaborator’s lab (Wei et al, to be presented elsewhere). This included the STAT3-GFP reporter (GFP under the control of four repeats of the M67 sequences, a high affinity variant of the STAT3 binding sequence from human c-fos promoter), the TATA-GFP negative control (constructed by deleting the M67 sequences to leave the TATA box only), and an EFS-GFP positive control (constructed by replacing the four M67 sequences with the elongation factor 1 alpha binding sequence or EFS). The reporter system proved to be both stringent and sensitive to STAT3 signaling.
Human breast cancer cell line xenograft assay
MDA-MB-468 cells were subcutaneously inoculated into right flank of 5–6 week old nude mice (15 mice/group). After ~4 weeks, mice were randomized (average tumor size ~100mm3/group) and received either PL (15 mg/Kg in 50 μl DMSO) or DMSO (50 μl) intraperitonealy 5 days/week for 3 weeks. Tumor sizes were measured thrice weekly. Subcutaneous tumor volume (mm3) was calculated as 0.5 × (long dimension) × (short dimension)2. At the end of 3 weeks, mice were euthanized. Tumor tissue was excised, weighed and protein extracted for measurement of pStat3, tStat3, and GAPDH by Luminex assay. SUM159PT cells transduced with the Stat3-GFP reporter were injected into the pre-cleared mammary gland of immunocompromised SCID/Beige mouse, the same strain used for PDXs.
Statistical Analysis
Student’s t-test or a paired t-test was used to compare control- and PL-treated groups as indicated.
Supplementary Material
Acknowledgments
Grant support: This work was supported, in part, by a National Institutes of Health grant CA149783 (DJT), P50-CA058183 (MTL), U54-CA149196 (MTL), the BCM Cancer Center Support Grant P30 CA125123, and a research grant from the John S. Dunn Gulf Coast Consortium for Chemical Genomics Screening Grant Program (DJT).
We would like to thank various BCM core facilities for providing the infrastructure, instrumentation and expertise for performing many of our experiments; the Integrated Microscopy core (Director: Michael Mancini, Ph.D.) for assistance with the High throughput fluorescence microscopy (HTFM) screening assay; the Cytometry and Cell Sorting Core (Director: Joel M. Sederstrom, M.B.S./Christine Beeton, Ph.D) for the Phosphoflow experiments; the Protein and Antibody Array Proteomics Core (Director: Shixia Huang, Ph.D.) for the phosphoproteomic analysis. This project was supported, in part, by the following grants; National Institutes of Health grant CA149783 (DJT), P50-CA058183 (MTL), U54-CA149196 (MTL), the BCM Cancer Center Support Grant P30 CA125123, research grants from the John S. Dunn Gulf Coast Consortium for Chemical Genomics Screening Grant Program (DJT), NCRR grant S10RR024574, NIAID AI036211 and NCI P30CA125123 (BCM Cytometry and Cell Sorting Core funding).
Footnotes
CONFLICT OF INTEREST
The authors have no conflicts of interest.
References
- 1.Zhong Z, Wen Z, Darnell JE., Jr Stat3: a STAT family member activated by tyrosine phosphorylation in response to epidermal growth factor and interleukin-6. Science. 1994;264:95–98. doi: 10.1126/science.8140422. [DOI] [PubMed] [Google Scholar]
- 2.Jing N, Tweardy DJ. Targeting Stat3 in cancer therapy. Anticancer Drugs. 2005;16:601–607. doi: 10.1097/00001813-200507000-00002. [DOI] [PubMed] [Google Scholar]
- 3.Johnston PA, Grandis JR. STAT3 signaling: anticancer strategies and challenges. Mol Interv. 2011;11:18–26. doi: 10.1124/mi.11.1.4. [DOI] [PMC free article] [PubMed] [Google Scholar]
- 4.Hanahan D, Weinberg RA. The hallmarks of cancer. Cell. 2000;100:57–70. doi: 10.1016/s0092-8674(00)81683-9. [DOI] [PubMed] [Google Scholar]
- 5.Hanahan D, Weinberg RA. Hallmarks of cancer: the next generation. Cell. 2011;144:646–674. doi: 10.1016/j.cell.2011.02.013. [DOI] [PubMed] [Google Scholar]
- 6.Grandis JR, Drenning SD, Chakraborty A, Zhou MY, Zeng Q, Pitt AS, et al. Requirement of Stat3 but not Stat1 activation for epidermal growth factor receptor- mediated cell growth In vitro. J Clin Invest. 1998;102:1385–1392. doi: 10.1172/JCI3785. [DOI] [PMC free article] [PubMed] [Google Scholar]
- 7.Gritsko T, Williams A, Turkson J, Kaneko S, Bowman T, Huang M, et al. Persistent activation of stat3 signaling induces survivin gene expression and confers resistance to apoptosis in human breast cancer cells. Clin Cancer Res. 2006;12:11–19. doi: 10.1158/1078-0432.CCR-04-1752. [DOI] [PubMed] [Google Scholar]
- 8.Yu H, Kortylewski M, Pardoll D. Crosstalk between cancer and immune cells: role of STAT3 in the tumour microenvironment. Nat Rev Immunol. 2007;7:41–51. doi: 10.1038/nri1995. [DOI] [PubMed] [Google Scholar]
- 9.Doucette TA, Kong LY, Yang Y, Ferguson SD, Yang J, Wei J, et al. Signal transducer and activator of transcription 3 promotes angiogenesis and drives malignant progression in glioma. Neuro Oncol. 2012;14:1136–1145. doi: 10.1093/neuonc/nos139. [DOI] [PMC free article] [PubMed] [Google Scholar]
- 10.Xiong H, Hong J, Du W, Lin YW, Ren LL, Wang YC, et al. Roles of STAT3 and ZEB1 proteins in E-cadherin down-regulation and human colorectal cancer epithelial-mesenchymal transition. J Biol Chem. 2012;287:5819–5832. doi: 10.1074/jbc.M111.295964. [DOI] [PMC free article] [PubMed] [Google Scholar]
- 11.Barry SP, Townsend PA, Knight RA, Scarabelli TM, Latchman DS, Stephanou A. STAT3 modulates the DNA damage response pathway. Int J Exp Pathol. 2010;91:506–514. doi: 10.1111/j.1365-2613.2010.00734.x. [DOI] [PMC free article] [PubMed] [Google Scholar]
- 12.Demaria M, Giorgi C, Lebiedzinska M, Esposito G, D’Angeli L, Bartoli A, et al. A STAT3-mediated metabolic switch is involved in tumour transformation and STAT3 addiction. Aging (Albany NY) 2010;2:823–842. doi: 10.18632/aging.100232. [DOI] [PMC free article] [PubMed] [Google Scholar]
- 13.Sharma SV, Gajowniczek P, Way IP, Lee DY, Jiang J, Yuza Y, et al. A common signaling cascade may underlie “addiction” to the Src, BCR-ABL, and EGF receptor oncogenes. Cancer Cell. 2006;10:425–435. doi: 10.1016/j.ccr.2006.09.014. [DOI] [PMC free article] [PubMed] [Google Scholar]
- 14.Creighton CJ, Li X, Landis M, Dixon JM, Neumeister VM, Sjolund A, et al. Residual breast cancers after conventional therapy display mesenchymal as well as tumor-initiating features. Proc Natl Acad Sci U S A. 2009;106:13820–13825. doi: 10.1073/pnas.0905718106. [DOI] [PMC free article] [PubMed] [Google Scholar]
- 15.Marotta LL, Almendro V, Marusyk A, Shipitsin M, Schemme J, Walker SR, et al. The JAK2/STAT3 signaling pathway is required for growth of CD44CD24 stem cell-like breast cancer cells in human tumors. J Clin Invest. 2011;121:2723–2735. doi: 10.1172/JCI44745. [DOI] [PMC free article] [PubMed] [Google Scholar]
- 16.Dave B, Landis MD, Tweardy DJ, Chang JC. Selective small molecule Stat3 inhibitor reduces breast cancer tumor-initiating cells and improves recurrence free survival in a human-xenograft model. PLoS One. 2012;7:e30207. doi: 10.1371/journal.pone.0030207. [DOI] [PMC free article] [PubMed] [Google Scholar]
- 17.Heinrich PC, Behrmann I, Haan S, Hermanns HM, Muller-Newen G, Schaper F. Principles of interleukin (IL)-6-type cytokine signalling and its regulation. Biochem J. 2003;374:1–20. doi: 10.1042/BJ20030407. [DOI] [PMC free article] [PubMed] [Google Scholar]
- 18.Quesnelle KM, Boehm AL, Grandis JR. STAT-mediated EGFR signaling in cancer. J Cell Biochem. 2007;102:311–319. doi: 10.1002/jcb.21475. [DOI] [PubMed] [Google Scholar]
- 19.Redell MS, Tweardy DJ. Targeting transcription factors for cancer therapy. Curr Pharm Des. 2005;11:2873–2887. doi: 10.2174/1381612054546699. [DOI] [PubMed] [Google Scholar]
- 20.Koskela HL, Eldfors S, Ellonen P, van Adrichem AJ, Kuusanmaki H, Andersson EI, et al. Somatic STAT3 mutations in large granular lymphocytic leukemia. N Engl J Med. 2012;366:1905–1913. doi: 10.1056/NEJMoa1114885. [DOI] [PMC free article] [PubMed] [Google Scholar]
- 21.Pilati C, Amessou M, Bihl MP, Balabaud C, Nhieu JT, Paradis V, et al. Somatic mutations activating STAT3 in human inflammatory hepatocellular adenomas. J Exp Med. 2011;208:1359–1366. doi: 10.1084/jem.20110283. [DOI] [PMC free article] [PubMed] [Google Scholar]
- 22.Ram PT, Iyengar R. G protein coupled receptor signaling through the Src and Stat3 pathway: role in proliferation and transformation. Oncogene. 2001;20:1601–1606. doi: 10.1038/sj.onc.1204186. [DOI] [PubMed] [Google Scholar]
- 23.Silva CM. Role of STATs as downstream signal transducers in Src family kinase-mediated tumorigenesis. Oncogene. 2004;23:8017–8023. doi: 10.1038/sj.onc.1208159. [DOI] [PubMed] [Google Scholar]
- 24.Schust J, Sperl B, Hollis A, Mayer TU, Berg T. Stattic: a small-molecule inhibitor of STAT3 activation and dimerization. Chem Biol. 2006;13:1235–1242. doi: 10.1016/j.chembiol.2006.09.018. [DOI] [PubMed] [Google Scholar]
- 25.Siddiquee K, Zhang S, Guida WC, Blaskovich MA, Greedy B, Lawrence HR, et al. Selective chemical probe inhibitor of Stat3, identified through structure-based virtual screening, induces antitumor activity. Proc Natl Acad Sci U S A. 2007;104:7391–7396. doi: 10.1073/pnas.0609757104. [DOI] [PMC free article] [PubMed] [Google Scholar]
- 26.Song L, Rawal B, Nemeth JA, Haura EB. JAK1 activates STAT3 activity in non-small-cell lung cancer cells and IL-6 neutralizing antibodies can suppress JAK1-STAT3 signaling. Mol Cancer Ther. 2011;10:481–494. doi: 10.1158/1535-7163.MCT-10-0502. [DOI] [PMC free article] [PubMed] [Google Scholar]
- 27.Xu X, Kasembeli MM, Jiang X, Tweardy BJ, Tweardy DJ. Chemical probes that competitively and selectively inhibit Stat3 activation. PLoS One. 2009;4:e4783. doi: 10.1371/journal.pone.0004783. [DOI] [PMC free article] [PubMed] [Google Scholar]
- 28.Lee SM, Huh TL, Park JW. Inactivation of NADP(+)-dependent isocitrate dehydrogenase by reactive oxygen species. Biochimie. 2001;83:1057–1065. doi: 10.1016/s0300-9084(01)01351-7. [DOI] [PubMed] [Google Scholar]
- 29.Shao H, Quintero AJ, Tweardy DJ. Identification and characterization of cis elements in the STAT3 gene regulating STAT3 alpha and STAT3 beta messenger RNA splicing. Blood. 2001;98:3853–3856. doi: 10.1182/blood.v98.13.3853. [DOI] [PubMed] [Google Scholar]
- 30.Huang Y, Qiu J, Dong S, Redell MS, Poli V, Mancini MA, et al. Stat3 isoforms, alpha and beta, demonstrate distinct intracellular dynamics with prolonged nuclear retention of Stat3beta mapping to its unique C-terminal end. J Biol Chem. 2007;282:34958–34967. doi: 10.1074/jbc.M704548200. [DOI] [PubMed] [Google Scholar]
- 31.Nikulenkov F, Spinnler C, Li H, Tonelli C, Shi Y, Turunen M, et al. Insights into p53 transcriptional function via genome-wide chromatin occupancy and gene expression analysis. Cell Death Differ. 2012;19:1992–2002. doi: 10.1038/cdd.2012.89. [DOI] [PMC free article] [PubMed] [Google Scholar]
- 32.Hochgrafe F, Zhang L, O’Toole SA, Browne BC, Pinese M, Porta Cubas A, et al. Tyrosine phosphorylation profiling reveals the signaling network characteristics of Basal breast cancer cells. Cancer Res. 2010;70:9391–9401. doi: 10.1158/0008-5472.CAN-10-0911. [DOI] [PubMed] [Google Scholar]
- 33.Grimshaw MJ, Cooper L, Papazisis K, Coleman JA, Bohnenkamp HR, Chiapero-Stanke L, et al. Mammosphere culture of metastatic breast cancer cells enriches for tumorigenic breast cancer cells. Breast Cancer Res. 2008;10:R52. doi: 10.1186/bcr2106. [DOI] [PMC free article] [PubMed] [Google Scholar]
- 34.Litzenburger BC, Creighton CJ, Tsimelzon A, Chan BT, Hilsenbeck SG, Wang T, et al. High IGF-IR activity in triple-negative breast cancer cell lines and tumorgrafts correlates with sensitivity to anti-IGF-IR therapy. Clin Cancer Res. 2011;17:2314–2327. doi: 10.1158/1078-0432.CCR-10-1903. [DOI] [PMC free article] [PubMed] [Google Scholar]
- 35.Zhang X, Claerhout S, Prat A, Dobrolecki LE, Petrovic I, Lai Q, et al. A renewable tissue resource of phenotypically stable, biologically and ethnically diverse, patient-derived human breast cancer xenograft models. Cancer Res. 2013;73:4885–4897. doi: 10.1158/0008-5472.CAN-12-4081. [DOI] [PMC free article] [PubMed] [Google Scholar]
- 36.Ginestier C, Hur MH, Charafe-Jauffret E, Monville F, Dutcher J, Brown M, et al. ALDH1 is a marker of normal and malignant human mammary stem cells and a predictor of poor clinical outcome. Cell Stem Cell. 2007;1:555–567. doi: 10.1016/j.stem.2007.08.014. [DOI] [PMC free article] [PubMed] [Google Scholar]
- 37.Huang Y, Qiu J, Dong S, Redell MS, Poli V, Mancini MA, et al. Stat3 Isoforms, {alpha} and {beta}, Demonstrate Distinct Intracellular Dynamics with Prolonged Nuclear Retention of Stat3 Mapping to Its Unique C-terminal End. J Biol Chem. 2007;282:34958–34967. doi: 10.1074/jbc.M704548200. [DOI] [PubMed] [Google Scholar]
- 38.Hedvat M, Huszar D, Herrmann A, Gozgit JM, Schroeder A, Sheehy A, et al. The JAK2 inhibitor AZD1480 potently blocks Stat3 signaling and oncogenesis in solid tumors. Cancer Cell. 2009;16:487–497. doi: 10.1016/j.ccr.2009.10.015. [DOI] [PMC free article] [PubMed] [Google Scholar]
- 39.Jarnicki A, Putoczki T, Ernst M. Stat3: linking inflammation to epithelial cancer - more than a “gut” feeling? Cell Div. 2010;5:14. doi: 10.1186/1747-1028-5-14. [DOI] [PMC free article] [PubMed] [Google Scholar]
- 40.Raj L, Ide T, Gurkar AU, Foley M, Schenone M, Li X, et al. Selective killing of cancer cells by a small molecule targeting the stress response to ROS. Nature. 2011;475:231–234. doi: 10.1038/nature10167. [DOI] [PMC free article] [PubMed] [Google Scholar] [Retracted]
- 41.Yang J, Chatterjee-Kishore M, Staugaitis SM, Nguyen H, Schlessinger K, Levy DE, et al. Novel roles of unphosphorylated STAT3 in oncogenesis and transcriptional regulation. Cancer Res. 2005;65:939–947. [PubMed] [Google Scholar]
- 42.Yang J, Stark GR. Roles of unphosphorylated STATs in signaling. Cell Res. 2008;18:443–451. doi: 10.1038/cr.2008.41. [DOI] [PubMed] [Google Scholar]
- 43.Timofeeva OA, Chasovskikh S, Lonskaya I, Tarasova NI, Khavrutskii L, Tarasov SG, et al. Mechanisms of unphosphorylated STAT3 transcription factor binding to DNA. J Biol Chem. 2012;287:14192–14200. doi: 10.1074/jbc.M111.323899. [DOI] [PMC free article] [PubMed] [Google Scholar]
- 44.Yang J, Liao X, Agarwal MK, Barnes L, Auron PE, Stark GR. Unphosphorylated STAT3 accumulates in response to IL-6 and activates transcription by binding to NFkappaB. Genes Dev. 2007;21:1396–1408. doi: 10.1101/gad.1553707. [DOI] [PMC free article] [PubMed] [Google Scholar]
- 45.Bezerra DP, Militao GC, de Castro FO, Pessoa C, de Moraes MO, Silveira ER, et al. Piplartine induces inhibition of leukemia cell proliferation triggering both apoptosis and necrosis pathways. Toxicol In Vitro. 2007;21:1–8. doi: 10.1016/j.tiv.2006.07.007. [DOI] [PubMed] [Google Scholar]
- 46.Adams DJ, Dai M, Pellegrino G, Wagner BK, Stern AM, Shamji AF, et al. Synthesis, cellular evaluation, and mechanism of action of piperlongumine analogs. Proc Natl Acad Sci U S A. 2012;109:15115–15120. doi: 10.1073/pnas.1212802109. [DOI] [PMC free article] [PubMed] [Google Scholar]
- 47.Barry SP, Townsend PA, McCormick J, Knight RA, Scarabelli TM, Latchman DS, et al. STAT3 deletion sensitizes cells to oxidative stress. Biochem Biophys Res Commun. 2009;385:324–329. doi: 10.1016/j.bbrc.2009.05.051. [DOI] [PMC free article] [PubMed] [Google Scholar]
- 48.Bolli R, Stein AB, Guo Y, Wang OL, Rokosh G, Dawn B, et al. A murine model of inducible, cardiac-specific deletion of STAT3: its use to determine the role of STAT3 in the upregulation of cardioprotective proteins by ischemic preconditioning. J Mol Cell Cardiol. 2011;50:589–597. doi: 10.1016/j.yjmcc.2011.01.002. [DOI] [PubMed] [Google Scholar]
- 49.Sarafian TA, Montes C, Imura T, Qi J, Coppola G, Geschwind DH, et al. Disruption of astrocyte STAT3 signaling decreases mitochondrial function and increases oxidative stress in vitro. PLoS One. 2010;5:e9532. doi: 10.1371/journal.pone.0009532. [DOI] [PMC free article] [PubMed] [Google Scholar]
- 50.Welte T, Zhang SS, Wang T, Zhang Z, Hesslein DG, Yin Z, et al. STAT3 deletion during hematopoiesis causes Crohn’s disease-like pathogenesis and lethality: a critical role of STAT3 in innate immunity. Proc Natl Acad Sci U S A. 2003;100:1879–1884. doi: 10.1073/pnas.0237137100. [DOI] [PMC free article] [PubMed] [Google Scholar]
- 51.Zhou H, Newnum AB, Martin JR, Li P, Nelson MT, Moh A, et al. Osteoblast/osteocyte-specific inactivation of Stat3 decreases load-driven bone formation and accumulates reactive oxygen species. Bone. 2011;49:404–411. doi: 10.1016/j.bone.2011.04.020. [DOI] [PubMed] [Google Scholar]
- 52.Jung JE, Kim GS, Narasimhan P, Song YS, Chan PH. Regulation of Mn-superoxide dismutase activity and neuroprotection by STAT3 in mice after cerebral ischemia. J Neurosci. 2009;29:7003–7014. doi: 10.1523/JNEUROSCI.1110-09.2009. [DOI] [PMC free article] [PubMed] [Google Scholar]
- 53.Oshima Y, Fujio Y, Nakanishi T, Itoh N, Yamamoto Y, Negoro S, et al. STAT3 mediates cardioprotection against ischemia/reperfusion injury through metallothionein induction in the heart. Cardiovasc Res. 2005;65:428–435. doi: 10.1016/j.cardiores.2004.10.021. [DOI] [PubMed] [Google Scholar]
- 54.Haviland R, Eschrich S, Bloom G, Ma Y, Minton S, Jove R, et al. Necdin, a negative growth regulator, is a novel STAT3 target gene down-regulated in human cancer. PLoS One. 2011;6:e24923. doi: 10.1371/journal.pone.0024923. [DOI] [PMC free article] [PubMed] [Google Scholar]
- 55.Kim SW, Lee JK. NO-induced downregulation of HSP10 and HSP60 expression in the postischemic brain. J Neurosci Res. 2007;85:1252–1259. doi: 10.1002/jnr.21236. [DOI] [PubMed] [Google Scholar]
- 56.Jang JH, Jung JS, Choi JI, Kang SK. Nuclear Ago2/HSP60 contributes to broad spectrum of hATSCs function via Oct4 regulation. Antioxid Redox Signal. 2012;16:383–399. doi: 10.1089/ars.2011.4134. [DOI] [PMC free article] [PubMed] [Google Scholar] [Retracted]
- 57.Kotecha N, Krutzik PO, Irish JM. Web-based analysis and publication of flow cytometry experiments. Curr Protoc Cytom. 2010;Chapter 10(Unit10):17. doi: 10.1002/0471142956.cy1017s53. [DOI] [PMC free article] [PubMed] [Google Scholar]
- 58.Aktas B, Tewes M, Fehm T, Hauch S, Kimmig R, Kasimir-Bauer S. Stem cell and epithelial-mesenchymal transition markers are frequently overexpressed in circulating tumor cells of metastatic breast cancer patients. Breast Cancer Res. 2009;11:R46. doi: 10.1186/bcr2333. [DOI] [PMC free article] [PubMed] [Google Scholar]
- 59.Kim BK, Lee JW, Park PJ, Shin YS, Lee WY, Lee KA, et al. The multiplex bead array approach to identifying serum biomarkers associated with breast cancer. Breast Cancer Res. 2009;11:R22. doi: 10.1186/bcr2247. [DOI] [PMC free article] [PubMed] [Google Scholar]
- 60.Shao H, Xu X, Mastrangelo MA, Jing N, Cook RG, Legge GB, et al. Structural requirements for signal transducer and activator of transcription 3 binding to phosphotyrosine ligands containing the YXXQ motif. J Biol Chem. 2004;279:18967–18973. doi: 10.1074/jbc.M314037200. [DOI] [PubMed] [Google Scholar]
- 61.Kim JK, Xu Y, Xu X, Keene DR, Gurusiddappa S, Liang X, et al. A novel binding site in collagen type III for integrins alpha1beta1 and alpha2beta1. J Biol Chem. 2005;280:32512–32520. doi: 10.1074/jbc.M502431200. [DOI] [PubMed] [Google Scholar]
Associated Data
This section collects any data citations, data availability statements, or supplementary materials included in this article.


