
Figure 1.
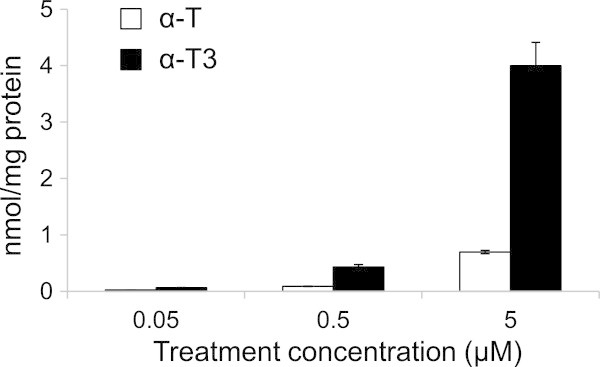
Cellular uptake of α-T and α-T3 at different concentrations. α-T or α-T3 at the concentration in the range between 0.05 and 5 μM was incubated with fibroblasts for 24 h. White bars, α-T; black bars, α-T3. Values are the means ± S.D. (n = 3).