Abstract
Purpose
To propose a method for mitigating slab boundary artifacts in 3D multislab diffusion imaging with no or minimal increases in scan time.
Methods
The multislab acquisition was treated as parallel imaging acquisition where the slab profiles acted as the traditional receiver sensitivity profiles. All the slabs were then reconstructed simultaneously along the slab direction using Cartesian-based sensitivity encoding (SENSE) reconstruction. The slab profile estimation was performed using either a Bloch simulation or a calibration scan.
Results
Both phantom and in vivo results showed negligible slab boundary artifacts after reconstruction using the proposed method. The performance of the proposed method is comparable to the state-of-the-art slab combination method without the scan time penalty that depends on the number of acquired volumes. The obtained g-factor map of the SENSE reconstruction problem showed a maximum g-factor of 1.7 in the region of interest.
Conclusion
We proposed a novel method for mitigating slab boundary artifacts in 3D diffusion imaging by treating the multislab acquisition as a parallel imaging acquisition and reconstructing all slabs simultaneously using Cartesian SENSE. Unlike existing methods, the scan time increase, if any, does not scale with the number of image volumes acquired.
INTRODUCTION
When high isotropic resolution is required in diffusion-weighted imaging, a 2D diffusion-weighted spin echo acquisition can be inefficient in terms of signal-to-noise ratio (SNR). This inefficiency arises from the ever-increasing TR for sufficient spatial coverage when thin slices are used. The three-dimensional multislab (3D multislab) acquisition (1-5) has been applied to high isotropic resolution diffusion imaging (6,7) as a more SNR efficient alternative. In the 3D multislab acquisition, the full 3D imaged volume is divided into multiple 3D sub-volumes in the slice direction. Each of these sub volumes is called a slab. Each slab is then excited and encoded independently. Similar to a 2D slice-interleaved acquisition, the acquisition of slabs in multislab imaging can also be interleaved. Furthermore, thanks to a smaller number slabs, as compared to 2D acquisition, the minimum TR that can be used in an interleaved multislab acquisition can be dramatically reduced.
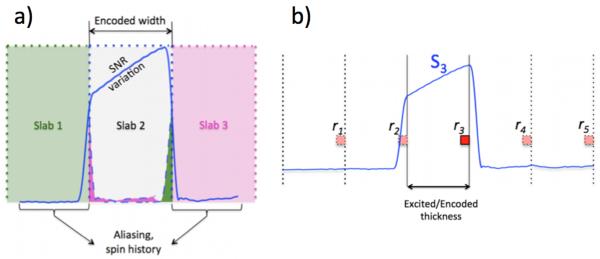
However, the advantage of higher SNR-efficiency of such a 3D multislab acquisition can be diminished by slab boundary artifacts, which are caused by imperfect RF pulse profiles. Due to RF pulse truncation, the achieved slab-selective excitation profile is only an approximation to the ideal rectangular function. This approximate profile contains magnitude variation in the main lobe, non-zero transition bands and side lobes. An exaggeration of this approximation is illustrated in Fig. 1a with the blue solid curve representing the achieved excitation profile for slab 2.
Fig. 1.
a) Venetian blind artifact. The solid blue line represents the slab excitation profile. Extension of slab profile beyond the desired slab thickness, which is also the encoded width, causes aliasing (shaded pink and green areas) and spin history effects. Magnitude variation of the excitation profile within the main lobe causes magnitude variation in the reconstructed image. b) A multislab acquisition. The solid blue curve shows the profile of the acquired slab S3. The encoded thickness was equal to the excited slab thickness. The red-filled square with solid border represents an acquired voxel. Because the achieved slab profile (blue curve) extended beyond the encoded slab thickness, the signal in the acquired voxel (red) contains signals from voxels that are at multiple encoded thicknesses away (aliasing).
Magnitude variation of the slab excitation profile within the main lobe causes signal intensity variation in the obtained reformatted image in the slab direction. In addition, nonzero transition bands and side lobes cause the slab excitation profile to extend beyond the desired slab thickness (Fig. 1a), which in turn leads to two effects. The first is slab crosstalk as shown by the scenario in Fig. 1a: when slab 2 is excited with the imperfect slab profile, parts of adjacent slabs (slab 1 and 3) are also excited. If an interleaved slab acquisition is used the excitation of the next slab (for example slab 3) occurs before previously excited regions (which were excited during the excitation of slab 2) are fully recovered. As a result, these repeatedly excited regions of slab 3 experience signal dropout. The second effect of non-zero transition bands and side lobes is aliasing.
The current method of mitigating slab boundary artifacts includes oversampling in the slice direction, overlapping adjacent slabs, and combining (through averaging or cropping) overlapped slices in the reconstruction (1-7). However, this method leads to an increase in scan time that scales linearly with the number of 3D full FOV image volumes acquired.
In this work, we propose an alternative method for compensating slab boundary artifacts in multislab diffusion-weighted imaging by treating the multislab acquisition as a parallel imaging acquisition. Image reconstruction and slab artifact correction are performed simultaneously with a Cartesian SENSE (8) algorithm in which receiver sensitivity profiles are replaced by the slab excitation profiles. If the slab excitation profile can be estimated robustly using Bloch simulation, the proposed method does not result in an increase in scan time – since a calibration scan is not needed. If, however, a calibration scan is needed, the proposed method only leads to a minor increase in scan time that does not scale with the number of image volumes acquired.
METHODS
Slab Profile Encoding
Consider a multislab acquisition as given in Fig. 1b. Multiple slabs cover the full FOV. Consider the excitation and encoding of one slab. The excitation profile is represented by the solid blue curve. The encoded width is chosen to be equal to the desired slab thickness, ΔFOVz. If the excited width is larger than ΔFOVz, aliasing occurs in the final reconstructed slab image. Specifically, the signal at a certain voxel within a slab is superimposed by signals from voxels that are located multiple ΔFOVz’s away and weighted by the excitation profile and coil sensitivity at the respective locations. The slab profile reflects the combined effects of both excitation and refocusing pulses.
Mathematically, the signal at a voxel in an aliased slab image, Ik(z), can be expressed as
| (1) |
where 0 ≤ z ≤ ΔFOVz indicates locations in the aliased slab image, ΔFOVz is the desired slab thickness and is also the encoded thickness, FOVz is the full FOV in the slab direction, k is the slab index (1 ≤ k ≤ Nslab, Nslab: number of slabs that cover FOVz), S(k) is the excitation profile of slab k (hence the name slab profile encoding), and ρ is the full FOV, unaliased image. Writing Eq. [1] in vector form for all slabs gives
| (2) |
In short,
| (3) |
and unaliased voxels in the full FOV image corresponding to a voxel in the aliased slab image can be obtained with
| (4) |
By applying Eq. [4] for each and every voxel in the aliased slab images, the full FOV unaliased image can be obtained.
Similar to the Cartesian SENSE reconstruction (8), the unaliasing using Eq. [4] can only be done if the number of voxels to be unaliased does not exceed the number of slabs. It is worth noticing that unlike the fixed number of receiver coil in Cartesian SENSE, the number of slabs and their positions in a multislab acquisition can be varied allowing the optimization of the condition of the inverse problem (g-factor) in Eq. [4]. However, when changing the slabs for optimizing the g-factor, it is necessary to take into account the accompanied spin history side effect and SNR efficiency in spin echo based acquisitions.
Slab Excitation Profile Estimation
Knowledge of slab excitation profiles, the S(k) matrices, is required for the unaliasing procedure. Ideally, the slab excitation profile can be estimated with Bloch simulation using the known RF and slice selective gradient waveforms as inputs. In this case, no additional scan time is needed. However, in the presence of B1+, B0 inhomogeneity and variation of T1 and T2 relaxation, the Bloch simulation approach might not be accurate enough for the unaliasing process. Alternatively, slab excitation profiles can be estimated from a calibration scan. The calibration scan should also be a multislab scan with the same number of slabs and slab positions; however, each slab has to be oversampled in the slice direction. Theoretically, to get alias-free slab profiles, one needs to oversample enough to cover full FOV in the slab direction. However, thanks to the roll-off of the slab excitation profile, it might be sufficient to just cover the transition band and the main ripples of the profile. Similar to the procedure for estimating receiver sensitivity profiles in SENSE, slab excitation profiles can be estimated by dividing each of the slab images with the sum-of-squares of the set of slab images. The final slab boundary corrected image will have its signal intensity modulated by the sum-of-squares of absolute slab excitation profiles. Therefore, if slabs are arranged so that their sumof-squares has a flat intensity profile, the reconstructed, unaliased image will also have flat intensity profile. In other words, the effect of slab profile fall-off due to RF pulse truncation or spin history effects is minimized.
When a multi-coil receiver is used for data acquisition, the calibration-based slab profile estimation can be performed on either individual coil or complex coil-combined slab images. As a result, slab profiles estimated from a calibration scan do not contain receiver coil sensitivity information. In this study, we performed profile estimation on complex coil-combined slab images since it is expected to yield better noise performance.
When calibration scans are used for estimating slab excitation profiles, the raw profiles obtained are impaired by noise. Smoothing by polynomial fitting (as in receiver coil sensitivity estimation) helps to overcome this noise problem (8). However, smoothing is limited to in-plane since slab excitation profiles in the through-plane direction are quite localized and smoothing can compromise their accuracy.
MR Measurement
To test the performance of the proposed slab profile encoding method, multislab data acquisition experiments were carried out on both a homogeneous agar phantom and healthy human subjects. For human scans, written informed consent was obtained from each volunteer. Protocols used for phantom and human scans were the same except for the number of slabs.
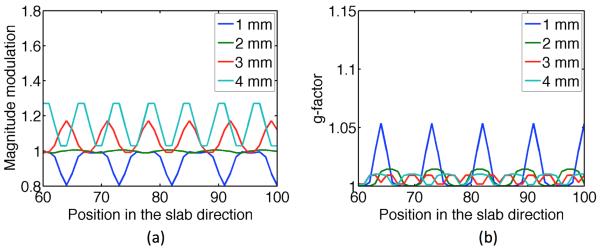
Since SNR efficiency optimization was not done, a slab thickness was chosen with some caution for facilitating the accuracy of 2D motion-induced phase error correction (6). The prescribed excitation slab thickness was 10 mm. A slab-overlapping factor was chosen such that a balance amongst g-factor, expected slab crosstalk, and magnitude modulation by the RF pulse profile could be achieved. To simulate the expected g-factor and magnitude modulation, slab profile was measured for a single slab on an agar phantom. The excitation pulse was a custom designed spectral spatial pulse with 15 side lobes of 1.088 ms duration each, resulting in a pulse width of 16.32 ms. Both spatial as well as spectral time bandwidth product (TBW) were set to 4.0. A 180° refocusing pulse was also designed with TBW of 4.9, and pulse width of 6.4 ms. A more detailed description of the design as well as the resulted spin echo profiles of these pulse can be found in (9). The prescribed slab thickness was 10 mm. The encoded field of view in the slab direction was 20 mm to make sure that all major side lobes were included. This measured slab profile was then replicated and shifted to mimic the estimated profiles of a multislab acquisition. Fig. 2 compares the simulated g-factor and magnitude modulation without the slab crosstalk effect at different slab overlapping factors (10 - 40% slab thickness) with 10 mm slab thickness. For ease of post-processing, the overlapping factors were always a multiple of the pixel size in the slab direction (1 mm in this case). For better visualization, only a section of the FOV in the slab direction was plotted. However, the results are similar in other sections of the FOV in the slab direction. Empirically, overlapping factors of more than 40% of the slab thickness was undesirable due to severe slab crosstalk effects and therefore were not simulated. From Fig. 2, an overlap of 2 mm (20% slab thickness) seemed to give the best balance between g-factor and magnitude modulation. Since slab crosstalk, off-resonance, and B1 inhomogeneity were not simulated, the experimentally achieved magnitude modulation and g-factor were expected to be worse than the simulation results.
Fig. 2.
Comparing magnitude modulation (a) and g-factor (b) at different slab overlapping factors. The slab thickness used for the simulation was 10 mm. For better visualization, only a section of the FOV in the slab direction was plotted. The slab crosstalk effect was not simulated. A flat signal modulation function in the slab direction is desirable. A flat g-factor function that approximates 1 is also desirable. Therefore, the best overlapping factor is 2 mm.
Based on the comparison above, for the protocol that was used subsequently in this study, adjacent slabs were overlapped by 2 mm. As a result, twenty 10mm slabs were required to cover the full brain in the superior-inferior direction. For calibration, the slab direction FOV was 14 mm (i.e., oversampling factor 1.4). For image data, the slab FOV was 10 mm (i.e., no oversampling). A three-interleave EPI trajectory was used for in-plane encoding with a matrix size of 192 × 192. The three interleaves were shifted in phase-encoding direction (ky) so that when combined, the three interleaves formed a fully sampled k-space. This shifted multi-interleave acquisition was introduced elsewhere to enable the estimation of ghost and GRAPPA parameters with the same level of distortion as the multi-interleave image data (10). Matrix size in the through-plane direction was 10 and 14 for image and calibration data, respectively. To shorten the echo time (TE), partial Fourier encoding with a factor of 0.7 was employed. Diffusion-weighted images with one b = 0 and one b = 1000 s/mm2 (superior-inferior direction) were acquired. A diffusion tensor imaging (DTI) acquisition with six diffusion-encoding directions (b = 1000 s/mm2) was also acquired (11). Other imaging parameters include: TE/TR = 70/4000 ms, in-plane FOV = 24 × 24 cm2, readout bandwidth = 125 kHz. For motion-induced phase error correction, a second refocusing pulse was added after the image data readout for the collection of a 2D navigator (6). All data were acquired on a GE MR750 system with an 8-channel headcoil.
Image reconstruction
Image reconstruction was first done for each kz-plane of each slab. GRAPPA and EPI ghost parameters for in-plane reconstruction were estimated from the interleave-combined b = 0 data. Each interleave of each kz-plane was then ghost corrected and GRAPPA reconstructed. Next, the 2D low-resolution motion-induced phase error was estimated from the navigator and removed from corresponding reconstructed interleave. After that projection onto convex sets (POCS) reconstruction was performed for each coil to fill in the remaining extent of ky for each interleave (12). Then 1D Fourier transformation along kz was taken for each slab. Complex averaging across coils and interleaves was performed. Finally, these separately reconstructed slabs were passed to either profile estimation procedure or PEN presented in the Methods section to obtained slab profiles or the final slab-combined full FOV image, respectively.
RESULTS
To evaluate the performance of our proposed method, it is compared with the recently proposed weighted average slab combination method on both non-oversampled and oversampled data (6). In the weighted average method, each slab is first multiplied by a Fermi filter function. Then all weighted slabs are complexly averaged to yield the final slab-combined image. The choice of Fermi filter was not described in details in the work where this weighted average method was introduced. In this work, we iterate through different Fermi filters and choose the one that yields the least observable residual slab boundary artifacts. For clarity, all comparison scenarios are denoted as listed in Table 1.
Table 1.
Abbreviated notions for slab combination scenarios used in the manuscript
| Method | Notion |
|---|---|
| PEN with calibrated slab profiles on non-oversampled data | cPEN nos |
| PEN with Bloch-simulated slab profiles on non- oversampled data |
bPEN nos |
| Weighted average on non-oversampled data | wAVG nos |
| Weighted average on oversampled data | wAVG os |
Phantom
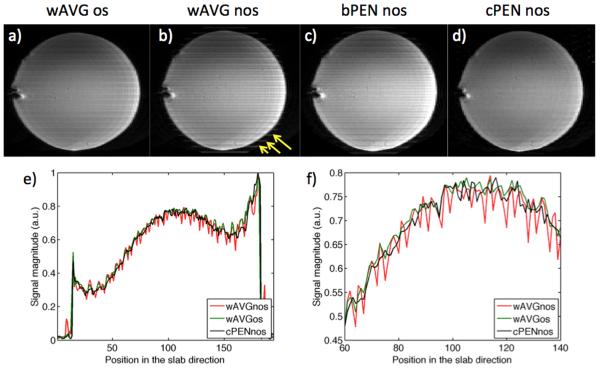
Fig. 3 shows phantom results of multislab acquisition with different slab combination methods on both non-oversampled (nos) and oversampled (os) data. The wAVG nos image (Fig. 3b) shows aliasing artifacts as pointed out by yellow arrows. Although less visible, signal fall-off at slab edges can also be observed in wAVG nos. Oversampling eliminates aliasing artifacts and proper choice of weighting function mitigates signal variation at slab boundaries as can be seen in wAVG os image (Fig. 3a). Using the proposed profile encoding method (PEN), slab boundary artifacts were also mitigated in the final reformatted images (Fig. 3c,d). The performance of PEN is comparable to that of wAVG os (Fig. 3d). PEN with Bloch-simulated profiles (bPEN) is rather effective in removing slab boundary artifacts with only minor signal fall-off and residual aliasing (Fig. 3c). Using slab profiles estimated from a calibration scan (cPEN), alias-free images are produced with barely visible signal fall-off (Fig. 3d). It is worth to restate that data used in both cPEN and bPEN reconstructions were non-oversampled.
Fig. 3.
Comparison of different slab combination methods on non-oversampled (nos) and oversampled (os) multislab data. wAVG: weighted average across slabs; PEN: profile encoding with slab profiles estimated either from a calibration scan (cPEN) or Bloch simulation (bPEN). Reformatted images are presented in (a-d). Yellow arrows point to the residual aliasing artifacts in wAVG nos. Signal profiles along a line through the centers of wAVG nos, wAVG os, and cPEN nos images are plotted in (e); their zoomed-in versions are plotted in (f).
For clearer comparison, the magnitudes of wAVG os, wAVG nos, and calibrated PEN images in Fig. 3a,b,d measured along lines in the middle of the images are plotted in Fig. 3e,f. Again, calibrated PEN and wAVG os give smoother functions as compared to the wAVG nos, and thus better represent the homogeneous signal profile in the agar phantom.
In Vivo
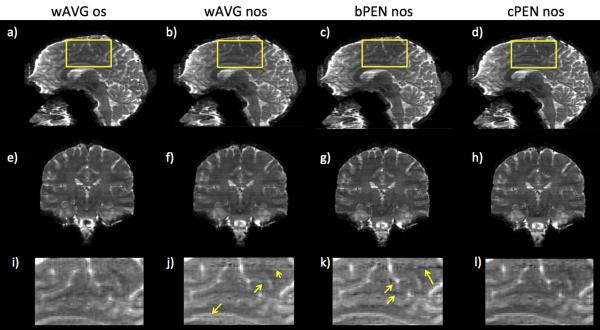
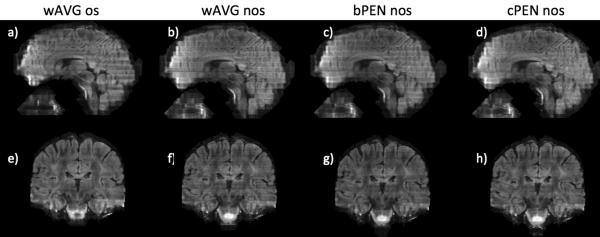
Fig. 4 compares the same set of slab combination methods as in Fig. 3 but on in vivo data. Sagittal views (Fig. 4a-d), coronal views (Fig. 4e-h), and zoomed-in views (Fig. 4i-l) of slab-combined T2-weighted images were shown. Similar to the phantom results, aliasing can be observed in wAVG nos images especially in the coronal view (Fig. 4f) and the zoomed-in view (Fig. 4j, yellow arrows). With oversampling, wAVG os images are virtually free of slab boundary artifacts. When Bloch-simulated profiles were used (bPEN nos), PEN reconstruction failed in at several slab boundaries resulting in noisy lines across the reformatted images (Fig. 4c,g,k). PEN with calibrated slab profiles (cPEN nos) resulted in images that are comparable to wAVG os with almost no boundary artifacts (Fig. 4d,h,l).
Fig. 4.
In vivo T2-weighted images: (a-d) sagittal; (e-h) coronal; (i-l) zoomed-in in areas specified by yellow rectangles in (a-d). Comparison of different slab combination methods with non-oversampled (nos) and oversampled (os) multislab data. wAVG: weighted average across slabs; PEN: profile encoding with slab profiles estimated either from a calibration scan (cPEN) or Bloch simulation (bPEN). Yellow arrows indicate residual slab boundary artifacts.
Results for diffusion-weighted images are shown in Fig. 5. The diffusion encoding direction was S/I ([0 0 1]) with a b-value of 1000 s/mm2. Boundary artifacts are most visible in wAVG nos and bPEN nos images (Fig. 5b,c,f,g). PEN with calibrated slab profiles (cPEN nos) is very effective in mitigating slab boundaries with only minor residual artifacts in the cerebellum and the anterior part of the brain (Fig. 5d). The image quality of non-oversampled cPEN nos is similar to that of the oversampled wAVG os.
Fig. 5.
In vivo diffusion-weighted images: (a-d) sagittal; (e-h) coronal. The diffusion was encoded along superior-inferior (SI) direction with b = 1000 s/mm2. Comparison of different slab combination methods with oversampled (os) and non-oversampled (nos) multislab data. wAVG: weighted average across slabs; PEN: profile encoding with slab profiles estimated either from a calibration scan (cPEN) or Bloch simulation (bPEN).
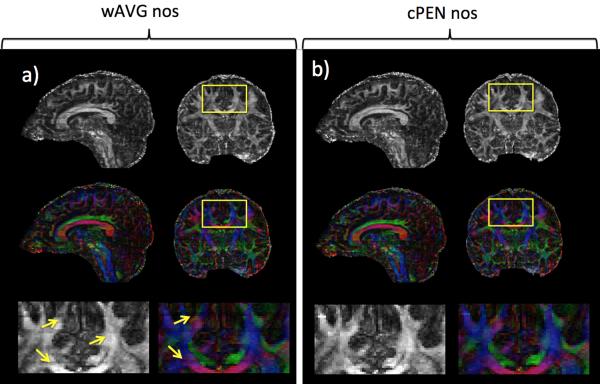
To show the applicability of the PEN method for diffusion tensor imaging (DTI), fractional anisotropy (FA) and color-coded FA maps derived from a multislab six-direction DTI acquisition are shown in Fig. 6. FA maps with few minor boundary artifacts were achieved when the multislab data were combined using cPEN (Fig. 6b). When multislab data were combined using wAVG, more boundary artifacts are visible in both FA and color-coded FA maps (Fig. 6a, yellow arrows).
Fig. 6.
FA and color-coded FA maps derived from (a) wAVG nos and (b) cPEN nos images. Both sagittal and coronal reformats are shown (first two rows) together with zoomed-in areas (last row) specified by yellow rectangles. Yellow arrows point out slab boundary artifacts in diffusion maps derived from wAVG nos images.
To assess the conditioning of the PEN reconstruction problem, a g-factor map was computed using the estimated slab excitation profile. Representative coronal and sagittal reformats of the g-factor map are shown in Fig. 7. With the employed slab configuration, the achieved g-factor approaches 1 at the centers of slabs and increases towards the edges. The g-factor is higher in the regions with a small in-plane FOV (top of brain) or a large B0 inhomogeneity where the estimation of the slab profile is compromised because of low image quality. Nevertheless, the maximum g-factor in the whole brain is less than 1.7 with an average of 1.0363, implying a well-conditioned inverse problem.
Fig. 7.
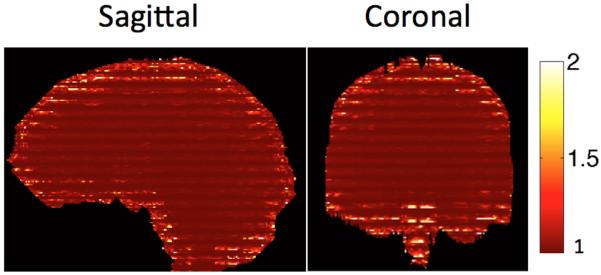
G-factor maps computed using calibrated slab profiles on typical sagittal and coronal cuts. Maximum g-factor in the region of interest is 1.7. In general, g-factor is higher in regions with small in-plane FOV or high B0 inhomogeneity where low image quality results in distorted slab profiles.
DISCUSSION
Despite its increased SNR efficiency at high isotropic resolution and straightforward extension from its equivalent 2D acquisition, multislab 3D acquisition has not been widely used primarily because of the slab boundary artifact. Existing methods for reducing slab boundary artifacts require both oversampling in the slab direction and extending TR for each of the image volume acquired (6,7). Oversampling eliminates aliasing while extending TR minimizes slab crosstalk. However, these approaches diminish the SNR efficiency of the multislab acquisition as compared to its equivalent 2D acquisition as a result of the prolonged scan time. The new PEN method for slab boundary artifact correction proposed in this paper requires oversampling in the slab direction only once for the slab profile estimation. The slab boundary artifact compensation is then done by collectively reconstructing all slabs using a variant of Cartesian SENSE routine where the estimated slab profiles replace the receiver sensitivity profiles.
Previous works on multislab acquisition used different slab combination methods such as cropping overlapped slices and concatenating slabs, taking sum-of-squares of slabs, or taking weighted average of slabs (6,7). Among these methods, the weighted average method is the most generalized thanks to the freedom in the choice of the weighting function. Therefore, in this work we chose to compare the proposed PEN method to the weighted average method. As suggested from a previous work (6), the weighting function of choice is a Fermi function that minimizes the observable slab boundary artifacts in the final reformatted images. While the weighted average method works well on oversampled data (Fig. 4a,e,i), it is expected that this method can fail on non-oversampled data (Figs. 4j, 5b, 6a). The reason is that on non-oversampled data, aliasing exists at slab boundaries and the weighted average method does nothing but averages these aliased signals in the final slab combined images. Furthermore, since the actual slab profiles might vary spatially, different weighting functions might be needed for different parts of the imaged objects otherwise residual boundary artifacts can remain even with oversampled data (Fig. 5a).
As discussed in the Methods section, PEN can operate with slab profiles estimated from either Bloch simulation or calibration scans. In presence of B0, B1+ inhomogeneity, relaxation time variation, and slab crosstalk effects, Bloch-simulated slab profiles deviate from the true profiles, which compromises the quality of the reconstructed images (Figs. 3c, 4c,g,k, 5c,g). Although correction with Bloch-simulated profiles is inferior to correction with calibrated profiles, its advantage is that no calibration scan (and therefore no additional scan time) is needed. Furthermore, correction of existing multislab data without calibration is possible as long as the RF pulses are known.
Slab boundary artifacts involve aliasing and image magnitude variation. Since the g-factor of the inverse problem in Eq.[3] is less than 1.7 everywhere within the 3D image object, unaliasing can be performed effectively using PEN. Flattening the image magnitude variation, however, is more challenging. Similar to conventional SENSE reconstruction, the magnitude variation in the final full FOV image depends on the slab excitation profile estimation procedure. If a Bloch simulation is used, the final magnitude weighting reflects the inaccuracy of the simulated profile due to unaccounted effects such as slab crosstalk, and B0 and B1+ inhomogeneity. Conversely, if excitation profiles are estimated using a calibration scan, the final image magnitude weighting is the weighting that is observed in the image used for normalization. Although simulation to optimize slab-overlapping factor for minimum SOS magnitude variation was done (Fig. 2), the effects of slab crosstalk and B0 and B1+ field inhomogeneity in actual scans will deviate the obtained magnitude variation from the simulated result. Therefore, minor profile-induced magnitude variation can still be seen in slab-profile-corrected images (Fig. 5d). Regardless of the profile estimation procedure, a thorough solution to magnitude flattening will require relaxation time, B0, and B1+ maps to correct for the corresponding effects.
Regarding scan time, let Nkz be the number of kz-encodes, Nshot be the number of in-plane k-space shots per slab for non-oversampled data, and TR be the repetition time. Then the scan time for one volume of non-oversampled data is NshotNkzTR. To eliminate the slab boundary artifact by oversampling every image volume, the total acquisition time for Nvol volumes is NvolNshot(Nkz + Nextra)TR, where Nextra is the number of extra kz-encodes that are needed to fully sample both the transition band and significant side lobes of the imperfect slab excitation profile. The percentage increase in scan time as compared to non-oversampled acquisition in this case is . With PEN, the slab profile estimation and therefore Nkz oversampling is done for only one volume. All subsequent image volumes are not oversampled. Thus, the total scan time for Nvol volumes is Nshot(NvolNkz + Nextra)TR. The percentage increase in scan time of profile encoding as compared to the non-oversampled acquisition is . As an example, with the parameters used in the in vivo acquisition of this paper (Nkz = 10, Nextra = 4 (oversampling factor of 1.4 for calibration), TR = 4 s, Nshot = 3) and Nvol = 10, the total acquisition times are 20, 28, and 20.8 minutes for nonoversampled, oversampled, and PEN data, respectively. Therefore, the proposed PEN method helps mitigate the slab boundary artifact at a much lower cost in scan time as compared to existing methods, especially when a large number of image volumes is needed, as typically used for DTI or other diffusion MRI acquisitions.
The overlapped regions between two adjacent slabs experience a shorter TR (< TR/2) than the non-overlapped regions. Therefore, if an insufficiently long TR is used, as is usually the case to get high SNR efficiency, these overlapped regions can suffer from both signal loss and contrast change. As discussed above, signal loss can be partially recovered by PEN if the overlapped regions are carefully chosen. However, PEN cannot account for the potential contrast change and as a result, residual slab boundary artifacts might remain. It is worth to notice that oversampling and weighted averaging slabs cannot solve residual slab boundary artifacts due to contrast change either. The only solution is to extend TR at a cost of SNR efficiency. However, when comparing in vivo data acquired at TR = 4 s and TR = 7 s, we observe that the effect of contrast change at TR = 4 s (used in this study) at overlapped regions is negligible in brain tissues (Fig. 8). Only in cerebral spinal fluid (CSF) regions (yellow ellipses) where T1 is significantly longer, are boundary artifacts more visible in the TR = 4s image.
Fig. 8.
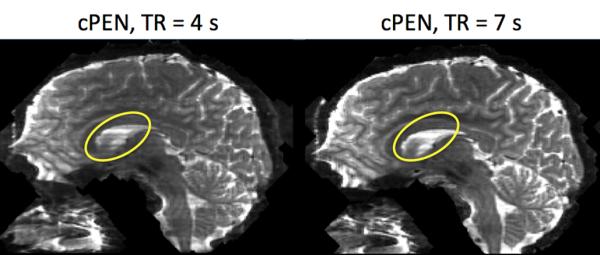
Effects of TR on slab boundary artifacts. Boundary artifacts are negligible in both images acquired with TR = 4s and TR = 7 s in most parts of the brain. In CSF regions (yellow ellipses) where T1 is longer, boundary artifacts are more visible in TR = 4 s.
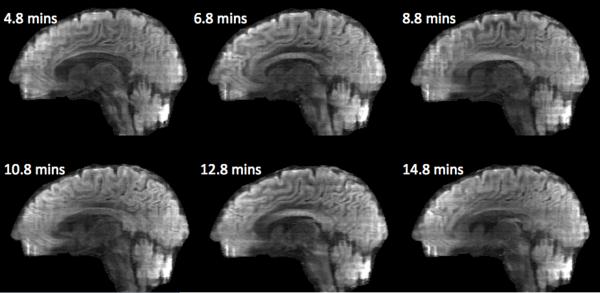
A disadvantage of the proposed PEN method is its potential sensitivity to motion. Since the calibration is acquired once up front, the long scan time of multiple subsequent diffusion-weighted volumes makes them prone to motion and therefore misaligned with the calibration. If the motion during the acquisition of each volume is not negligible, PEN reconstruction result can be compromised and further investigation is needed to minimize motion effects. However, if the motion during the acquisition of each volume (~ 2 minutes for the current prescription) is negligible, the effect of misalignment from volume to volume can also be negligible. The reason is that it is usually the case that B0, B1, as well as tissue relaxation variations are smooth; hence, moderate rotation and translation of imaged object will not alter the slab excitation profiles. An analogy is the conventional parallel imaging case where the receiver coils move together with the imaged object. Therefore, the excitation profiles measured using the calibration up front can safely be used without compromising the reconstruction result. Fig. 9 shows an example of the consistent of PEN performance over the scan time of ~ 14 minutes.
Fig. 9.
cPEN nos images reconstructed from data acquired at different time distances from the acquisition of the calibration (indicated by the number attached to each image). The consistent performance of cPEN shows its robustness over the acquisition time of ~ 14 minutes.
CONCLUSION
Here the PEN method was proposed for mitigating slab boundary artifacts. This approach treats the multislab acquisition as a parallel imaging acquisition with slab excitation profiles replacing receiver sensitivity profiles. Both phantom and in vivo results demonstrate the capability of the PEN to minimize both aliasing and signal fall-off characteristics of the slab boundary artifact. Unlike existing compensation methods, the PEN comes at a minimal increase in scan time that does not scale with the number of image volumes acquired, making it ideal for diffusion imaging applications.
Footnotes
Part of this work was presented as a talk at the 21st ISMRM Annual Meeting & Exhibition, Salt Lake City, Utah, abstract #121
REFERENCES
- 1.Liu K, Lee DH, Rutt BK. Systematic assessment and evaluation of sliding interleaved kY (SLINKY) acquisition for 3D MRA. J Magn Reson Imaging. 1998;8(4):912–923. doi: 10.1002/jmri.1880080422. [DOI] [PubMed] [Google Scholar]
- 2.Liu K, Rutt BK. Sliding interleaved kY (SLINKY) acquisition: a novel 3D MRA technique with suppressed slab boundary artifact. J Magn Reson Imaging. 1998;8(4):903–911. doi: 10.1002/jmri.1880080421. [DOI] [PubMed] [Google Scholar]
- 3.Parker DL, Yuan C, Blatter DD. MR angiography by multiple thin slab 3D acquisition. Magn Reson Med. 1991;17(2):434–451. doi: 10.1002/mrm.1910170215. [DOI] [PubMed] [Google Scholar]
- 4.Murakami JW, Weinberger E, Tsuruda JS, Mitchell JD, Yuan C. Multislab threedimensional T2-weighted fast spin-echo imaging of the hippocampus: sequence optimization. J Magn Reson Imaging. 1995;5(3):309–315. doi: 10.1002/jmri.1880050315. [DOI] [PubMed] [Google Scholar]
- 5.Oshio K, Jolesz FA, Melki PS, Mulkern RV. T2-weighted thin-section imaging with the multislab three-dimensional RARE technique. J Magn Reson Imaging. 1991;1(6):695–700. doi: 10.1002/jmri.1880010614. [DOI] [PubMed] [Google Scholar]
- 6.Engstrom M, Skare S. Diffusion-weighted 3D multislab echo planar imaging for high signal-to-noise ratio efficiency and isotropic image resolution. Magn Reson Med. 2013 doi: 10.1002/mrm.24594. 10.1002/mrm.24594. [DOI] [PubMed] [Google Scholar]
- 7.Van AT, Hernando D, Sutton BP. Motion-induced phase error estimation and correction in 3D diffusion tensor imaging. IEEE Trans Med Imaging. 2011;30(11):1933–1940. doi: 10.1109/TMI.2011.2158654. [DOI] [PubMed] [Google Scholar]
- 8.Pruessmann KP, Weiger M, Scheidegger MB, Boesiger P. SENSE: sensitivity encoding for fast MRI. Magn Reson Med. 1999;42(5):952–962. [PubMed] [Google Scholar]
- 9.Schmiedeskamp H, Straka M, Bammer R. Compensation of slice profile mismatch in combined spin- and gradient-echo echo-planar imaging pulse sequences. Magn Reson Med. 2012;67(2):378–388. doi: 10.1002/mrm.23012. [DOI] [PMC free article] [PubMed] [Google Scholar]
- 10.Holdsworth SJ, Skare S, Newbould RD, Bammer R. Robust GRAPPA-accelerated diffusion-weighted readout-segmented (RS)-EPI. Magn Reson Med. 2009;62(6):1629–1640. doi: 10.1002/mrm.22122. [DOI] [PMC free article] [PubMed] [Google Scholar]
- 11.Jones DK, Horsfield MA, Simmons A. Optimal strategies for measuring diffusion in anisotropic systems by magnetic resonance imaging. Magn Reson Med. 1999;42(3):515–525. [PubMed] [Google Scholar]
- 12.Haacke EM, Lindskog ED, Lin W. A Fast, Iterative, Partial-Fourier Technique Capable of Local Phase Recovery. Journal of Magnetic Resonance. 1991;92(1):126–145. [Google Scholar]


