

Abstract
Background
Hyperglycemia is a risk factor for nosocomial infections with known host effects. Increased glucose levels also increase pathogenicity of infecting microbes through greater biofilm formation. The dose response of biofilm formation to glucose concentration is not known.
Questions/purposes
We asked: What is the relationship between the amount of biofilm formed by Staphylococcus epidermidis and Staphylococcus aureus and change in glucose concentration in the clinically important range of 20 to 300 mg/dL?
Methods
This experiment studied biofilm formation by S epidermidis and S aureus in Lennox broth medium supplemented with increasing glucose concentrations from 0 to 320 mg/dL in 20 mg/dL intervals. Biofilm was grown for 24 hours for S epidermidis and 48 hours for S aureus. Biofilms were heat fixed, stained with 0.1% crystal violet, and washed with deionized water. The dye was then extracted with 30% acetic acid. Visual light absorption of the extracted crystal violet dye at 600 nm was used to quantify the biofilm biomass. The effect of glucose concentration on the amount of biofilm mass produced was analyzed using ANOVA and Tukey’s test.
Results
Biofilm mass was increased at higher glucose concentration for both species with a threshold response at 0 to 20 and 160 to 200 mg/dL for S epidermidis and 200 to 240 mg/dL for S aureus.
Conclusions
Increased biofilm growth by S aureus and S epidermidis has a threshold response at clinically important concentrations.
Clinical Relevance
Postoperative hyperglycemia may increase the risk for implant infection through increased pathogenicity of intraoperative wound contaminants in addition to compromising host immune status.
Introduction
Diabetes mellitus has been linked to postoperative infections and nosocomial infections [1, 10, 13, 14, 22]. Pomposelli et al. [19] reported a 2.7-fold increase in nosocomial infection rate when blood glucose levels were more than 220 mg/dL. Endogenous glycation from elevated blood glucose leads to cellular dysfunction in soft tissues that must heal after surgery and decreased immune response, both cellular and humeral [1, 8, 16, 23], thus compromising a host’s ability to prevent intraoperative contamination from developing a surgical site infection.
It is known that implant infections are caused by biofilm-forming bacteria [12]. The amount of biofilm bacteria form in vitro is reported to be increased with increased glucose concentration through the accessory gene regulator (agr) pathway. Studies that use fluorescent microbes document increased biofilm thickness on confocal microscopy [7, 18]. Low pH of the local cellular environment in the presence of glucose has also been shown to increase biofilm formation through decreased agr expression [20]. However, not all bacteria exhibit the same magnitude of increased biofilm formation in response to high glucose levels. Kwasny and Opperman [17] found that the increase in biofilm production is different across individual strains of several different bacterial species when exposed to high glucose concentrations (1000 mg/dL). Reśliński and Dabrowiecki [21] reported an increase in the number of cells in the biofilms of Staphylococcus aureus with exposure to glucose at 100 or 200 mg/dL, but they did not see a similar increase for Escherichia coli. Croes et al. [11] reported greater biofilm formation by methicillin-resistant Staphylococcus aureus than methicillin-susceptible Staphylococcus aureus at 250 and 500 mg/dL glucose in vitro. These reported data establish that biofilm formation increases when bacteria are grown in the presence of higher glucose concentrations; however, few concentrations were studied that span the hyperglycemic range of 100 to 500 mg/dL without incremental detail to determine the dose response of biofilm formation to glucose levels throughout the clinically important range of 20 to 300 mg/dL. It is important to know how the severity of abnormal glucose levels, high or low, affect microbe pathogenicity.
We therefore asked the following question: What is the relationship between the amount of biofilm formed by S epidermidis and S aureus and change in glucose concentration in the clinically important range of 20 to 300 mg/dL?
Materials and Methods
Bacteria Selection
Two highly characterized bacterial strains representative of orthopaedic pathogens were selected: S epidermidis (ATCC 35984) and S aureus (ATCC 49230, UAMS-1). S epidermidis and S aureus account for approximately 50% of orthopaedic infections [9]. UAMS-1 is a clinical isolate reference strain commonly used for investigations related to orthopaedic infections [18]. ATCC 35984 is known to be a robust and rapid biofilm-forming organism [17]. Both ATCC 35984 [4] and UAMS-1 [6] are known to be slime-producing organisms carrying the intercellular adhesion (ica) operon, as determined by the Congo red agar test [5].
Biofilm Growth
Biofilms were grown in accordance with the methods reported by Kwasny and Opperman [17]. The growth medium used in our study was Lennox broth (Alfa Aesar, Ward Hill, MA, USA), a glucose-free medium suitable for bacterial growth. We added known amounts of glucose to produce specific glucose concentrations. Bacteria were grown overnight in glucose-free Lennox broth and then diluted 100-fold in Lennox broth containing one of 17 glucose concentrations from 0 to 320 mg/dL in 20-mg/dL intervals. Two hundred milliliters of the bacterial suspension of each bacterial species, for each glucose concentration, was seeded in 96-well tissue culture-treated plates (Sarstedt, Newton, NC, USA) and incubated at 37 °C without shaking. S epidermidis was incubated for 24 hours and S aureus for 48 hours; the longer time was necessary to produce enough biofilm mass for assay. Control groups that had no glucose supplementation or no bacteria present were included for each arm of the experiment. The medium was removed from each well, and the adherent biofilm was washed four times by gentle immersion in deionized water, heat fixed at 60 °C for 1 hour, and stained with 0.2 mL of 0.1% crystal violet dye (Best Science Supplies, Big Pine Key, FL, USA) for 15 minutes [17]. The crystal violet dye was removed from the wells and the excess dye washed from the surface of the biofilm four times by gentle immersion in deionized water. Finally, the crystal violet dye was extracted from the stained biofilm using 0.2 mL of 30% acetic acid for 15 minutes. A 0.2-mL sample of the extracted crystal violet dye was transferred to unused wells in the 96-well plate and quantified by light absorbance at 600 nm using a FLUOstar Omega Multiplate Reader (BMG Labtech, Cary, NC, USA).
Statistical Analysis
Differences in the amount of biofilm formed (absorbance at 600 nm) were analyzed using ANOVA and post hoc Tukey’s tests for multiple comparisons to determine which concentrations were significantly different from each other. Thresholds were determined based on post hoc groupings generated by Tukey’s test for multiple comparisons. Groupings identified by Tukey’s test are reproduced (Table 1). Where applicable for ANOVA analysis, standard normal plots of residuals were constructed to determine whether the ANOVA model was well behaved [3]. All analyses were performed using Minitab 15 (Minitab Inc, State College, PA, USA).
Table 1.
Comparison of biofilm growth (as measured by crystal violet absorbance) at varying glucose concentrations in the two bacterial strains
| Glucose concentration (mg/dL) | Crystal violet absorbance* | |||
|---|---|---|---|---|
| Staphylococcus epidermidis | Tukey grouping (p < 0.05) | Staphylococcus aureus | Tukey grouping (p < 0.05) | |
| 0 | 1.6 (1.55–1.75) | A | 0.19 (0.14–0.24) | A |
| 20 | 2.19 (1.99–2.39) | B | 0.18 (0.13–0.23) | A |
| 40 | 2.35 (2.15–2.55) | BC | 0.18 (0.14–0.24) | A |
| 60 | 2.35 (2.15–2.55) | BC | 0.21 (0.16–0.26) | A |
| 80 | 2.60 (2.15–2.55) | BC | 0.24 (0.19–0.29) | A |
| 100 | 2.39 (2.19–2.59) | BC | 0.20 (0.16–0.26) | A |
| 120 | 2.49 (2.26–2.69) | BC | 0.19 (0.14–0.24) | A |
| 140 | 2.47 (2.26–2.67) | BC | 0.18 (0.12–0.23) | A |
| 160 | 2.38 (2.18–2.58) | BC | 0.19 (0.14–0.24) | A |
| 180 | 2.54 (2.34–2.74) | BCD | 0.21 (0.17–0.27) | A |
| 200 | 3.01 (2.81–3.21) | D | 0.23 (0.19–0.29) | A |
| 220 | 2.61 (2.41–2.81) | BCD | 0.57 (0.51–0.62) | B |
| 240 | 2.85 (2.65–3.05) | CD | 0.68 (0.63–0.73) | B C |
| 260 | 2.93 (2.72–3.13) | D | 0.76 (0.70–0.80) | C |
| 280 | 2.72 (2.51–2.92) | CD | 0.75 (0.69–0.80) | C |
| 300 | 2.92 (2.72–3.12) | D | 0.68 (0.63–0.73) | B C |
| 320 | 2.84 (2.64–3.04) | CD | 0.72 (0.66–0.76) | C |
* Values are expressed as mean, with 95% CI in parentheses; because of the large number of pairwise comparisons, individual p values are not reported; glucose concentrations that do not share a letter had statistically different amounts of biofilm growth at an α level of 0.05.
Results
The amount of biofilm formed was dependent on both glucose concentration and bacterial species. Biofilm formation was affected by bacterial species more than twice as much as by glucose concentration (Table 1). S epidermidis was a more robust biofilm former than S aureus at all glucose concentrations (mean absorbance: 2.6 at 1 day for S epidermidis versus 0.4 at 2 days for S aureus, p < 0.001). Both species tested formed more biofilm at higher glucose concentration with a threshold response (Table 1). The S epidermidis threshold was at glucose concentrations of 0 to 20 and 160 to 200 mg/dL, as shown by crystal violet staining (Fig. 1) and crystal violet absorbance (Fig. 2); the increase in biofilm formation was 36% and 26%, respectively. The S aureus threshold occurred at a glucose concentration of 200 to 240 mg/dL, as shown by crystal violet staining (Fig. 3) and crystal violet absorbance (Fig. 4), and was associated with 196% increase in biofilm formation. There was no biofilm formation or surface accumulation of solids from the medium in controls where bacteria were absent.
Fig. 1A–B.
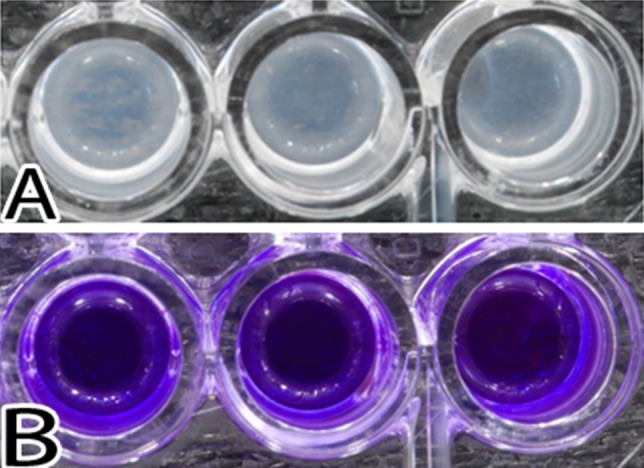
Images illustrate S epidermidis growth after 24 hours of exposure. (A) The biofilms present in the wells after removal of the medium are shown. (B) The resultant stain with crystal violet is shown.
Fig. 2.

A graph shows S epidermidis growth as a function of glucose concentration. There are increases in biofilm formation at glucose concentration thresholds of 0 to 20 and 160 to 200 mg/dL. Horizontal line = median; box = 25% and 75% of data; whiskers = 1.5 × box height; * = outliers.
Fig. 3A–B.
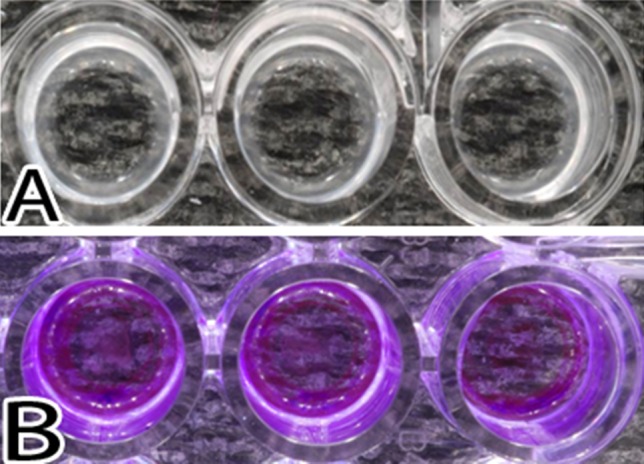
Images illustrate S aureus growth after 48 hours of exposure. (A) The biofilms present in the wells after removal of the medium are shown. (B) The resultant stain with crystal violet is shown.
Fig. 4.

A graph shows S aureus growth as a function of glucose concentration. There is a substantial increase in biofilm production beyond a glucose concentration threshold of 200 to 240 mg/dL. Horizontal line = median; box = 25% and 75% of data; whiskers = 1.5 × box height; * = outliers.
Discussion
Increased biofilm formation by staphylococcal species has been reported in response to increased glucose concentrations. This finding is clinically relevant because biofilm production is related to pathogenicity of organisms causing implant infections. The published data span the hyperglycemic range (100–500 mg/dL) without sufficient detail to fully understand the relationship between biofilm formation and glucose concentration throughout the range encountered in clinical practice (20–300 mg/dL) [11]. Accepting the association between hyperglycemia and increased risk of nosocomial infections, it is important to know how the severity of abnormal glucose level, high or low, is related to microbe pathogenicity. We therefore determined the relationship between the amount of biofilm formed by S epidermidis and S aureus and change in glucose concentration in the clinically important range of 20 to 300 mg/dL. We found that biofilm mass was increased at higher glucose concentration for both species with a threshold response at 0 to 20 and 160 to 200 mg/dL for S epidermidis and 200 to 240 mg/dL for S aureus.
There are several limitations to this study. First, biofilm formation was only studied in vitro. Our study was performed using a culture medium that does not include many of the dissolved proteins or antibacterial peptides present in human blood and extracellular fluid. It is not known what effect these proteins would have on the findings. Secondly, we did not track the glucose level or pH of the growth medium. Glucose level and pH likely decreased during incubation for biofilm formation. While other authors report that increased biofilm formation may in part be due to changes in pH when glucose is present [20], most reports do not document these variables. We focused on the behavior of the microbes in response to starting glucose concentration. Some of the increase we measured in biofilm growth may be due to decreasing pH, and decreasing glucose concentration likely reduced the effect caused by high glucose levels. Documenting or controlling pH and glucose level throughout the incubation period would be warranted in future work. Thirdly, we only studied two staphylococcal species. There are many other clinically relevant bacteria. Our findings (threshold increased in biofilm formation from increased glucose concentration) are the response for single strains of two staphylococcal species. The response in other bacterial pathogens may not be the same [22]. Reśliński and Dabrowiecki [21] reported an increase in the number of viable bacteria and an increase in the proportion of strains that were heavy biofilm formers caused by increased glucose concentration (100 and 200 mg/dL) for 70 strains of S aureus but the opposite for 70 strains of E coli. Croes et al. [11] reported an increasing percentage of S aureus strains that were heavy biofilm formers with increasing glucose concentration (100, 250, 500 mg/dL) in 280 strains of S aureus. Agarwal and Jain [2] reported increased biofilm production by clinical isolates of Staphylococcus regardless of the presence of the ica operon. Considering the threshold response found in our more incremental data, these previously published data can be explained by a threshold relationship in each strain that occurs at a different concentration, leading to a different proportion of the strains that are heavy biofilm formers at differing concentrations. Fourth, we studied single-organism biofilms. Clinical infections are frequently polymicrobial even when only a single pathogen is isolated. It is unknown how the presence of other organisms would affect the biofilm formation response to glucose concentration.
The relatively slower biofilm production of the UAMS-1 strain of S aureus compared to S epidermidis in our study is also interesting. Although Nelson et al. [18] reported UAMS-1 readily formed biofilm in vivo, our experience [17] is that establishing in vivo infection in rabbits is highly site specific when using UAMS-1. Even with higher inoculums than those used by Nelson et al. [18], an active infection may not establish at some anatomic locations or in the absence of a surface (implant/devascularized bone) [18]. UAMS-1 is not a heavy biofilm former, despite its ability to form slime and its clinical virulence [15]. Increased biofilm formation occurred at a threshold increase in glucose concentration for both staphylococcal species that we studied. This threshold response was unexpected yet was confirmed on multiple replicates. The threshold occurred at a lower glucose concentration and the increase in biofilm formation was less pronounced for S epidermidis than for S aureus. This difference may be a real variation between species or it may be attributable to growth saturation in the S epidermidis biofilm at 24 hours. A shorter culture period may have detected a greater increase in biofilm formation with high glucose levels.
The important finding in this in vitro study is that two staphylococcal species have increased biofilm production at a threshold increase of glucose concentration in the clinically important range of 20 to 300 mg/dL. The association between postoperative hyperglycemia and increased postoperative infection rates has generally been attributed to the consequences of hyperglycemia on host immune status. Hyperglycemia-induced pathogenicity of staphylococcal species through increased biofilm formation may also play a role in the increased infection rate.
Footnotes
Each author certifies that he or she, or a member of his or her immediate family, has no funding or commercial associations (eg, consultancies, stock ownership, equity interest, patent/licensing arrangements, etc) that might pose a conflict of interest in connection with the submitted article.”
All ICMJE Conflict of Interest Forms for authors and Clinical Orthopaedics and Related Research ® editors and board members are on file with the publication and can be viewed on request.
This work was performed at Banner Good Samaritan Medical Center, Phoenix, AZ, USA, and at Arizona State University, Tempe, AZ, USA.
References
- 1.Abdallah DY, Jadaan MM, McCabe JP. Body mass index and risk of surgical site infection following spine surgery: a meta-analysis. Eur Spine J. 2013;22:2800–2809. doi: 10.1007/s00586-013-2890-6. [DOI] [PMC free article] [PubMed] [Google Scholar]
- 2.Agarwal A, Jain A. Glucose & sodium chloride induced biofilm production & ica operon in clinical isolates of staphylococci. Indian J Med Res. 2013;138:262–266. [PMC free article] [PubMed] [Google Scholar]
- 3.Altman DG. Practical Statistics for Medical Research. 2. Boca Raton, FL: Chapman & Hall/CRC; 2006. [Google Scholar]
- 4.Arciola CR, Baldassarri L, Montanaro L. Presence of icaA and icaD genes and slime production in a collection of staphylococcal strains from catheter-associated infections. J. Clin Microbiol. 2001;39:2151–2156. doi: 10.1128/JCM.39.6.2151-2156.2001. [DOI] [PMC free article] [PubMed] [Google Scholar]
- 5.Arciola CR, Campoccia D, Gamberini S, Cervellati M, Donati E, Montanaro L. Detection of slime production by means of an optimised Congo red agar plate test based on a colourimetric scale in Staphylococcus epidermidis clinical isolates genotyped for ica locus. Biomaterials. 2002;23:4233–4239. doi: 10.1016/S0142-9612(02)00171-0. [DOI] [PubMed] [Google Scholar]
- 6.Beenken KE, Dunman PM, McAleese F, Macapagal D, Murphy E, Projan SJ, Blevins JS, Smeltzer MS. Global gene expression in Staphylococcus aureus biofilms. J Bacteriol. 2004;186:4665–4684. doi: 10.1128/JB.186.14.4665-4684.2004. [DOI] [PMC free article] [PubMed] [Google Scholar]
- 7.Boles BR, Horswill AR. Agr-mediated dispersal of Staphylococcus aureus biofilms. PLoS Pathog. 2008;4:e1000052. doi: 10.1371/journal.ppat.1000052. [DOI] [PMC free article] [PubMed] [Google Scholar]
- 8.Brownlee M. Biochemistry and molecular cell biology of diabetic complications. Nature. 2001;414:813–820. doi: 10.1038/414813a. [DOI] [PubMed] [Google Scholar]
- 9.Campoccia D, Montanaro L, Arciola CR. The significance of infection related to orthopedic devices and issues of antibiotic resistance. Biomaterials. 2006;27:2331–2339. doi: 10.1016/j.biomaterials.2005.11.044. [DOI] [PubMed] [Google Scholar]
- 10.Colombier S, Kessler U, Ferrari E, von Segesser LK, Berdajs DA. Influence of deep sternal wound infection on long-term survival after cardiac surgery. Med Sci Monit. 2013;19:668–673. doi: 10.12659/MSM.889191. [DOI] [PMC free article] [PubMed] [Google Scholar]
- 11.Croes S, Deurenberg RH, Boumans ML, Beisser PS, Neef C, Stobberingh EE. Staphylococcus aureus biofilm formation at the physiologic glucose concentration depends on the S. aureus lineage. BMC Microbiol. 2009;9:229. doi: 10.1186/1471-2180-9-229. [DOI] [PMC free article] [PubMed] [Google Scholar]
- 12.Diefenbeck M, Mückley T, Hofmann GO. Prophylaxis and treatment of implant-related infections by local application of antibiotics. Injury. 2006;37(suppl 2):S95–S104. doi: 10.1016/j.injury.2006.04.015. [DOI] [PubMed] [Google Scholar]
- 13.Ee WW, Lau WL, Yeo W, Von Bing Y, Yue WM. Does Minimally Invasive Surgery Have a Lower Risk of Surgical Site Infections Compared With Open Spinal Surgery? Clin Orthop Relat Res. 2013 July 12 [Epub ahead of print]. [DOI] [PMC free article] [PubMed]
- 14.Endara M, Masden D, Goldstein J, Gondek S, Steinberg J, Attinger C. The role of chronic and perioperative glucose management in high-risk surgical closures: a case for tighter glycemic control. Plast Reconstr Surg. 2013;132:996–1004. doi: 10.1097/PRS.0b013e31829fe119. [DOI] [PubMed] [Google Scholar]
- 15.Gillaspy AF, Hickmon SG, Skinner RA, Thomas JR, Nelson CL, Smeltzer MS. Role of the accessory gene regulator (agr) in pathogenesis of staphylococcal osteomyelitis. Infect Immun. 1995;63:3373–3380. doi: 10.1128/iai.63.9.3373-3380.1995. [DOI] [PMC free article] [PubMed] [Google Scholar]
- 16.Hachiya H, Miura Y, Inoue KI, Park KH, Takeuchi M, Kubota K. Advanced glycation end products impair glucose-induced insulin secretion from rat pancreatic β-cells. J Hepatobiliary Pancreat Sci. 2014;21:134–141. doi: 10.1002/jhbp.12. [DOI] [PubMed] [Google Scholar]
- 17.Kwasny SM, Opperman TJ. Static biofilm cultures of gram-positive pathogens grown in a microtiter format used for anti-biofilm drug discovery. Curr Protoc Pharmacol. 2010;Chapter 13:Unit 13A.8. [DOI] [PMC free article] [PubMed]
- 18.Nelson CL, Hickmon SG, Skinner RA. Treatment of experimental osteomyelitis by surgical debridement and the implantation of bioerodable, polyanhydride-gentamicin beads. J Orthop Res. 1997;15:249–255. doi: 10.1002/jor.1100150214. [DOI] [PubMed] [Google Scholar]
- 19.Pomposelli JJ, Baxter JK, 3rd, Babineau TJ, Pomfret EA, Driscoll DF, Forse RA, Bistrian BR. Early postoperative glucose control predicts nosocomial infection rate in diabetic patients. JPEN J Parenter Enteral Nutr. 1998;22:77–81. doi: 10.1177/014860719802200277. [DOI] [PubMed] [Google Scholar]
- 20.Regassa LB, Novick RP, Betley MJ. Glucose and nonmaintained pH decrease expression of the accessory gene regulator (agr) in Staphylococcus aureus. Infect Immun. 1992;60:3381–3388. doi: 10.1128/iai.60.8.3381-3388.1992. [DOI] [PMC free article] [PubMed] [Google Scholar]
- 21.Reśliński A, Dabrowiecki S. [Evaluation of the effect of glucose on Staphylococcus aureus and Escherichia coli biofilm formation on the surface of polypropylene mesh] [in Polish] Med Dośw Mikrobiol. 2013;65:19–26. [PubMed] [Google Scholar]
- 22.Søraas A, Sundsfjord A, Sandven I, Brunborg C, Jenum PA. Risk factors for community-acquired urinary tract infections caused by ESBL-producing Enterobacteriaceae—a case-control study in a low prevalence country. PloS One. 2013;8:e69581. doi: 10.1371/journal.pone.0069581. [DOI] [PMC free article] [PubMed] [Google Scholar]
- 23.Tepper OM, Galiano RD, Capla JM, Kalka C, Gagne PJ, Jacobowitz GR, Levine JP, Gurtner GC. Human endothelial progenitor cells from Type II diabetics exhibit impaired proliferation, adhesion, and incorporation into vascular structures. Circulation. 2002;106:2781–2786. doi: 10.1161/01.CIR.0000039526.42991.93. [DOI] [PubMed] [Google Scholar]