

Abstract
OBJECTIVE
Heart rate–corrected QT (QTc) interval is associated with mortality in the general population, but this association is less clear in individuals with type 2 diabetes. We assessed the association of QTc interval with all-cause and cardiovascular disease (CVD) mortality in the Diabetes Heart Study.
RESEARCH DESIGN AND METHODS
We studied 1,020 participants with type 2 diabetes (83% European Americans; 55% women; mean age 61.4 years) who were free of atrial fibrillation, major ventricular conduction defects, and antiarrhythmic therapy at baseline. QT duration was automatically calculated from a standard 12-lead electrocardiogram (ECG). Following American Heart Association/American College of Cardiology Foundation recommendations, a linear scale was used to correct the QT for heart rate. Using Cox regression, risk was estimated per 1-SD increase in QTc interval as well as prolonged QTc interval (>450 ms) vs. normal QTc interval for mortality.
RESULTS
At baseline, the mean (SD) QTc duration was 414.9 ms (18.1), and 3.0% of participants had prolonged QTc. After a median follow-up time of 8.5 years (maximum follow-up time 13.9 years), 204 participants were deceased. In adjusted multivariate models, a 1-SD increase in QTc interval was associated with an 18% higher risk for all-cause mortality (hazard ratio 1.18 [95% CI 1.03–1.36]) and 29% increased risk for CVD mortality (1.29 [1.05–1.59]). Similar results were obtained when QTc interval was used as a categorical variable (prolonged vs. normal) (all-cause mortality 1.73 [0.95–3.15]; CVD mortality 2.86 [1.35–6.08]).
CONCLUSIONS
Heart rate QTc interval is an independent predictor of all-cause and CVD mortality in this population with type 2 diabetes, suggesting that additional prognostic information may be available from this simple ECG measure.
Introduction
Diabetes is a major health problem affecting almost 8.3% (25.8 million) of the U.S. population (1,2). It is associated with significant morbidity and mortality, and is a major risk factor for cardiovascular disease (CVD) (1,2). Type 2 diabetes accounts for 90–95% of all diagnosed cases of diabetes, with higher prevalence among older adults and minority populations (3). Despite the overall increased risk of adverse outcomes associated with type 2 diabetes (4), the risk is not uniform in all affected individuals (5). Thus, evaluation of clinical and laboratory data, imaging, and novel biomarkers may aid in the development of prediction models that can improve our ability to identify diabetes-affected individuals who are at a higher risk. This information, in addition, may be useful for the implementation of cost-effective preventive interventions.
The electrocardiogram (ECG) is a simple noninvasive diagnostic test that is recommended by American Heart Association (AHA) and American College of Cardiology Foundation (ACCF) for CVD risk stratification in patients with hypertension and diabetes (6). Various ECG markers have been evaluated for their prognostic significance, with QT interval (expressed in milliseconds), defined as the interval from the beginning of ventricular depolarization (QRS) to the end of ventricular repolarization (T wave) (7), being the most relevant. For clinical purposes, QT interval represents the electrical repolarization of myocardium, unless QRS is abnormally wide (7). Prolonged QT interval reflects the lengthening of the vulnerable period and thus may increase the risk of dangerous arrhythmias. Many studies (8–10), but not all (11–13), have suggested an association of prolonged QT interval with all-cause and CVD mortality in the general population. This association is less well-understood in high-risk populations such as those with type 2 diabetes. Previous studies involving participants with type 2 diabetes examined relatively small samples of diverse ethnicity, mostly used nonlinear formulas to correct QT interval for heart rate, and produced mixed results (14–19). Prolonged QT interval has also been shown to be correlated with increased risk of incident nonfatal CVD (20,21). Therefore, readily available ECG markers may be useful for further characterizing the risk for adverse outcome in patients with type 2 diabetes.
To build on existing data and to address some of the limitations of previous studies, we sought to examine the hypothesis that heart rate–corrected QT (QTc) interval predicts all-cause and CVD mortality in individuals with type 2 diabetes in the Diabetes Heart Study (DHS).
Research Design and Methods
Study Population
The objectives and design of the DHS have been described previously (22). Briefly, the DHS includes 1,443 participants (84.6% European Americans and 15.4% African Americans) from 564 families with a predominance of type 2 diabetes (84.5%). Participants were recruited predominantly from the community and outpatient internal medicine and endocrinology clinics from 1998 through 2005 in western North Carolina. Letters describing the study were sent to patients receiving care in the Wake Forest Baptist Hospital health system. These letters contained a telephone number for individuals to call if they were interested in participating. Potential participants were first interviewed by telephone for potential eligibility and then, if appropriate, scheduled for the examination visit, where informed consent documents were reviewed and signed. Prior to the examination visit, questionnaires and a copy of the informed consent form were sent to the subjects for review. A similar study flow was implemented with people recruited from presentations at health fairs, community outreach programs, and referrals by physicians. All participants provided written informed consent prior to participation, and the study was approved by the Institutional Review Board of Wake Forest School of Medicine. Individuals represent a cross-section of diabetic patients living independently in our community.
For the present investigation, and for the appropriate interpretation of QTc, we included participants (N = 1,020) with type 2 diabetes who were free of atrial fibrillation and did not have major ventricular conduction defects (defined as QRS duration ≥120 ms) (7). We also excluded participants who were taking antiarrhythmic therapy (procainamide [n = 1], flecainide [n = 1], sotalol [n = 2], amiodarone [n = 4]) at baseline. For the current analyses, the follow-up period ended in 2011 after a median time of 8.5 years (maximum 13.9 years).
Data Collection
Participant visits were conducted in the General Clinical Research Center at Wake Forest Baptist Medical Center. Upon enrollment, participants were interviewed by trained personnel for demographic information (age, sex, and race), medical history, medication use, and health behaviors. Type 2 diabetes was defined as a history of doctor-diagnosed diabetes after the age of 35 years that was treated with diet and exercise or oral antihyperglycemic medications. Individuals reporting treatment with insulin alone for more than the first year after diagnosis were excluded from the study. Baseline CVD was defined as a composite of self-reported history of heart attack, coronary artery bypass graft, stroke, coronary angioplasty, or carotid endarterectomy. Anthropometric measurements including height, weight, and waist circumference were measured, and BMI was calculated as weight (in kilograms) divided by height (in square meters). Resting blood pressure was recorded; hypertension was defined as the use of hypertensive medications or a mean resting systolic blood pressure (SBP) ≥140 mmHg or diastolic blood pressure ≥90 mmHg. Fasting blood samples were collected for various biochemical assays, as per the study protocol. These assays included the determination of total cholesterol, HDL cholesterol and LDL cholesterol levels, as estimated by the Friedewald equation (23). Fasting blood glucose (serum) level was measured by the glucose oxidase method on a Vitros analyzer (Johnson & Johnson Ortho Clinical Diagnostics, Rochester, NY). Hemoglobin A1c (HbA1c) was measured by high-performance liquid chromatography. Estimated glomerular filtration rate (eGFR) was calculated by using the Modification of Diet in Renal Disease equation.
QT Interval
A standard, resting 12-lead ECG was obtained using a GE Marquette (Milwaukee, WI) MAC 5000 ECG instrument following a standardized protocol. All ECGs were recorded in the General Clinical Research Center at Wake Forest Baptist Medical Center and were electronically transmitted to a central ECG core laboratory, located at the Epidemiological Cardiology Research Center at Wake Forest School of Medicine, for reading and coding. The QT duration was automatically measured using the GE Marquette 12-SL 2001 interpretive algorithm. The current AHA, ACCF, and Heart Rhythm Society guidelines (7) for ECG interpretation recommend using methods that are based on linear regression function to calculate the heart rate QTc interval. Therefore, we used a sex-specific method described by Rautaharju and Zhang (24), as follows: QTc = QT + k1*(1 − RRk2), where RR = 60/heart rate, k2 = 0.5, k1 = 0.360 for male participants and 0.353 for female participants. We defined prolonged QTc as any value above the cut point of 450 ms based on the recommendations by Rautaharju and Zhang (24) for using 450 ms as a practical upper 5% rate-invariant normal limit when linear rather than proportional scaling of the adjusted QT values if applied (24). In addition, for comparability with previous studies, we also corrected QT for heart rate using Bazett’s formula (QTc-Baz) [QTc-Baz = QT (heart rate/60)1/2] (20,25), again using a cut point of 450 ms.
Ascertainment of Outcomes
For all participants, vital status was determined from the National Social Security Death Index maintained by the U.S. Social Security Administration. For those participants confirmed as deceased, the length of follow-up was determined from the date of the initial study visit to the date of death. For deceased participants, copies of death certificates were obtained from relevant county vital records offices to confirm the cause of death. For all other participants, the length of follow-up was determined from the date of the initial study visit to the end of 2011. Cause of death was categorized based on information contained in death certificates as CVD mortality (myocardial infarction, congestive heart failure, cardiac arrhythmia, sudden cardiac death, peripheral vascular disease, and stroke), or cancer, infection, end-stage renal disease, accidental, or other (including obstructive pulmonary disease, pulmonary fibrosis, liver failure and Alzheimer’s dementia).
Statistical Analysis
Baseline characteristics were described as the mean (SD) for continuous variables and frequency (percentage) for categorical variables. Unadjusted analysis for between-group comparisons was performed by unpaired t test for continuous variables and χ2 test for categorical variables. Incidence rates (IRs) of mortality were calculated for the entire cohort and separately for groups with prolonged and normal QTc intervals. Relative risk (RR) was calculated for prolonged vs. normal QTc interval, and statistical significance was calculated by using the Wald χ2 procedure. Kaplan-Meier analysis was performed to examine survival between groups with prolonged vs. normal QTc intervals; survival estimates were compared using a log-rank test. Using QTc as a continuous variable, mortality risk was estimated per 1-SD increase in QTc. Cox regression was used to examine the association of QTc interval with mortality. When the end point is all-cause mortality, censoring may occur if one is alive. When the end point is CVD mortality, censoring may occur if one is alive or the death is due to other causes. Incremental models were constructed as follows: model 1, unadjusted; model 2, adjusted for age, sex, and ethnicity; model 3, additionally adjusted for BMI, HbA1c, diabetes duration, SBP, antihypertensive medications, total cholesterol, triglyceride, current smoking, and eGFR; and model 4, additionally adjusted for history of CVD. In addition, we repeated all models with QTc as a categorical variable (prolonged vs. normal). Proportionality assumption (hazard function is proportional over time for the two strata for any given values of predictor variable) was assessed by introducing time-dependent covariates in the full model. For comparability with previous studies, we also determined the QTc-Baz interval and repeated these models. All analyses described above were repeated for the outcome of CVD mortality. We tested for interaction between QTc and sex and ethnicity. Statistical significance was accepted at a two-sided P value <0.05. All analyses were performed using SAS software, version 9.2 (SAS Institute, Cary, NC).
Results
Baseline Characteristics
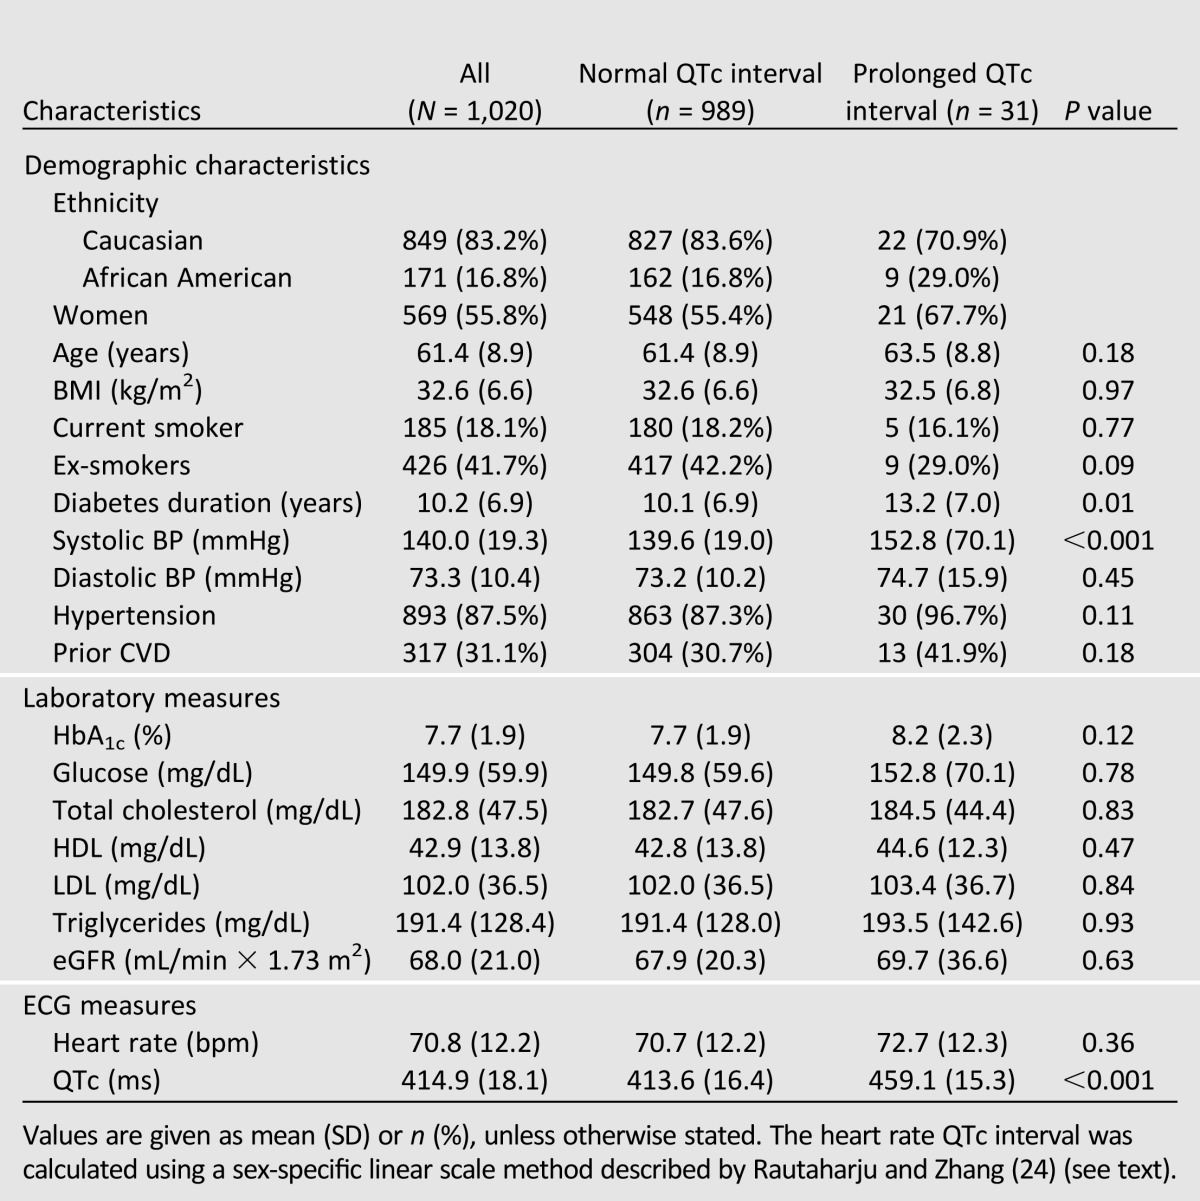
At baseline, mean age, diabetes duration, QTc interval, and heart rate were 61.4 years, 10.2 years, 414.9 ms, 71 bpm, respectively (Table 1). There were more women (55.8%) in the study, and the majority of participants were European Americans (83.2%). Three percent of participants had a prolonged QTc interval >450 ms, as opposed to 8.6% for QTc-Baz interval (Supplementary Table 1). Groups with normal vs. prolonged QTc intervals were comparable except for diabetes duration and SBP, both of which were higher in participants with prolonged QTc intervals.
Table 1.
Baseline characteristics: DHS
Heart Rate QTc Interval and All-Cause Mortality
After a median follow-up time of 8.5 years (maximum follow-up time 13.9 years), 204 participants (20%) were deceased. The IRs and RRs of all-cause mortality are shown in Table 2. The RR was much greater with prolonged QTc when compared with normal QTc (RR = 1.99; P = 0.003). In the Cox regression model, each 1-SD increase in QTc was associated with an 18% increase in risk for all-cause mortality (HR 1.18 [95% CI 1.03–1.36]; P = 0.02] after controlling for ethnicity, sex, hypertension, antihypertensive medications, BMI, diabetes duration, HbA1c level, current smoking status, total cholesterol level, triglyceride level, eGFR, and baseline CVD status in the fully adjusted model (Table 3). In Kaplan-Meier analysis, we observed worse survival for participants with prolonged QTc intervals (log-rank test, P = 0.005) when compared with normal QTc intervals (Fig. 1). When used as a categorical variable, prolonged QTc interval was associated with a 73% increase risk of all-cause mortality (1.73 [0.95–3.15]; P = 0.07] after adjusting for covariates, although the 95% CI overlapped the null slightly (Table 3). The interaction between QTc interval and sex was not significant (P = 0.43); nor was the interaction between QTc interval and ethnicity (P = 0.65). Similar results were obtained when QTc interval was used as a categorical variable (P = 0.65 and P = 0.77, respectively, for interaction with sex and ethnicity).
Table 2.
IRs of mortality: DHS
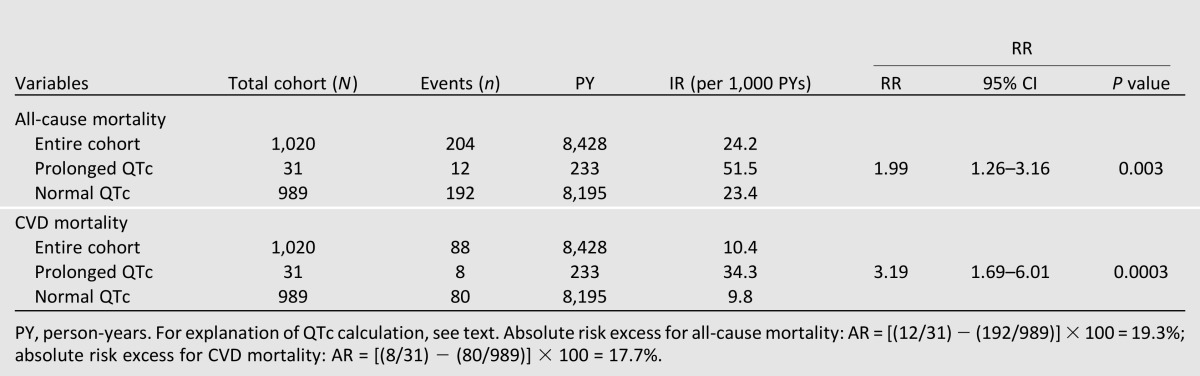
Table 3.
Association of heart rate QTc interval with mortality: DHS
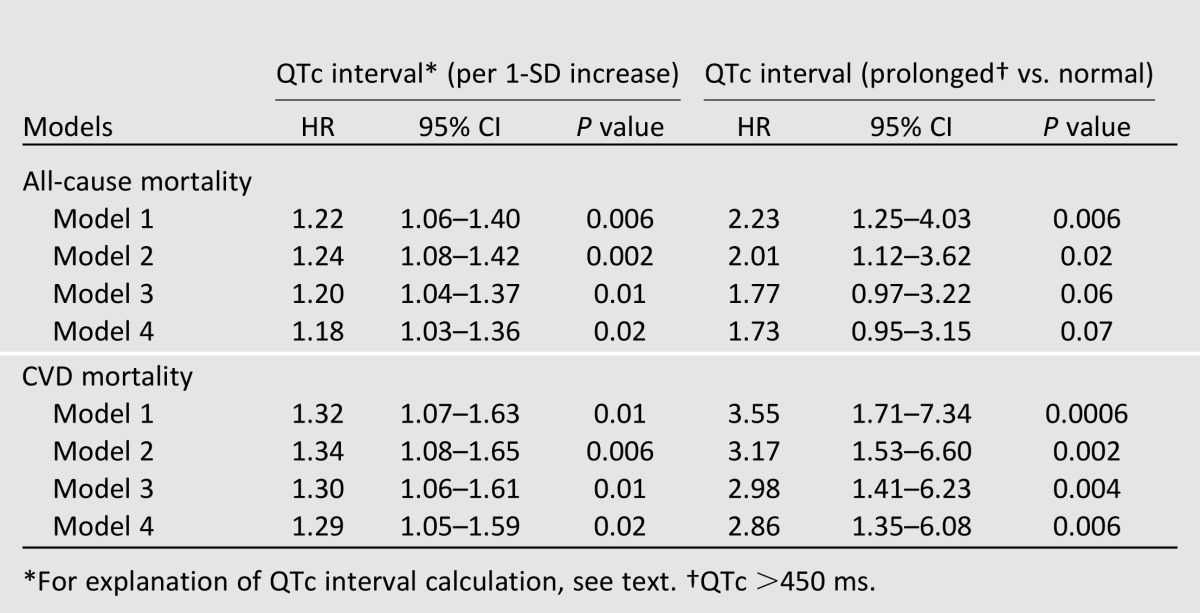
Figure 1.

Mortality risk associated with prolonged (>450 ms) vs. normal heart rate QTc interval: DHS.
When QTc-Baz interval was used as a predictor (Supplementary Table 2), we found similar associations of every 1-SD increase in QTc-Baz with all-cause mortality (HR 1.21 [95% CI 1.05–1.39]; P = 0.008]. However, the results were not significant when QTc-Baz was used as a categorical variable (1.09 [0.67–1.76]; P = 0.72].
In the sensitivity analysis, we did not exclude participants with prolonged QRS duration (n = 86) and repeated Cox regression models in the total cohort (n = 1,106) to examine the association of QTc (continuous variable) with all-cause mortality (total number of deaths 239). We found that the results were statistically significant in all models (Supplementary Table 3).
Heart Rate QTc Interval and CVD Mortality
After the same follow-up period (median follow-up 8.5 years; maximum follow-up 13.9 years), 88 participants (43% of total deceased participants) died as a result of CVD causes. Prolonged QTc duration carried a higher RR for CVD mortality when compared with normal QTc duration (RR = 3.19; P = 0.0003; Table 2). Each 1-SD increase in QTc duration was associated with a 31% increased risk of CVD mortality (HR 1.29 [95% CI 1.05–1.59]; P = 0.02) after controlling for age, sex, ethnicity, diabetes duration, HbA1c level, BMI, total cholesterol level, triglyceride level, hypertension, antihypertensive medications, current smoking status, eGFR, and history of CVD (Table 3). Kaplan-Meier analysis showed worse survival for participants with prolonged QTc duration (log-rank test, P = 0.0003) when compared with normal QTc duration (Fig. 1). In addition, in the fully adjusted Cox regression model, we found a stronger association between prolonged QTc duration and CVD death (2.86 [1.35–6.08]; P = 0.006) (Table 3). We did not find any significant interaction between sex and QTc duration as a continuous variable (P = 0.76) or a categorical variable (P = 0.19). Similarly, interaction with ethnicity was also not significant (P = 0.73 for QTc as a continuous variable; P = 0.60 for QTc as a categorical variable).
Using QTc-Baz duration as a continuous variable, we obtained similar results (Supplementary Table 2); every 1-SD increase in QTc-Baz duration was associated with a 31% increase in CVD mortality (P = 0.01). However, the results were not significant when QTc-Baz was used as a categorical variable (HR 1.33 [95% CI 0.68–2.61]; P = 0.40).
In sensitivity analysis without excluding participants with prolonged QRS duration, we observed similar results for the association of QTc with CVD mortality (number of deaths due to CVD = 104) (Supplementary Table 3).
Conclusions
In this study of mostly European American adults with type 2 diabetes living in the community, we found that QTc interval was an independently associated predictor of all-cause and CVD mortality after a maximum of 13.9 years of follow-up. This finding suggests that this simple ECG marker may provide additional prognostic information in patients with type 2 diabetes. This risk association with QTc interval adds to previous reports from the DHS that have identified coronary artery calcium level (26) and C-reactive protein level (27) as predictors of mortality in this high-risk cohort.
Diabetes is a risk factor for incident CVD and CVD mortality, and is considered a coronary heart disease risk equivalent (4,28). However, excess risk of mortality in persons with type 2 diabetes cannot be fully explained by CVD or known CVD risk factors (29,30), thereby providing an opportunity to identify additional markers for better risk assessment. It is suggested that individuals with diabetes do not form a homogeneous group, and there is wide variation in individual risk profile for outcomes (31). Stratification of type 2 diabetes–affected individuals based on key clinical indicators and a risk factor profile is essential for effective patient management. In this study, the association of QTc interval with mortality persisted even after controlling for traditional cardiovascular risk factors and baseline CVD, suggesting that QTc interval is an additional tool for examining risk in high-risk type 2 diabetes cohorts. We acknowledge that the finding of an association between prolonged QTc interval and all-cause and CVD mortality does not establish a causal relationship. Likewise, the hypothesis that QTc interval is a therapeutic target needs confirmation in future studies. However, it is possible that prolonged QTc interval is merely a surrogate biomarker representing complex underlying pathophysiological processes including subclinical atherosclerosis and diabetic cardiomyopathy. Further, as the duration of diabetes is associated with prolonged QTc here, future research examining the effects of diabetes duration, severity, and treatment on QTc duration may help to further resolve the pathophysiology of QTc prolongation in individuals with diabetes.
A number of studies have assessed the role of QTc as a prognostic marker in the general population with mixed results, although the results have been somewhat more consistent in patients with underlying coronary artery disease (10,11,21,32,33). QTc interval was not associated with total mortality, sudden cardiac death, or fatal CAD events over 30 years in the Framingham Heart Study (13) or with all-cause and CVD mortality over 9 years in a large Finnish population-based Health 2000 Study (12). In contrast, a QTc interval of >450 ms was significantly associated with all-cause and coronary heart disease mortality in the Cardiovascular Heart Study (8), and in a meta-analysis including multiple studies, Zhang et al. (10) demonstrated a positive association of prolonged QTc interval with mortality outcomes in the general population despite methodological heterogeneity across studies. From a preventative medical point of view, if prolonged QTc interval can prognosticate adverse cardiovascular outcomes in individuals with type 2 diabetes, increased emphasis can be given to primary and secondary prevention strategies to mitigate this cardiovascular risk.
In patients with type 2 diabetes, the patterns of association are similarly mixed. While some of the previous studies including participants with type 2 diabetes report the QTc interval to be predictive of outcome, they were based on small sample sizes (15,19,34), were conducted in ethnic minority groups (16,35), and used nonlinear formulas (mostly Bazett’s formula) to correct the QT interval for heart rate, which is now discouraged by the current guidelines. In contrast to the studies mentioned above, our study has a well-defined prospective cohort of nonhospitalized American individuals with type 2 diabetes and high-quality ECG data. Furthermore, we have used a linear formula for heart rate correction as suggested by current guidelines.
The QT interval is affected by heart rate in an inverse relationship, and a number of formulas have been developed to calculate heart rate QTc interval. Almost all of these formulas have certain limitations and do not perform very well at very high or low heart rates (36). At present, the AHA/ACCF/Heart Rhythm Society recommend using a linear regression function for heart rate correction, and the use of nonlinear formulas, especially Bazett’s formula, which overcorrects QT interval at fast heart rates and undercorrects it at low heart rates, is discouraged (7). In this study, we used a sex-specific linear scaling method to adjust QT interval for heart rate as per guidelines using the method described by Rautaharju and Zhang (24). However, to compare our results with previous studies, we also used Bazett’s formula for heart rate correction. We observed that the results were similar when QTc and QTc-Baz intervals were used as continuous variables in the Cox regression models. However, when a cut point was used to categorize heart rate QTc interval into prolonged vs. normal interval, the results became inconsistent; the association between prolonged QTc-Baz interval and mortality failed to reach statistical significance in any of the models for all-cause and CVD mortality (Supplementary Table 2), suggesting that here QTc-Baz was not useful for detecting individuals at increased risk of adverse outcome. Our findings are similar to existing reports and underscore the problems with using cut points for QTc-Baz interval (7), including the potential for spurious estimation of QTc interval using Bazett’s formula and subsequent misclassification of prolonged QTc interval using the 450 ms cut point (20).
Previous studies have reported much higher prevalences of prolonged QTc interval compared with our observations in the DHS. In a study of >3,000 Chinese individuals with type 2 diabetes, 30% of the sample had prolonged QTc intervals (37), close to 26% in an Italian cohort with type 2 diabetes (38), and >65% in a small Caucasian cohort (15). However, in our study of individuals with type 2 diabetes, the prevalence of prolonged QTc was 3% (8.6% with QTc-Baz; Supplementary Table 1). This low prevalence is clearly a limitation in our analyses of normal vs. prolonged QTc interval. The reasons for these variations are not entirely clear, although technical, methodological, and varying patient characteristics may partly explain these variations. In a similar way, the exact mechanism for abnormalities of QTc interval remains unclear. Numerous pathophysiologic processes affecting the myocardium have been suggested to alter myocardial electrical properties. These include aging, microvascular and macrovascular ischemic heart disease, hyperglycemia, cardiac autonomic neuropathy, formation of advanced glycation end products, oxidative stress, inflammation, myocardial fibrosis, left ventricular hypertrophy, and endothelial dysfunction (39). Clearly, in individuals with type 2 diabetes many of these processes are likely to be at play, and could be considered as underpinning the relationships between QTc and outcome that we observed. However, further research is warranted to clarify these mechanisms.
We would like to acknowledge certain limitations of our study. The study sample consisted only of type 2 diabetes-affected individuals with extended diabetes duration and with multiple existing CVD risk factors. Therefore, our findings cannot be extended to individuals without diabetes. We only have a single measure of QT interval at initial enrollment, and therefore any variation during the follow-up period could not be assessed in our study. Although we have adjusted for known clinical risk factors, residual confounding may still be present as this was an observational study. For example, neuropathy data were not collected as part of the DHS clinical assessment, and autonomic neuropathy has been reported previously to be associated with prolonged QT interval (40). Furthermore, cause of death information was collected from death certificates, and therefore there is a chance of misclassification for CVD mortality. On the latter point, the proportion of deaths attributed to CVD (43%) is relatively similar when compared with previous reports (41). Last, our study cohort consisted mostly of European Americans and only a small proportion of African Americans. Therefore, these results may not be applicable to other ethnic groups.
The main strength of our study is the fact that DHS is a cohort study of community-based diabetic patients with long follow-up times. Therefore, the results are likely representative of ongoing processes in a general population of patients with type 2 diabetes. In addition, our study supports the utility of an easily available clinical measure in the risk assessment of individuals with a highly prevalent and important medical condition who are at increased risk of mortality.
In conclusion, in this longitudinal study of a population with type 2 diabetes, heart rate QTc interval is independently associated with all-cause and CVD mortality after adjusting for traditional risk markers and after a maximum follow-up time of 13.9 years, suggesting that additional prognostic information may be available from this simple ECG measure. This information may provide a clinical basis for further diagnostic testing in selected individuals; this hypothesis, however, requires confirmation. Additional work is also warranted to examine the role of targeted interventions to lower this risk.
Supplementary Material
Article Information
Acknowledgments. The authors thank the investigators, the staff, and the participants of the Diabetes Heart Study for their valuable contributions.
Funding. This work was supported by CVD Epidemiology Training grant 5T32-HL-076132 (Principal Investigator: Dr. David M. Herrington); National Institutes of Health grants R01- HL-92301, R01-HL-67348, R01-NS-058700, and R01-AR-48797; and General Clinical Research Center of the Wake Forest University School of Medicine grants M01-RR-07122 and F32-HL-085989.
The findings and conclusions in this report are those of the authors and do not necessarily represent the views of the funding agencies.
Duality of Interest. No potential conflicts of interest relevant to this article were reported.
Author Contributions. A.J.C., S.R.A., A.G.B., J.J.C., B.I.F., D.M.H., and D.W.B. contributed to the discussion, and reviewed and edited the manuscript. A.A. designed the study; researched data; performed statistical analyses; wrote, reviewed, and edited the manuscript; and contributed to the discussion. J.Y. and E.Z.S. contributed to the study design, methods, and discussion; and reviewed and edited the manuscript. A.A. is the guarantor of this work and, as such, had full access to all the data in the study and takes responsibility for the integrity of the data and the accuracy of the data analysis.
Footnotes
This article contains Supplementary Data online at http://care.diabetesjournals.org/lookup/suppl/doi:10.2337/dc13-1257/-/DC1.
References
- 1.Centers for Disease Control and Prevention. National Diabetes Fact Sheet, 2011 [article online], 2011. Atlanta, GA, Centers for Disease Control and Prevention, Department of Health and Human Services. Available from http://www.cdc.gov/diabetes/pubs/pdf/ndfs_2011.pdf
- 2.Roger VL, Go AS, Lloyd-Jones DM, et al. American Heart Association Statistics Committee and Stroke Statistics Subcommittee Heart disease and stroke statistics—2012 update: a report from the American Heart Association. Circulation 2012;125:e2–e220 [DOI] [PMC free article] [PubMed] [Google Scholar]
- 3.American Diabetes Association Diagnosis and classification of diabetes mellitus. Diabetes Care 2011;34(Suppl. 1):S62–S69 [DOI] [PMC free article] [PubMed] [Google Scholar]
- 4.National Cholesterol Education Program (NCEP) Expert Panel on Detection, Evaluation, and Treatment of High Blood Cholesterol in Adults (Adult Treatment Panel III) Third Report of the National Cholesterol Education Program (NCEP) Expert Panel on Detection, Evaluation, and Treatment of High Blood Cholesterol in Adults (Adult Treatment Panel III) final report. Circulation 2002;106:3143–3421 [PubMed] [Google Scholar]
- 5.Paynter NP, Mazer NA, Pradhan AD, Gaziano JM, Ridker PM, Cook NR. Cardiovascular risk prediction in diabetic men and women using hemoglobin A1c vs diabetes as a high-risk equivalent. Arch Intern Med 2011;171:1712–1718 [DOI] [PMC free article] [PubMed] [Google Scholar]
- 6.Greenland P, Alpert JS, Beller GA, et al. American College of Cardiology Foundation/American Heart Association Task Force on Practice Guidelines 2010 ACCF/AHA guideline for assessment of cardiovascular risk in asymptomatic adults: a report of the American College of Cardiology Foundation/American Heart Association task force on practice guidelines. Circulation 2010;122:e584–e636 [DOI] [PubMed] [Google Scholar]
- 7.Rautaharju PM, Surawicz B, Gettes LS, et al. American Heart Association Electrocardiography and Arrhythmias Committee, Council on Clinical Cardiology. American College of Cardiology Foundation. Heart Rhythm Society. Endorsed by the International Society for Computerized Electrocardiology AHA/ACCF/HRS recommendations for the standardization and interpretation of the electrocardiogram: part IV: the ST segment, T and U waves, and the QT interval: a scientific statement from the American Heart Association Electrocardiography and Arrhythmias Committee, Council on Clinical Cardiology; the American College of Cardiology Foundation; and the Heart Rhythm Society. J Am Coll Cardiol 2009;53:982–991 [DOI] [PubMed] [Google Scholar]
- 8.Robbins J, Nelson JC, Rautaharju PM, Gottdiener JS. The association between the length of the QT interval and mortality in the Cardiovascular Health Study. Am J Med 2003;115:689–694 [DOI] [PubMed] [Google Scholar]
- 9.Straus SM, Kors JA, De Bruin ML, et al. Prolonged QTc interval and risk of sudden cardiac death in a population of older adults. J Am Coll Cardiol 2006;47:362–367 [DOI] [PubMed] [Google Scholar]
- 10.Zhang Y, Post WS, Blasco-Colmenares E, Dalal D, Tomaselli GF, Guallar E. Electrocardiographic QT interval and mortality: a meta-analysis. Epidemiology 2011;22:660–670 [DOI] [PMC free article] [PubMed] [Google Scholar]
- 11.Montanez A, Ruskin JN, Hebert PR, Lamas GA, Hennekens CH. Prolonged QTc interval and risks of total and cardiovascular mortality and sudden death in the general population: a review and qualitative overview of the prospective cohort studies. Arch Intern Med 2004;164:943–948 [DOI] [PubMed] [Google Scholar]
- 12.Porthan K, Viitasalo M, Jula A, et al. Predictive value of electrocardiographic QT interval and T-wave morphology parameters for all-cause and cardiovascular mortality in a general population sample. Heart Rhythm 2009;6:1202–1208 [DOI] [PubMed] [Google Scholar]
- 13.Goldberg RJ, Bengtson J, Chen ZY, Anderson KM, Locati E, Levy D. Duration of the QT interval and total and cardiovascular mortality in healthy persons (The Framingham Heart Study experience). Am J Cardiol 1991;67:55–58 [DOI] [PubMed] [Google Scholar]
- 14.Linnemann B, Janka HU. Prolonged QTc interval and elevated heart rate identify the type 2 diabetic patient at high risk for cardiovascular death. The Bremen Diabetes Study. Exp Clin Endocrinol Diabetes 2003;111:215–222 [DOI] [PubMed] [Google Scholar]
- 15.Christensen PK, Gall MA, Major-Pedersen A, et al. QTc interval length and QT dispersion as predictors of mortality in patients with non-insulin-dependent diabetes. Scand J Clin Lab Invest 2000;60:323–332 [DOI] [PubMed] [Google Scholar]
- 16.Okin PM, Devereux RB, Lee ET, Galloway JM, Howard BV, Strong Heart Study Electrocardiographic repolarization complexity and abnormality predict all-cause and cardiovascular mortality in diabetes: the strong heart study. Diabetes 2004;53:434–440 [DOI] [PubMed] [Google Scholar]
- 17.Salles GF, Bloch KV, Cardoso CR. Mortality and predictors of mortality in a cohort of Brazilian type 2 diabetic patients. Diabetes Care 2004;27:1299–1305 [DOI] [PubMed] [Google Scholar]
- 18.Stettler C, Bearth A, Allemann S, et al. QTc interval and resting heart rate as long-term predictors of mortality in type 1 and type 2 diabetes mellitus: a 23-year follow-up. Diabetologia 2007;50:186–194 [DOI] [PubMed] [Google Scholar]
- 19.Ziegler D, Zentai CP, Perz S, et al. KORA Study Group Prediction of mortality using measures of cardiac autonomic dysfunction in the diabetic and nondiabetic population: the MONICA/KORA Augsburg Cohort Study. Diabetes Care 2008;31:556–561 [DOI] [PubMed] [Google Scholar]
- 20.Soliman EZ, Howard G, Cushman M, et al. Prolongation of QTc and risk of stroke: the REGARDS (REasons for Geographic and Racial Differences in Stroke) study. J Am Coll Cardiol 2012;59:1460–1467 [DOI] [PMC free article] [PubMed] [Google Scholar]
- 21.Dekker JM, Crow RS, Hannan PJ, Schouten EG, Folsom AR, ARIC Study Heart rate-corrected QT interval prolongation predicts risk of coronary heart disease in black and white middle-aged men and women: the ARIC study. J Am Coll Cardiol 2004;43:565–571 [DOI] [PubMed] [Google Scholar]
- 22.Bowden DW, Cox AJ, Freedman BI, et al. Review of the Diabetes Heart Study (DHS) family of studies: a comprehensively examined sample for genetic and epidemiological studies of type 2 diabetes and its complications. Rev Diabet Stud 2010;7:188–201 [DOI] [PMC free article] [PubMed] [Google Scholar]
- 23.Friedewald WT, Levy RI, Fredrickson DS. Estimation of the concentration of low-density lipoprotein cholesterol in plasma, without use of the preparative ultracentrifuge. Clin Chem 1972;18:499–502 [PubMed] [Google Scholar]
- 24.Rautaharju PM, Zhang ZM. Linearly scaled, rate-invariant normal limits for QT interval: eight decades of incorrect application of power functions. J Cardiovasc Electrophysiol 2002;13:1211–1218 [DOI] [PubMed] [Google Scholar]
- 25.Bazett H. An analysis of the time-relations of electrocardiograms. Heart 1920;7:353–370 [Google Scholar]
- 26.Agarwal S, Morgan T, Herrington DM, et al. Coronary calcium score and prediction of all-cause mortality in diabetes: the Diabetes Heart Study. Diabetes Care 2011;34:1219–1224 [DOI] [PMC free article] [PubMed] [Google Scholar]
- 27.Cox AJ, Agarwal S, M Herrington D, Carr JJ, Freedman BI, Bowden DW. C-reactive protein concentration predicts mortality in type 2 diabetes: the Diabetes Heart Study. Diabet Med 2012;29:767–770 [DOI] [PMC free article] [PubMed] [Google Scholar]
- 28.Barr EL, Zimmet PZ, Welborn TA, et al. Risk of cardiovascular and all-cause mortality in individuals with diabetes mellitus, impaired fasting glucose, and impaired glucose tolerance: the Australian Diabetes, Obesity, and Lifestyle Study (AusDiab). Circulation 2007;116:151–157 [DOI] [PubMed] [Google Scholar]
- 29.Regidor E, Franch J, Seguí M, Serrano R, Rodríguez-Artalejo F, Artola S. Traditional risk factors alone could not explain the excess mortality in patients with diabetes: a national cohort study of older Spanish adults. Diabetes Care 2012;35:2503–2509 [DOI] [PMC free article] [PubMed] [Google Scholar]
- 30.Bozorgmanesh M, Hadaegh F, Sheikholeslami F, Ghanbarian A, Azizi F. Shadow of diabetes over cardiovascular disease: comparative quantification of population-attributable all-cause and cardiovascular mortality. Cardiovasc Diabetol 2012;11:69. [DOI] [PMC free article] [PubMed] [Google Scholar]
- 31.Howard BV, Best LG, Galloway JM, et al. Coronary heart disease risk equivalence in diabetes depends on concomitant risk factors. Diabetes Care 2006;29:391–397 [DOI] [PubMed] [Google Scholar]
- 32.de Bruyne MC, Hoes AW, Kors JA, Hofman A, van Bemmel JH, Grobbee DE. Prolonged QT interval predicts cardiac and all-cause mortality in the elderly. The Rotterdam Study. Eur Heart J 1999;20:278–284 [DOI] [PubMed] [Google Scholar]
- 33.Dekker JM, Schouten EG, Klootwijk P, Pool J, Kromhout D. Association between QT interval and coronary heart disease in middle-aged and elderly men. The Zutphen Study. Circulation 1994;90:779–785 [DOI] [PubMed] [Google Scholar]
- 34.Naas AA, Davidson NC, Thompson C, et al. QT and QTc dispersion are accurate predictors of cardiac death in newly diagnosed non-insulin dependent diabetes: cohort study. BMJ 1998;316:745–746 [DOI] [PMC free article] [PubMed] [Google Scholar]
- 35.Giunti S, Gruden G, Fornengo P, et al. Increased QT interval dispersion predicts 15-year cardiovascular mortality in type 2 diabetic subjects: the population-based Casale Monferrato Study. Diabetes Care 2012;35:581–583 [DOI] [PMC free article] [PubMed] [Google Scholar]
- 36.Karjalainen J, Viitasalo M, Mänttäri M, Manninen V. Relation between QT intervals and heart rates from 40 to 120 beats/min in rest electrocardiograms of men and a simple method to adjust QT interval values. J Am Coll Cardiol 1994;23:1547–1553 [DOI] [PubMed] [Google Scholar]
- 37.Li X, Ren H, Xu ZR, Liu YJ, Yang XP, Liu JQ. Prevalence and risk factors of prolonged QTc interval among Chinese patients with type 2 diabetes. Exp Diabetes Res 2012;2012:234084. [DOI] [PMC free article] [PubMed] [Google Scholar]
- 38.Veglio M, Bruno G, Borra M, et al. Prevalence of increased QT interval duration and dispersion in type 2 diabetic patients and its relationship with coronary heart disease: a population-based cohort. J Intern Med 2002;251:317–324 [DOI] [PubMed] [Google Scholar]
- 39.Brownlee M. Biochemistry and molecular cell biology of diabetic complications. Nature 2001;414:813–820 [DOI] [PubMed] [Google Scholar]
- 40.Takahashi N, Nakagawa M, Saikawa T, et al. Regulation of QT indices mediated by autonomic nervous function in patients with type 2 diabetes. Int J Cardiol 2004;96:375–379 [DOI] [PubMed] [Google Scholar]
- 41.Gu K, Cowie CC, Harris MI. Mortality in adults with and without diabetes in a national cohort of the U.S. population, 1971-1993. Diabetes Care 1998;21:1138–1145 [DOI] [PubMed] [Google Scholar]
Associated Data
This section collects any data citations, data availability statements, or supplementary materials included in this article.