

Abstract
Amyotrophic lateral sclerosis (ALS) is a fatal motor neuron disease for which a precise cause has not yet been identified. Standard CT or MRI evaluation does not demonstrate gross structural nervous system changes in ALS, so conventional neuroimaging techniques have provided little insight into the pathophysiology of this disease. Advanced neuroimaging techniques—such as structural MRI, diffusion tensor imaging and proton magnetic resonance spectroscopy—allow evaluation of alterations of the nervous system in ALS. These alterations include focal loss of grey and white matter and reductions in white matter tract integrity, as well as changes in neural networks and in the chemistry, metabolism and receptor distribution in the brain. Given their potential for investigation of both brain structure and function, advanced neuroimaging methods offer important opportunities to improve diagnosis, guide prognosis, and direct future treatment strategies in ALS. In this article, we review the contributions made by various advanced neuroimaging techniques to our understanding of the impact of ALS on different brain regions, and the potential role of such measures in biomarker development.
Introduction
More than 100 years have passed since Jean-Martin Charcot first described amyotrophic lateral sclerosis (ALS).1 The disease affects motor neurons in the primary motor cortex, brainstem and spinal cord, and results in both upper motor neuron (UMN) and lower motor neuron (LMN) signs.2 The underlying pathophysiology is not well understood, and effective treatments are still needed for this fatal neurodegenerative disease.3 Furthermore, the presentation and natural history of ALS varies considerably from patient to patient, which can contribute to diagnostic uncertainty.4 Other motor neuron diseases, including progressive muscular atrophy (PMA; LMN signs only) and primary lateral sclerosis (PLS; UMN signs only), must also be considered in the differential diagnosis. Imaging has had a tremendous impact in the work-up of nervous system pathology, particularly for stroke, cancer and demyelinating diseases. By contrast, neurodegenerative diseases including ALS tend to involve more-insidious pathological processes and present with less clear-cut clinical diagnoses and imaging findings.
Early reports suggested that structural changes in ALS could be detected using MRI, including hyperintense T2-weighted signal in the corticospinal tract (CST).5 Such MRI findings can, however, also be seen in healthy controls.6 As a result, the main role of conventional MRI in ALS management is to exclude alternative diagnoses—such as an upper cervical cord lesion—that can mimic ALS and present with UMN and LMN signs. Over the past 25 years, considerable interest has developed in the use of advanced neuroimaging methods to study CNS changes in ALS.
Advanced MRI techniques allow investigation of the nervous system for atrophy and alterations in microstructure, biochemistry, neural networks, metabolism and neuronal receptors. In this Review, we first introduce four MRI modalities as well as various PET radioligands. We then discuss how these techniques have been applied to increase our understanding of changes in different brain regions in ALS. We propose that advanced neuroimaging techniques have considerable potential for translation into diagnostic and therapeutic biomarkers. In addition, we support implementation of a multimodality imaging approach to further our understanding of this heterogeneous and complex neurodegenerative disease.
Advanced neuroimaging techniques
Structural MRI
Structural MRI (sMRI) techniques enable detailed analysis of focal atrophy and regional grey and white matter.7 Typical high-resolution, single-contrast images are three-dimensional images acquired at 1-mm resolution in each dimension to ensure accurate structural demarcation. For some subcortical structures, tissue identification (segmentation) is best achieved through a combination of high-resolution sequences.8 In general, two classes of volume analysis are used: voxel-based morphometry (VBM), which measures relative grey and white matter volumes in specific brain regions;9 and surface-based morphometry (SBM), which measures cortical thickness.10,11
Diffusion tensor imaging
Diffusion tensor imaging (DTI) quantifies Brownian motion of water molecules in biological tissues. By measuring both rate and preferred axis of water diffusion, DTI can evaluate integrity of white matter tracts, which can be degraded in neurological diseases.12 Fractional anisotropy (FA) is a scalar measurement of the degree of a preferred axis of water diffusion, and decreases as the diffusion of water becomes less restricted to a single axis.13 Mean diffusivity (MD) ignores nonuniformity of the diffusivity and averages water diffusivity properties from all three axes. Additional diffusivity measures can be investigated using DTI, including radial diffusivity (diffusion perpendicular to the myelin sheath), and axial diffusivity (diffusion parallel to the myelin sheath).14 Data analysis can be performed using region-of-interest approaches, which evaluate a specific brain location; whole-brain voxel-wise approaches such as tract-based spatial statistics; or tractography analyses, which can be used to characterize white matter tracts.
Proton magnetic resonance spectroscopy
Proton magnetic resonance spectroscopy (1H-MRS) uses the slight differences in the magnetic field produced by electrons and nuclei in a localized region of tissue, so as to resolve and quantify certain tissue metabolites.15 The most commonly investigated metabolites are: N-acetylaspartate (NAA), a marker of neuronal integrity; choline (Cho), a marker of cell membrane turnover; and creatine (Cr), a marker of energy metabolism. Other brain metabolites include: myo-inositol, a marker of glial cells; glutamate and glutamine (collectively termed Glx); and γ-aminobutyric acid (GABA).
Metabolite quantification can be reported in the form of metabolite ratios or absolute concentrations. Metabolite ratios are used because standardization of the metabolite of interest relative to Cr or Cho corrects for variability that can arise, including magnetic field inhomogeneity and volume loss.16 Advances in 1H-MRS post-processing techniques, however, have facilitated absolute quantification of metabolites, which is generally considered to be more informative.
Resting-state functional connectivity MRI
Resting-state functional connectivity MRI (rs-fcMRI) uses intrinsic random fluctuations of brain activity to investigate relationships between brain regions. Detection of patterns of coherent brain activity led to the concept of specific neural networks in the brain.17 An early study demonstrated that, at rest, blood oxygen level-dependent signals (an indirect measure of neuronal activity) were synchronized between the motor cortices of each hemisphere, representing an intrinsic connection between these two cortical regions.18 Use of activation-based functional MRI to elucidate neural correlates related to task execution—such as cognitive, motor and emotional tasks—demonstrated similar findings to the PET literature discussed here, and has been reviewed elsewhere.19
PET
PET uses radioactive isotopes to localize and quantify brain metabolic activity or specific brain receptors, which can be altered in disease processes.20 PET agents used to investigate CNS changes in ALS include 18F-fluorodeoxyglucose (FDG), a glucose analogue that is used to measure metabolism; 18F-6-fluorodopa, a dopamine precursor; 11C-PK11195, which binds to the translocator protein and is considered a marker of neuroinflammation; 11C-flumazenil, which binds to the GABAA receptor; 11C-WAY100635, which binds to the serotonergic 5-hydroxytryptamine receptor 1A; and 11C-L-deprenyl, which binds to monoamine oxidase B.
Advanced neuroimaging in ALS
Motor cortex
Structural MRI
A study that used manual methods to evaluate volumetric loss did not show evidence of substantial atrophy of the motor cortex of patients with ALS, but did demonstrate 25% volume loss in patients with PLS.21 A study conducted prior to the advent of VBM that used automated group image analysis indicated loss of white matter underneath the motor cortex in patients with bulbar-onset ALS but not in those with limb-onset ALS.22 Conversely, a subsequent study using VBM reported no loss of volume in the motor cortices of patients with ALS.23 Owing to relatively small samples of healthy controls, both of these studies might lack sufficient statistical power to detect cortical changes. The majority of studies implementing VBM techniques have found grey matter atrophy in the motor cortex of patients with ALS.24–28 SBM studies have consistently found reductions in cortical thickness in the ALS motor cortex.29–32 Longitudinal SBM studies have reported progressive cortical thinning over 9 months.33
Proton magnetic resonance spectroscopy
The majority of 1H-MRS studies have described reductions in NAA:Cr or NAA:Cho ratios or NAA levels in the motor cortex of patients with ALS, which suggests reduced neuronal integrity in this brain region.34–46 Evidence is conflicting as to whether these changes occur early in clinically evident disease: one study reported decreases in NAA:Cr ratios at a mean disease duration of 6.5 months,47 whereas another study reported no significant differences in NAA levels in patients diagnosed with ALS within the past year.48
Lower NAA:Cr ratios have been reported across motor neuron disease phenotypes, with similar changes in patients with PLS or ALS, and less-dramatic reductions in patients with PMA.38 Substantially lower NAA:Cr ratios were reported in the motor cortex of patients with bulbar-onset compared with limb-onset ALS.49 A longitudinal study detected decreases in NAA levels over 6 months in patients with PMA but not in those with early-stage ALS.48 Other studies, which included ALS patients with longer disease duration, described longitudinal reductions in NAA in the motor cortex of ALS patients at 3 months,41 6 months50 and 12 months.39 A number of studies have also explored correlations between NAA and clinical scales, and have reported significant associations between NAA levels and revised Amyotrophic Lateral Sclerosis Functional Rating Scale (ALSFRS-R) scores,37,38,47,51 UMN disease burden,37,44,52 Norris Scale scores,36,42 finger-tapping rate,38 hand strength,38 disease duration,47 and rate of disease progression.34 Taken together, these results point to a reduction in neuronal integrity in the motor cortex in ALS.
Levels of other brain metabolites in the motor cortex have also been investigated, although not to the same extent as NAA. Early studies found no significant differences in Glx or Glu levels,45 or reported decreased Glu levels in patients with ALS compared with controls.40 A more recent study described elevations in Glx:Cr and Glu:Cr ratios in patients with ALS compared with controls.46 Increased Cho levels40 and decreased Cr levels39 have been described, but these findings were not replicated in other reports.36,41,44 Elevated myo-inositol levels or myo-inositol:Cr ratios have been detected in the motor cortex in patients with ALS40,43,51 or PLS,48 but not in early-stage ALS.48 The exact mechanism of myo-inositol alteration in ALS is uncertain, but might reflect an increased number of glial cells, or increased expression of the myo-inositol transporter on astrocytes.51 Using 1H-MRS spectral editing techniques, we recently showed reduced GABA levels in patients with ALS compared with controls, suggesting that GABAergic dysfunction could have an important role in ALS neurodegeneration (Figure 1).53
Figure 1.

Advanced imaging of the motor cortex in ALS. a,b | T1-weighted MRI scans showing single voxel placement centred on the left motor cortex (yellow boxes) in the sagittal (part a) and axial (part b) projections. c | Representative magnetic resonance spectroscopy spectrum from the left motor cortex using MEGA-PRESS spectral editing technique. d | GABA levels in the motor cortex are decreased in patients with ALS compared with controls. Horizontal bars indicate the mean. Abbreviations: AIU, arbitrary institutional unit; ALS, amyotrophic lateral sclerosis; GABA, γ-aminobutyric acid; Glx, glutamate and glutamine; HC, healthy control; NAA, N-acetylaspartate. Permission obtained from The American Academy of Neurology © Foerster, B. R. et al. Neurology 78, 1596–1600 (2012).
Resting-state functional connectivity MRI
Several studies have described decreased motor network (primary motor cortices and supplementary motor area) connectivity,54–56 or a trend towards decreased motor network connectivity,57 in ALS. One study also reported a correlation between disease burden and motor network connectivity: patients who were more affected by ALS had a more strongly interconnected network than did patients with lower disease burden.
A study that used the full precentral gyri to define the sensorimotor cortices detected increased connectivity of this region with nonmotor areas in patients with ALS compared with controls, but did not observe a change in connectivity between the motor cortex of each hemisphere.58 A combination of rs-fcMRI and DTI techniques revealed increased connectivity of the motor network in ALS patients with greater disease burden.59 This increased motor cortex connectivity was detected in regions abutting white matter areas that showed loss of integrity, as measured by DTI (Figure 2). As such, the observed increase in connectivity could be a manifestation of loss of interhemispheric inhibition,60 and is consistent with the decreased GABA concentration in the motor cortex of patients with ALS.53
Figure 2.
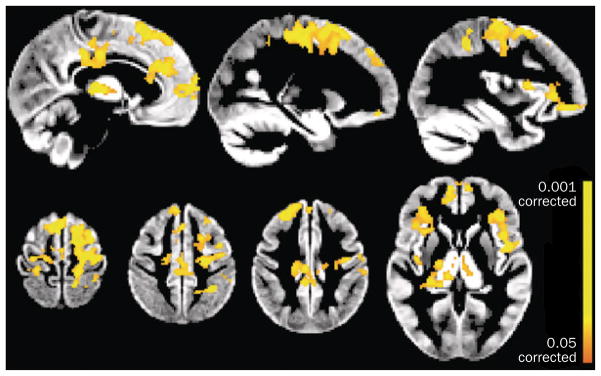
Changes in functional connectivity directly related to white matter damage in ALS. Functional connectivity was significantly increased in patients with ALS compared with healthy controls (P <0.05 corrected for multiple comparisons) in primary sensorimotor and premotor cortex, anterior and motor cingulate areas, frontal and central operculum, and the thalamus. Abbreviation: ALS, amyotrophic lateral sclerosis. Permission obtained from Oxford University Press © Douaud, G. et al. Brain 134, 3470–3479 (2011).
Taken together, these studies have shown motor network changes in ALS. A possible scenario to explain the observed changes could be that early in the disease process, when most function is still preserved, functional connectivity begins to decrease. With increased disease burden, however, loss of interhemispheric inhibition starts to manifest, resulting in increased connectivity. Longitudinal studies of connectivity and changes in GABA levels in ALS are required to investigate these findings further.
PET
PET has revealed reductions in cerebral blood flow in the motor cortex and alterations in neuronal activation in patients with ALS compared with controls.61 Patients had increased cerebral blood flow and activation in the contralateral motor cortex and adjacent association areas during a single-handed motor task, which may be due to compensatory adaptation and/or impairment of neuronal inhibitory tone.
Increased microglial activation in the motor cortex of patients with ALS was demonstrated using the PET ligand 11C-PK11195, a marker of neuroinflammation.62 Increased binding of 11C-PK11195 was also evident in the pons, dorsolateral prefrontal cortex, and thalamus. Two studies have used 11C-flumazenil to study both sporadic ALS and familial-type ALS caused by homozygous Asp90Ala mutation of superoxide dismutase 1 (SOD1), which tends to have a less aggressive disease course than sporadic disease.63,64 The studies showed reduced 11C-flumazenil binding in the motor cortex and motor association areas in sporadic ALS compared with controls. Reductions in 11C-flumazenil binding in familial-type ALS, however, were localized to the left frontotemporal region and anterior cingulate gyrus.63 Only patients with sporadic ALS demonstrated increased cortical excitability.64
Implications of imaging findings
Advanced neuroimaging studies have demonstrated substantial changes in the motor cortex of patients with ALS. Structural imaging and 1H-MRS have provided evidence of neuronal degeneration, through measures showing reduced cortical thickness and reductions in NAA. 1H-MRS and PET have indicated compromise of the GABAergic system, and rs-fcMRI has suggested reduced neuronal inhibitory function. These results suggest an interneuron-targeted pathology involving loss of cortical inhibition and resulting hyperexcitability, perhaps through glutamate excitotoxicity.65
Corticospinal tract
Diffusion tensor imaging
A number of studies have demonstrated reduced FA,66–76 increased MD,68–70,76–79 and increased radial diffusivity68,76,79 in the CST of patients with ALS. Reduced FA values in the CST and corpus callosum have been described in a small cohort of patients who did not have UMN signs at the time of the scan but later progressed to full ALS, providing evidence that white matter tract degradation can be detected prior to onset of clinical signs.75
A study of patients with early-stage ALS, PMA or PLS generally found the lowest FA values in the PLS subgroup, with more-modest reductions in the ALS subgroups and the least extensive reductions in the PMA subgroup.80 A study that enrolled ALS patients with longer disease duration, however, found approximately twice the reduction of FA values in patients with ALS versus patients with PLS.72 These findings suggest that disease staging can affect DTI measurements in ALS.
Other studies have demonstrated no significant difference in FA values in patients with PMA38,69 or PLS compared with controls.38 Compared with patients with limb-onset ALS, patients with bulbar-onset ALS have greater decreases in FA81 and greater increases in MD81,82 relative to healthy controls. These studies reported increased MD values in patients with bulbar-onset ALS compared with healthy controls, but no significant differences in MD values in patients with limb-onset ALS compared with healthy controls.
FA values in the CST have been shown to correlate with UMN and ALSFRS-R scores.74 Two studies have shown that ALS patients with higher FA values have a more protracted disease duration, perhaps owing to differences in disease subtype.71,72 However, many DTI studies in ALS have not shown significant correlations between DTI metrics and clinical measures. Patients with ALS caused by homozygous Asp90Ala SOD1 mutations had similar CST FA values to healthy controls, whereas patients with sporadic ALS had lower CST FA values, indicating different disease mechanisms between this familial type and sporadic ALS.83 Some studies have reported decreased FA,37,76,82,84–87 increased MD,81,88 and increased axial diffusivity76,79,89 in the posterior limb of the internal capsule (PLIC). The PLIC contains densely packed CST fibres and might, therefore, be highly sensitive to DTI alterations.37 FA values in the PLIC correlated with clinical symptom severity37,85 and disease duration.84
Some longitudinal studies have demonstrated reductions in FA in the CST over time,74,80,90,91 whereas others have not.89,92,93 Using DTI, researchers demonstrated impairment of the motor network, involving the white matter tracts and their associated cortical regions, in patients with ALS, which could indicate spread of disease from the motor cortex into associated motor regions.94 Other DTI studies found the greatest changes in diffusivity in rostral, as opposed to caudal, regions of the CST. Together, these findings suggest anterograde corticomotor neuronal degeneration.71,74 However, not all imaging data, including those from 1H-MRS-based studies, support rostral-predominant changes,35 so the possibility remains that ALS disease processes advance retrogradely from the spinal anterior horns, as well as anterogradely from the motor cortex.95
Evidence exists that patients with PLS have rostral- predominant changes in white matter integrity in the CST, whereas patients with ALS have caudal- predominant changes.72 In addition, reductions in FA in white matter adjacent to the motor cortex were greater in patients with PLS than in those with ALS, and greater reductions in FA were present in the PLIC in ALS versus PLS. FA values in the cerebral peduncle, however, did not differ between these two motor neuron diseases.87 Similar findings have been reported in patients with limb-onset ALS (more-rostral FA involvement) versus patients with bulbar-onset ALS (more-caudal FA involvement) at baseline, with increasing involvement of the CST in both groups over time.80 These results might be explained in part by the different site of onset of different motor neuron diseases, with the pathological effects propagating along white matter tracts.
Proton magnetic resonance spectroscopy
A few studies have evaluated metabolite changes in the CST in ALS. Decreased NAA:Cr ratios were present in the subcortical white matter and periventricular white matter along the CST in patients with ALS compared with controls, although significant changes were not evident in the PLIC.96 Another study found reduced NAA:Cr and NAA:Cho ratios in the precentral gyrus and corona radiata in patients with ALS compared with controls, without significant changes in the PLIC or cerebral peduncles, suggesting attenuation of metabolite alterations in more-caudal parts of the CST.35 Reductions in NAA levels and elevations in Cho levels, as averaged over the CST, have also been described in ALS, as have reductions in NAA levels in the left PLIC.97 Using whole-brain 1H-MRS techniques, a recent study reported reduced NAA levels along the CST.78 Correlations between NAA and clinical measures have been inconsistent.35,78,96
Resting-state functional connectivity MRI
One study, although not explicitly measuring connectivity in the CST, investigated resting-state connectivity in the presence or absence of CST involvement, as determined by DTI.58 The left sensorimotor cortex had more widespread connectivity when DTI measures of the CST were preserved.
Implications of imaging findings
Overall, results from DTI and 1H-MRS studies of the CST indicate disruption and degeneration of white matter in this region. The significance of alternations in DTI metrics has been the subject of much discussion in the literature.98 Axonal degeneration and disorganization99 is thought to give rise to alterations in water diffusivity100 in the setting of ALS, and the FA reductions have been posited to reflect gliosis, increased extracellular matrix, Wallerian degeneration, and/or axonal loss.68,83,101
Corpus callosum
Structural MRI
Few studies have explicitly addressed changes in the corpus callosum in ALS. Manual measurement methods revealed reductions in the size of the corpus callosum in patients with this disease compared with healthy controls,102 whereas a VBM-based study showed increased corpus callosum size in patients with ALS.25 For our own study, we aligned each participant’s acquisition space to a common orientation, to avoid image misregistration errors that can occur through use of group spatial normalization in VBM.103,104 We found no change in the cross-sectional area of the corpus callosum in individuals with ALS. Notably, many studies have investigated global structural involvement in ALS through use of VBM or SBM analyses, and only a handful indicated morphological involvement of the corpus callosum.
Diffusion tensor imaging
DTI has been used to explore changes in the genu, body and splenium of the corpus callosum. The genu connects the inferior frontal lobes and anterior temporal lobes; the body connects the remaining regions of the frontal lobes as well as the parietal lobes; and the splenium connects the occipital lobes.
Several studies have documented FA reductions in the middle posterior body of the corpus callosum in ALS,71,72,75–77,79,101 as well as increases in MD,77 axial diffusivity79 and radial diffusivity71,76,77 (Figure 3). FA values of the middle posterior regions of the corpus callosum correlated negatively with percentage of contralateral involuntary movements, suggesting loss of neuronal inhibitory influence in ALS.105 FA values in the corpus callosum also correlated positively with ALSFRS-R76,105 and UMN scores.73,101
Figure 3.

Diffusion tensor imaging in ALS. Images show diffusion tensor imaging maps of voxel-wise differences in fractional anisotropy, radial diffusivity and axial diffusivity between patients with ALS and healthy controls. Results are displayed at significant levels (P <0.05, corrected for multiple comparisons) in Montreal Neurological Institute standard space overlaid on the mean fractional anisotropy image derived from all participants. Major fibre tracts are displayed in green. Red–yellow clusters indicate locations of significant differences between patients and controls. Abbreviation: ALS, amyotrophic lateral sclerosis. Permission obtained from Wiley and Sons © Chapman, M. C. et al. J. Magn. Reson. Imaging doi:10.1002/jmri.24218.
FA of the body, genu and splenium of the corpus callosum was found to be decreased in patients with ALS compared with controls.87 Using a different cohort, the same study reported decreased FA in the body of the corpus callosum in patients with PLS versus patients with ALS or healthy controls. Similarly, FA in the body and splenium of the corpus callosum was found to be decreased in patients with PLS compared with patients with ALS or PMA.80 Longitudinal decreases in FA in the body of the corpus callosum have been described in patients with limb-onset or bulbar-onset ALS, and in patients with PMA. Patients with bulbar-onset ALS or PMA also showed longitudinal decreases in FA in the genu of the corpus callosum, which might contribute to the cognitive dysfunction observed in these patients.80
Implications of imaging findings
DTI findings in the middle posterior body of the corpus callosum, similar to the CST results, show substantial reductions in FA. The middle posterior body of the corpus callosum connects the motor and motor association cortices. As such, the DTI results support the hypothesis that disease propagates along structural connections.106 The direct contribution of structural tract changes in the corpus callosum and CST to functional alterations in ALS is unclear, although early findings suggest that white matter alterations are associated with increased functional connectivity.59
Frontal lobe
Structural MRI
An early study of patients with ALS found a reduction of underlying white matter volume but not cortical surface area in the anterior frontal lobes.21 Frontal lobe involvement has also been reported using VBM methods.23,25–28 One study using SBM analysis found extensive cortical thinning in frontal brain regions, including the inferior part of the precentral sulcus, inferior and middle frontal sulci, and medial orbital sulcus.31
Several studies have explored the link between structural changes in the frontal lobe and cognition in patients with ALS. A VBM study found frontal lobar atrophy in ALS patients, with the greatest effect in patients with ALS–frontotemporal dementia (FTD).24 Other studies have demonstrated reductions in white matter, grey matter or both, with greatest effect seen in cognitively impaired patients with ALS.107,108 An SBM study revealed extensive cortical thinning in bilateral frontal and temporal regions.32 In addition, performance on a recognition sorting test correlated with cortical thickness of the left prefrontal and parietal regions.
A few longitudinal studies have found changes in the frontal lobe in patients with ALS. One study that used tensor-based morphometry (an analytical method for longitudinal VBM) found more-rapid loss of frontal grey matter in patients with more-rapidly progressing disease at 9-month follow-up.33 Cortical thinning of the right-side pars triangularis was associated with disease progression, and showed a trend towards continued thinning in the left lateral orbital frontal region at 3–10-month follow-up.30 Decreased grey matter volume in the left insula and right temporopolar cortex, and decreased white matter volume in the right inferior frontal gyrus were reported at baseline, with increasingly pronounced bilateral involvement of the frontal and temporal lobes at 6-month follow-up.109
Proton magnetic resonance spectroscopy
Both NAA:(Cr+Cho) and NAA:Cho ratios in the combined cortex of the bilateral frontal and parietal lobes were reduced in patients with probable or definite ALS (diagnosed according to El Escorial Criteria) compared with healthy controls. These reductions were not as dramatic as those present in the motor cortex.41 Another study found trends for reductions in NAA and elevations of myo-inositol levels in the mesial prefrontal cortex.110 Overall, the NAA:myo-inositol ratio was significantly decreased in patients with ALS, but did not correlate with verbal fluency or cognitive performance. Another study reported decreases in the NAA:Cr ratio in the frontal lobe, and these changes correlated with achievement on the Wisconsin Card Sorting Test.42 Other areas that have not shown substantial metabolite changes in ALS versus controls include the parietal lobe and occipital lobe, including the cuneus gyrus.40,42,47
Diffusion tensor imaging
Reduced FA67,74,75,82 and increased MD82 values have been described in several frontal white matter regions in patients with ALS compared with controls. One DTI study described more-global reductions in FA values compared with other DTI studies, including involvement of frontal, temporal and parietal white matter.86 Cognitive testing scores correlated with FA values in white matter tracts located in frontotemporal regions, as well as in the corpus callosum and CST.111
Apathy testing scores correlated significantly with FA and MD values, as well as cortical volumes, in the frontal lobe.112 One study reported FA decreases in white matter of the frontal gyrus and dorsolateral prefrontal gyrus of patients with bulbar-onset but not limb-onset ALS.80 These differences could help to explain the more prominent cognitive impairment that tends to occur in bulbar-onset ALS compared with limb-onset ALS.113 The same study also found longitudinal FA reductions in frontal white matter of patients with PMA, which might contribute to the memory and executive dysfunction observed in this subtype of motor neuron disease. By contrast, a subsequent study demonstrated FA decreases in subcortical white matter of the frontal gyrus of limb-onset ALS patients but not in those with bulbar onset.82 Neither study included neuropsychological testing, and further research efforts are required to better understand the relationship between cognitive function and DTI measures in the different ALS subtypes.
PET
PET studies have shown reductions in frontal lobe cerebral blood flow and oxygen metabolism in ALS patients with dementia compared with healthy controls.114 Similarly, reductions in frontal lobe cerebral blood flow were observed in patients with ALS who had impaired verbal fluency.115 An 18F-FDG PET study found that patients with bulbar-onset ALS had significantly lower verbal fluency scores and reduced metabolism in the frontal cortex compared with limb-onset ALS patients and healthy controls.116 This result suggests that the various ALS phenotypes differ in both cognitive dysfunction and metabolic profiles. Compromised verbal fluency measures have been shown to correlate with reduced 11C-flumanezil binding in the right inferior frontal gyrus, superior temporal gyrus, and anterior insula.117 11C-WAY100635 binding was globally decreased in the cortex of patients with sporadic ALS, with the most substantial changes manifesting in fronto-temporal regions.118 A similar pattern of reduced binding of 11C-WAY100635 was present in patients with homozygous Asp90Ala mutations in SOD1, although to a lesser extent than in patients with sporadic ALS. These results suggest that patients with Asp90Ala SOD1 ALS have less cortical damage than do patients with sporadic ALS.
Implications of imaging findings
Cognitive and executive functional changes in patients with ALS have been well-documented in the clinical literature. Neuroimaging findings provide corroborative evidence of frontal lobe changes in ALS, in that many of the imaging features correlate with cognitive test scores. Advanced neuroimaging methods reveal important structural, biochemical, metabolic and receptor alterations in the frontal lobe. These results are particularly interesting in light of the recent discovery of the C9orf72 hexanucleotide repeat expansion, which is most commonly found in patients with familial FTD and/or ALS.119 Neuroimaging techniques may be able to provide a better understanding of the continuum and overlap of ALS and FTD, and could help to explain the differences in cognitive impairment between bulbar-onset and limb-onset ALS.
Deep grey nuclei
Structural MRI
Few volumetric changes involving the deep grey nuclei have been described in the ALS literature, despite a reasonably large number of sMRI studies. A VBM study described atrophy in the right basal ganglia in ALS, with the most prominent atrophy in patients with rapid disease progression.33 Volume loss was detected in the left posterior thalamus of patients with ALS or ALS–FTD.24
Diffusion tensor imaging
DTI evaluation of the deep grey nuclei of patients with ALS revealed decreased FA and increased MD in the basal ganglia and thalamus, as well as significant negative correlations between several DTI measures and scores on cognitive and fine-motor-rate tests.120 Additional studies have described reduced FA in the thalamus of patients with ALS versus controls.66,75 One longitudinal study found baseline FA reductions in the thalamus of patients with PLS or limb-onset ALS compared with healthy controls, and reductions in FA in the thalamus over time in patients with bulbar-onset or limb-onset ALS.80
Proton magnetic resonance spectroscopy
Reductions in NAA and elevations of Cho in both the basal ganglia and thalamus in patients with ALS versus controls have been described.121 NAA levels and the NAA:Cho ratio in the basal ganglia correlated positively with finger- tap rate, foot-tap rate, and bulbar muscle movement rate. A subsequent study reported no differences in the NAA:Cho ratio in the thalamus of patients with ALS versus controls, although substantial decreases in the NAA:Cho ratio were detected in the midcingulate cortex.34
PET
A PET study found a negative correlation between 6-fluorodopa uptake in the striatum and disease duration in patients with ALS who lacked extrapyramidal signs, providing evidence for substantia nigral cellular loss in this disease and suggesting that ALS might share disease mechanisms with Parkinson disease.122
Resting-state functional connectivity MRI
Only one rs-fcMRI study has reported a change in connectivity in subcortical structures in patients with ALS.59 Increased connectivity between the motor network and the thalamus was identified, implying damage to thalamocortical projections of the motor pathway.
Implications of imaging findings
The above findings emphasize the concept that ALS affects multiple CNS structures. Although the studies are limited in number, evidence exists to support loss of neuronal integrity in the deep grey nuclei. The components of the deep grey nuclei have important connections to the motor network and prefrontal cortices, and seem to be altered in ALS.
Brainstem
Diffusion tensor imaging
One of the first ALS studies to focus on the pyramidal tract in the brainstem reported decreased FA at the level of the pons and medulla in patients versus controls.88 By contrast, no disease-associated differences in FA or MD were detected in these brainstem regions in another study, although they were evident at the level of the cerebral peduncle.96 Other reports have found reduced FA in the pyramid of the medulla,43,73 which correlated with UMN scores.73
Proton magnetic resonance spectroscopy
Decreased NAA:Cr ratios and increased Glx:Cr ratios were detected in the medulla of patients with ALS compared with control individuals.123 The Glx:Cr ratio showed a significant negative correlation with ALSFRS-R bulbar subscores in patients with bulbar-onset disease. Reductions in brainstem levels of NAA have also been detected in patients with ALS, although no significant changes in Glx were observed.45 A more recent study did not find significant changes in NAA:Cr or NAA:Cho ratios in the medulla or pons in patients with early-onset ALS, although disease duration did show a significant negative correlation with NAA:Cr ratios in the medulla.47
PET
A large 18F-FDG PET study found evidence of hyper-metabolism in the midbrain and pons of patients with ALS.116 Another study showed increased uptake of the PET ligand 11C-L-deprenyl in the pons and supratentorial white matter in ALS, providing support for involvement of astrocytosis in ALS pathogenesis.124
Implications of imaging findings
Advanced neuroimaging studies demonstrate structural and metabolic changes in the brainstem in ALS. DTI studies of the brainstem are subject to greater variability than are studies of other brain regions owing to decussation of fibre tracts in this region. However, significant reductions of FA that correspond to the CST results discussed above have been demonstrated in the brainstem of patients with ALS. Overall, results from 1H-MRS studies provide evidence of neuronal degeneration in the brainstem similar to that in the motor cortex. PET findings support the presence of metabolic, neuroinflammatory and reactive changes in the brainstem in ALS.
Cervical spinal cord
Diffusion tensor imaging
In ALS, DTI studies have shown reduced FA and increased radial diffusivity in the spinal cord, particularly in the distal cervical cord.125,126 In addition, cross-sectional spinal cord area was reduced, and FA values correlated with ALSFRS-R scores.125 Focal atrophy of the spinal cord in ALS correlated with muscle deficits.126 One study also demonstrated focal FA reductions and increased radial diffusivity in dorsal spinal cord columns, which suggests involvement of spinal sensory pathway in ALS.126 A longitudinal study demonstrated reductions in spinal cord FA and cross-sectional area and increased MD at 9-month follow-up.92
Magnetic resonance spectroscopy
MRS studies have focused on the upper cervical cord to minimize the challenges of anatomy and motion artefacts. Reduced NAA:Cr and NAA:myo-inositol ratios have been reported in this region in patients with ALS127–129 and in presymptomatic carriers of SOD1 mutations.128 One study found increased myo-inositol:Cr ratios,127 which were not confirmed in the other MRS studies.128,129 NAA:myo-inositol ratios correlated with FVC127,129 and ALSFRS-R scores,127 as well as with rates of decline in these scores.127
Implications of imaging findings
Both DTI and MRS studies of the cervical cord in ALS demonstrate structural and metabolite changes that are concordant with those seen in the brain. Further advances in neuroimaging techniques will enable the challenges of investigating this important nervous system structure—which is integrally involved in the pathophysiology of ALS—to be addressed.
Biomarker potential of imaging
Substantial interest has been expressed in the potential to translate research-driven advanced imaging protocols into clinically relevant imaging tools. Given the heterogeneous clinical presentation among patients with ALS, neuroimaging tests to assist diagnosis are desirable.
An important caveat is that most neuroimaging studies involve small numbers of patients who tend to have long disease duration, which could result in skewed sampling given the variable nature of this disease. This situation might explain some of the discrepant neuroimaging results in the literature, and can limit generalizability of the findings. To explore the potential of DTI to diagnose ALS, we recently performed a meta-analysis and concluded that current DTI techniques lack sufficient diagnostic accuracy to be implemented clinically (Figure 4). As such, additional research efforts are needed for diagnostic biomarker development.130
Figure 4.

Diagnostic accurary of diffusion tensor imaging for amyotrophic lateral sclerosis. Area under the SROC curve for diffusion tensor imaging fractional anisotropy was determined through meta-analysis of existing studies. The summary operating point (blue diamond) represents the intersection of the overall sensitivity and specificity. The low AUC, sensitivity and specificity values indicate that current DTI techniques lack sufficient test accuracy for clinical application. Abbreviations: AUC, area under the curve; SROC, summary receiver operating characteristic. Permission obtained from Elsevier Ltd © Foerster, B. R. et al. Acad. Radiol. 19, 1075–1086 (2012).
An attractive option for development of a diagnostic algorithm with sufficient accuracy lies in combining various advanced neuroimaging modalities and/or laboratory tests. International efforts towards this goal have produced a consensus statement paper from the Neuroimaging Society in ALS to facilitate neuroimaging biomarker development for this disease.131
More-advanced statistical techniques, such as machine-learning methods, will have an important role in analysis of the resulting rich data sets, to facilitate development of a multimodal neuroimaging biomarker.132 Another important step to assess the capacity of imaging biomarkers to predict conversion to ALS would involve enrolment of neurology patients who present with only LMN signs, as well as those with a genetic predisposition to ALS, in longitudinal trials. A multimodality neuroimaging approach could also be useful for development of therapeutic biomarkers to more fully investigate nervous system changes in response to potential new treatments.
Imaging markers for prognostication
The average life expectancy of patients with ALS is 2–4 years, but a subgroup of patients survive for more than 10 years.133 Clinical predictors of shorter survival time include older age at onset, bulbar onset, and respiratory muscle weakness.134 Neuroimaging may be able to provide important additional information to help determine prognosis. One 1H-MRS study demonstrated that lower NAA:Cho ratios in the motor cortex were predictive of shorter survival time in patients with ALS.135 Using DTI, another study showed that lower FA in the CST predicted shorter survival.136 FA values in the PLIC correlate with rate of disease progression, with patients with lower FA values having faster disease progression.89 Although the number of studies is small, these results suggest that advanced neuroimaging methods could provide important prognostic information to help guide clinical decisions and stratify patients for clinical research trials.
Conclusions and future directions
Neuroimaging has provided important insight into the pathophysiology of ALS in living patients. Compelling imaging evidence exists of neurodegeneration in many nervous system regions including the motor cortex, frontal lobe, CST, brainstem and cervical spinal cord. Furthermore, neuroimaging findings suggest involvement of the corpus callosum and basal ganglia, both of which have important connections to the motor system. Imaging studies also support the clinical findings of frontal lobe involvement in ALS and its overlap with FTD. We believe that neuroimaging will play an important part in furthering our understanding the role of the recently discovered C9orf72 mutation in ALS pathogenesis. Advanced neuroimaging also demonstrates similarities and differences between the motor neuron disease phenotypes in terms of brain metabolism, biochemistry and structural alterations, which should contribute to elucidation of disease aetiologies across the spectrum of motor neuron diseases.
1H-MRS, rs-fcMRI and PET studies have provided corroborating evidence of GABAergic dysfunction in ALS, suggesting the therapeutic potential of strategies to restore normal inhibitory tone. DTI studies have demonstrated evidence of white matter degradation in the frontal lobes, corpus callosum and CST in patients with ALS, although additional research is needed to fully understand these findings. PET studies have shown CNS metabolic alterations in ALS, and have provided evidence of neuroinflammation and astrocytosis in the disease process.
Advanced neuroimaging techniques provide a unique opportunity to assess disease pathophysiology early and noninvasively and, therefore, offer promise for bio-marker development. The need has emerged, however, for a multimodality approach to better characterize patients and to improve our understanding of the disease processes. In the ALS neuroimaging community, there is increasing interest in implementation of such a strategy. In addition, longitudinal trials with enrolment of patients at earlier stages of presentation are needed to better understand how the various imaging metrics change over time. MRI and PET technologies will undoubtedly continue to evolve, and are expected to make important contributions to the diagnosis and treatment of ALS.
Key points.
Advanced neuroimaging techniques noninvasively evaluate brain structure, chemistry, neural network connections, metabolism, and receptor distribution in neurodegenerative diseases
Nervous system changes in amyotrophic lateral sclerosis (ALS) involve the motor cortex, corticospinal tract, corpus callosum, frontal lobes, basal ganglia, thalamus, brainstem and cervical spinal cord
Neuroimaging in ALS provides evidence of neuronal loss, white matter tract disruption, alterations in neural networks, γ-aminobutyric acid system dysfunction, and changes in brain metabolism
Advanced neuroimaging techniques provide unique opportunities to more fully characterize and classify the different motor neuron disease subtypes
ALS is a heterogeneous disease, and neuroimaging studies generally include small numbers of patients with long disease duration, which could limit the generalizability of results
MRI and PET show promise for development of ALS biomarkers, although additional research is required to translate these technologies for clinical application
Review criteria.
Literature searches were performed in PubMed using the search terms “amyotrophic lateral sclerosis”, “ALS”, “magnetic resonance spectroscopy”, “diffusion tensor imaging”, “positron emission tomography”, “resting-state functional magnetic resonance imaging”, “functional connectivity”, “fcMRI”, “voxel-based morphometry”, “VBM”, “FreeSurfer”, “grey matter change”, “cortex change”, “MRI”, and “magnetic resonance imaging” from January 1990 to February 2013. We searched the reference lists of retrieved papers to identify additional articles. Only full-text papers written in English were considered.
Footnotes
Competing interests
The authors declare no competing interests.
Author contributions
B. R. Foerster and R. C. Welsh researched data for the article, made substantial contributions to discussion of the content, and wrote the article. E. L. Feldman contributed to review and/or editing of the manuscript before submission.
Contributor Information
Bradley R. Foerster, Department of Radiology, University of Michigan, 1500 East Medical Center Drive, Ann Arbor, MI 48109, USA
Robert C. Welsh, Department of Radiology, University of Michigan, 1500 East Medical Center Drive, Ann Arbor, MI 48109, USA
Eva L. Feldman, Department of Neurology, University of Michigan, JDRF Center for the Study of Complications in Diabetes, 5017 BSRB, 109 Zina Pitcher Road, Ann Arbor, MI 48109-2200, USA
References
- 1.Kumar DR, Aslinia F, Yale SH, Mazza JJ. Jean-Martin Charcot: the father of neurology. Clin Med Res. 2011;9:46–49. doi: 10.3121/cmr.2009.883. [DOI] [PMC free article] [PubMed] [Google Scholar]
- 2.Turner MR. MRI as a frontrunner in the search for amyotrophic lateral sclerosis biomarkers? Biomark Med. 2011;5:79–81. doi: 10.2217/bmm.10.120. [DOI] [PMC free article] [PubMed] [Google Scholar]
- 3.Kiernan MC, et al. Amyotrophic lateral sclerosis. Lancet. 2011;377:942–955. doi: 10.1016/S0140-6736(10)61156-7. [DOI] [PubMed] [Google Scholar]
- 4.Zoccolella S, et al. Predictors of delay in the diagnosis and clinical trial entry of amyotrophic lateral sclerosis patients: a population-based study. J Neurol Sci. 2006;250:45–49. doi: 10.1016/j.jns.2006.06.027. [DOI] [PubMed] [Google Scholar]
- 5.Comi G, Rovaris M, Leocani L. Neuroimaging in amyotrophic lateral sclerosis. Eur J Neurol. 1999;6:629–637. doi: 10.1046/j.1468-1331.1999.660629.x. [DOI] [PubMed] [Google Scholar]
- 6.Ngai S, Tang YM, Du L, Stuckey S. Hyperintensity of the precentral gyral subcortical white matter and hypointensity of the precentral gyrus on fluid-attenuated inversion recovery: variation with age and implications for the diagnosis of amyotrophic lateral sclerosis. AJNR Am J Neuroradiol. 2007;28:250–254. [PMC free article] [PubMed] [Google Scholar]
- 7.Deichmann R, Good CD, Josephs O, Ashburner J, Turner R. Optimization of 3-D MP-RAGE sequences for structural brain imaging. Neuroimage. 2000;12:112–127. doi: 10.1006/nimg.2000.0601. [DOI] [PubMed] [Google Scholar]
- 8.Traynor CR, Barker GJ, Crum WR, Williams SC, Richardson MP. Segmentation of the thalamus in MRI based on T1 and T2. Neuroimage. 2011;56:939–950. doi: 10.1016/j.neuroimage.2011.01.083. [DOI] [PubMed] [Google Scholar]
- 9.Ashburner J, Friston KJ. Voxel-based morphometry—the methods. Neuroimage. 2000;11:805–821. doi: 10.1006/nimg.2000.0582. [DOI] [PubMed] [Google Scholar]
- 10.Fischl B, Dale AM. Measuring the thickness of the human cerebral cortex from magnetic resonance images. Proc Natl Acad Sci USA. 2000;97:11050–11055. doi: 10.1073/pnas.200033797. [DOI] [PMC free article] [PubMed] [Google Scholar]
- 11.Das SR, Avants BB, Grossman M, Gee JC. Registration based cortical thickness measurement. Neuroimage. 2009;45:867–879. doi: 10.1016/j.neuroimage.2008.12.016. [DOI] [PMC free article] [PubMed] [Google Scholar]
- 12.Chenevert TL, Brunberg JA, Pipe JG. Anisotropic diffusion in human white matter: demonstration with MR techniques in vivo. Radiology. 1990;177:401–405. doi: 10.1148/radiology.177.2.2217776. [DOI] [PubMed] [Google Scholar]
- 13.Pierpaoli C, Basser PJ. Toward a quantitative assessment of diffusion anisotropy. Magn Reson Med. 1996;36:893–906. doi: 10.1002/mrm.1910360612. [DOI] [PubMed] [Google Scholar]
- 14.Dong Q, et al. Clinical applications of diffusion tensor imaging. J Magn Reson Imaging. 2004;19:6–18. doi: 10.1002/jmri.10424. [DOI] [PubMed] [Google Scholar]
- 15.Castillo M, Kwock L, Mukherji SK. Clinical applications of proton MR spectroscopy. AJNR Am J Neuroradiol. 1996;17:1–15. [PMC free article] [PubMed] [Google Scholar]
- 16.Kalra S, Arnold DL. ALS surrogate markers. MRS. Amyotroph Lateral Scler Other Motor Neuron Disord. 2004;5 (Suppl 1):111–114. doi: 10.1080/17434470410019861. [DOI] [PubMed] [Google Scholar]
- 17.Damoiseaux JS, et al. Consistent resting-state networks across healthy subjects. Proc Natl Acad Sci USA. 2006;103:13848–13853. doi: 10.1073/pnas.0601417103. [DOI] [PMC free article] [PubMed] [Google Scholar]
- 18.Biswal BB, Van Kylen J, Hyde JS. Simultaneous assessment of flow and BOLD signals in resting-state functional connectivity maps. NMR Biomed. 1997;10:165–170. doi: 10.1002/(sici)1099-1492(199706/08)10:4/5<165::aid-nbm454>3.0.co;2-7. [DOI] [PubMed] [Google Scholar]
- 19.Turner MR, et al. Neuroimaging in amyotrophic lateral sclerosis. Biomark Med. 2012;6:319–337. doi: 10.2217/bmm.12.26. [DOI] [PubMed] [Google Scholar]
- 20.Pike VW. PET radiotracers: crossing the blood–brain barrier and surviving metabolism. Trends Pharmacol Sci. 2009;30:431–440. doi: 10.1016/j.tips.2009.05.005. [DOI] [PMC free article] [PubMed] [Google Scholar]
- 21.Kiernan JA, Hudson AJ. Frontal lobe atrophy in motor neuron diseases. Brain. 1994;117:747–757. doi: 10.1093/brain/117.4.747. [DOI] [PubMed] [Google Scholar]
- 22.Ellis CM, et al. Volumetric analysis reveals corticospinal tract degeneration and extramotor involvement in ALS. Neurology. 2001;57:1571–1578. doi: 10.1212/wnl.57.9.1571. [DOI] [PubMed] [Google Scholar]
- 23.Mezzapesa DM, et al. Whole-brain and regional brain atrophy in amyotrophic lateral sclerosis. AJNR Am J Neuroradiol. 2007;28:255–259. [PMC free article] [PubMed] [Google Scholar]
- 24.Chang JL, et al. A voxel-based morphometry study of patterns of brain atrophy in ALS and ALS/FTLD. Neurology. 2005;65:75–80. doi: 10.1212/01.wnl.0000167602.38643.29. [DOI] [PubMed] [Google Scholar]
- 25.Kassubek J, et al. Global brain atrophy and corticospinal tract alterations in ALS, as investigated by voxel-based morphometry of 3-D MRI. Amyotroph Lateral Scler Other Motor Neuron Disord. 2005;6:213–220. doi: 10.1080/14660820510038538. [DOI] [PubMed] [Google Scholar]
- 26.Grosskreutz J, et al. Widespread sensorimotor and frontal cortical atrophy in amyotrophic lateral sclerosis. BMC Neurol. 2006;6:17. doi: 10.1186/1471-2377-6-17. [DOI] [PMC free article] [PubMed] [Google Scholar]
- 27.Turner MR, et al. Volumetric cortical loss in sporadic and familial amyotrophic lateral sclerosis. Amyotroph Lateral Scler. 2007;8:343–347. doi: 10.1080/17482960701538734. [DOI] [PubMed] [Google Scholar]
- 28.Agosta F, et al. Voxel-based morphometry study of brain volumetry and diffusivity in amyotrophic lateral sclerosis patients with mild disability. Hum Brain Mapp. 2007;28:1430–1438. doi: 10.1002/hbm.20364. [DOI] [PMC free article] [PubMed] [Google Scholar]
- 29.Roccatagliata L, Bonzano L, Mancardi G, Canepa C, Caponnetto C. Detection of motor cortex thinning and corticospinal tract involvement by quantitative MRI in amyotrophic lateral sclerosis. Amyotroph Lateral Scler. 2009;10:47–52. doi: 10.1080/17482960802267530. [DOI] [PubMed] [Google Scholar]
- 30.Verstraete E, et al. Structural MRI reveals cortical thinning in amyotrophic lateral sclerosis. J Neurol Neurosurg Psychiatry. 2012;83:383–388. doi: 10.1136/jnnp-2011-300909. [DOI] [PubMed] [Google Scholar]
- 31.Agosta F, et al. The cortical signature of amyotrophic lateral sclerosis. PLoS ONE. 2012;7:e42816. doi: 10.1371/journal.pone.0042816. [DOI] [PMC free article] [PubMed] [Google Scholar]
- 32.Libon DJ, et al. Deficits in concept formation in amyotrophic lateral sclerosis. Neuropsychology. 2012;26:422–429. doi: 10.1037/a0028668. [DOI] [PMC free article] [PubMed] [Google Scholar]
- 33.Agosta F, et al. Longitudinal assessment of grey matter contraction in amyotrophic lateral sclerosis: a tensor based morphometry study. Amyotroph Lateral Scler. 2009;10:168–174. doi: 10.1080/17482960802603841. [DOI] [PubMed] [Google Scholar]
- 34.Sudharshan N, et al. Degeneration of the mid-cingulate cortex in amyotrophic lateral sclerosis detected in vivo with MR spectroscopy. AJNR Am J Neuroradiol. 2011;32:403–407. doi: 10.3174/ajnr.A2289. [DOI] [PMC free article] [PubMed] [Google Scholar]
- 35.Pyra T, et al. Combined structural and neurochemical evaluation of the corticospinal tract in amyotrophic lateral sclerosis. Amyotroph Lateral Scler. 2010;11:157–165. doi: 10.3109/17482960902756473. [DOI] [PubMed] [Google Scholar]
- 36.Sarchielli P, et al. Magnetic resonance imaging and 1H-magnetic resonance spectroscopy in amyotrophic lateral sclerosis. Neuroradiology. 2001;43:189–197. doi: 10.1007/s002340000472. [DOI] [PubMed] [Google Scholar]
- 37.Wang S, et al. Amyotrophic lateral sclerosis: diffusion-tensor and chemical shift MR imaging at 3.0 T. Radiology. 2006;239:831–838. doi: 10.1148/radiol.2393050573. [DOI] [PubMed] [Google Scholar]
- 38.Mitsumoto H, et al. Quantitative objective markers for upper and lower motor neuron dysfunction in ALS. Neurology. 2007;68:1402–1410. doi: 10.1212/01.wnl.0000260065.57832.87. [DOI] [PubMed] [Google Scholar]
- 39.Pohl C, et al. Proton magnetic resonance spectroscopy of the motor cortex in 70 patients with amyotrophic lateral sclerosis. Arch Neurol. 2001;58:729–735. doi: 10.1001/archneur.58.5.729. [DOI] [PubMed] [Google Scholar]
- 40.Bowen BC, et al. MR imaging and localized proton spectroscopy of the precentral gyrus in amyotrophic lateral sclerosis. AJNR Am J Neuroradiol. 2000;21:647–658. [PMC free article] [PubMed] [Google Scholar]
- 41.Rule RR, et al. Reduced NAA in motor and non-motor brain regions in amyotrophic lateral sclerosis: a cross-sectional and longitudinal study. Amyotroph Lateral Scler Other Motor Neuron Disord. 2004;5:141–149. doi: 10.1080/14660820410017109. [DOI] [PMC free article] [PubMed] [Google Scholar]
- 42.Abe K, et al. Decrease in N-acetylaspartate/creatine ratio in the motor area and the frontal lobe in amyotrophic lateral sclerosis. Neuroradiology. 2001;43:537–541. doi: 10.1007/s002340000521. [DOI] [PubMed] [Google Scholar]
- 43.Lombardo F, et al. Diffusion tensor MRI and MR spectroscopy in long lasting upper motor neuron involvement in amyotrophic lateral sclerosis. Arch Ital Biol. 2009;147:69–82. [PubMed] [Google Scholar]
- 44.Schuff N, et al. Reanalysis of multislice 1H MRSI in amyotrophic lateral sclerosis. Magn Reson Med. 2001;45:513–516. doi: 10.1002/1522-2594(200103)45:3<513::aid-mrm1067>3.0.co;2-d. [DOI] [PubMed] [Google Scholar]
- 45.Bradley WG, Bowen BC, Pattany PM, Rotta F. 1H-magnetic resonance spectroscopy in amyotrophic lateral sclerosis. J Neurol Sci. 1999;169:84–86. doi: 10.1016/s0022-510x(99)00221-x. [DOI] [PubMed] [Google Scholar]
- 46.Han J, Ma L. Study of the features of proton MR spectroscopy (1H-MRS) on amyotrophic lateral sclerosis. J Magn Reson Imaging. 2010;31:305–308. doi: 10.1002/jmri.22053. [DOI] [PubMed] [Google Scholar]
- 47.Sivak S, et al. Proton magnetic resonance spectroscopy in patients with early stages of amyotrophic lateral sclerosis. Neuroradiology. 2010;52:1079–1085. doi: 10.1007/s00234-010-0685-6. [DOI] [PubMed] [Google Scholar]
- 48.van der Graaff MM, et al. MR spectroscopy findings in early stages of motor neuron disease. AJNR Am J Neuroradiol. 2010;31:1799–1806. doi: 10.3174/ajnr.A2217. [DOI] [PMC free article] [PubMed] [Google Scholar]
- 49.Ellis CM, et al. A proton magnetic resonance spectroscopic study in ALS: correlation with clinical findings. Neurology. 1998;51:1104–1109. doi: 10.1212/wnl.51.4.1104. [DOI] [PubMed] [Google Scholar]
- 50.Unrath A, Ludolph AC, Kassubek J. Brain metabolites in definite amyotrophic lateral sclerosis. a longitudinal proton magnetic resonance spectroscopy study. J Neurol. 2007;254:1099–1106. doi: 10.1007/s00415-006-0495-2. [DOI] [PubMed] [Google Scholar]
- 51.Kalra S, Hanstock CC, Martin WR, Allen PS, Johnston WS. Detection of cerebral degeneration in amyotrophic lateral sclerosis using high-field magnetic resonance spectroscopy. Arch Neurol. 2006;63:1144–1148. doi: 10.1001/archneur.63.8.1144. [DOI] [PubMed] [Google Scholar]
- 52.Kaufmann P, et al. Objective tests for upper motor neuron involvement in amyotrophic lateral sclerosis (ALS) Neurology. 2004;62:1753–1757. doi: 10.1212/01.wnl.0000125182.17874.59. [DOI] [PubMed] [Google Scholar]
- 53.Foerster BR, et al. Decreased motor cortex γ-aminobutyric acid in amyotrophic lateral sclerosis. Neurology. 2012;78:1596–1600. doi: 10.1212/WNL.0b013e3182563b57. [DOI] [PMC free article] [PubMed] [Google Scholar]
- 54.Mohammadi B, et al. Changes of resting state brain networks in amyotrophic lateral sclerosis. Exp Neurol. 2009;217:147–153. doi: 10.1016/j.expneurol.2009.01.025. [DOI] [PubMed] [Google Scholar]
- 55.Jelsone-Swain LM, et al. Reduced interhemispheric functional connectivity in the motor cortex during rest in limb-onset amyotrophic lateral sclerosis. Front Syst Neurosci. 2010;4:158. doi: 10.3389/fnsys.2010.00158. [DOI] [PMC free article] [PubMed] [Google Scholar]
- 56.Tedeschi G, et al. Interaction between aging and neurodegeneration in amyotrophic lateral sclerosis. Neurobiol Aging. 2012;33:886–898. doi: 10.1016/j.neurobiolaging.2010.07.011. [DOI] [PubMed] [Google Scholar]
- 57.Verstraete E, et al. Motor network degeneration in amyotrophic lateral sclerosis: a structural and functional connectivity study. PLoS ONE. 2010;2012:e13664. doi: 10.1371/journal.pone.0013664. [DOI] [PMC free article] [PubMed] [Google Scholar]
- 58.Agosta F, et al. Sensorimotor functional connectivity changes in amyotrophic lateral sclerosis. Cereb Cortex. 2011;21:2291–2298. doi: 10.1093/cercor/bhr002. [DOI] [PubMed] [Google Scholar]
- 59.Douaud G, Filippini N, Knight S, Talbot K, Turner MR. Integration of structural and functional magnetic resonance imaging in amyotrophic lateral sclerosis. Brain. 2011;134:3470–3479. doi: 10.1093/brain/awr279. [DOI] [PubMed] [Google Scholar]
- 60.Zanette G, et al. Changes in motor cortex inhibition over time in patients with amyotrophic lateral sclerosis. J Neurol. 2002;249:1723–1728. doi: 10.1007/s00415-002-0926-7. [DOI] [PubMed] [Google Scholar]
- 61.Kew JJ, et al. Cortical function in amyotrophic lateral sclerosis. A positron emission tomography study. Brain. 1993;116:655–680. doi: 10.1093/brain/116.3.655. [DOI] [PubMed] [Google Scholar]
- 62.Turner MR, et al. Evidence of widespread cerebral microglial activation in amyotrophic lateral sclerosis: an [11C](R)-PK11195 positron emission tomography study. Neurobiol Dis. 2004;15:601–609. doi: 10.1016/j.nbd.2003.12.012. [DOI] [PubMed] [Google Scholar]
- 63.Turner MR, et al. Distinct cerebral lesions in sporadic and ‘D90A’ SOD1 ALS: studies with [11C]flumazenil PET. Brain. 2005;128:1323–1329. doi: 10.1093/brain/awh509. [DOI] [PubMed] [Google Scholar]
- 64.Turner MR, et al. Abnormal cortical excitability in sporadic but not homozygous D90A SOD1 ALS. J Neurol Neurosurg Psychiatry. 2005;76:1279–1285. doi: 10.1136/jnnp.2004.054429. [DOI] [PMC free article] [PubMed] [Google Scholar]
- 65.Turner MR, Kiernan MC. Does interneuronal dysfunction contribute to neurodegeneration in amyotrophic lateral sclerosis? Amyotroph Lateral Scler. 2012;13:245–250. doi: 10.3109/17482968.2011.636050. [DOI] [PubMed] [Google Scholar]
- 66.Thivard L, et al. Diffusion tensor imaging and voxel based morphometry study in amyotrophic lateral sclerosis: relationships with motor disability. J Neurol Neurosurg Psychiatry. 2007;78:889–892. doi: 10.1136/jnnp.2006.101758. [DOI] [PMC free article] [PubMed] [Google Scholar]
- 67.Abe O, et al. Amyotrophic lateral sclerosis: diffusion tensor tractography and voxel-based analysis. NMR Biomed. 2004;17:411–416. doi: 10.1002/nbm.907. [DOI] [PubMed] [Google Scholar]
- 68.Agosta F, et al. Assessment of white matter tract damage in patients with amyotrophic lateral sclerosis: a diffusion tensor MR imaging tractography study. AJNR Am J Neuroradiol. 2010;31:1457–1461. doi: 10.3174/ajnr.A2105. [DOI] [PMC free article] [PubMed] [Google Scholar]
- 69.Cosottini M, et al. Diffusion-tensor MR imaging of corticospinal tract in amyotrophic lateral sclerosis and progressive muscular atrophy. Radiology. 2005;237:258–264. doi: 10.1148/radiol.2371041506. [DOI] [PubMed] [Google Scholar]
- 70.Cosottini M, et al. Evaluation of corticospinal tract impairment in the brain of patients with amyotrophic lateral sclerosis by using diffusion tensor imaging acquisition schemes with different numbers of diffusion-weighting directions. J Comput Assist Tomogr. 2010;34:746–750. doi: 10.1097/RCT.0b013e3181e35129. [DOI] [PubMed] [Google Scholar]
- 71.Filippini N, et al. Corpus callosum involvement is a consistent feature of amyotrophic lateral sclerosis. Neurology. 2010;75:1645–1652. doi: 10.1212/WNL.0b013e3181fb84d1. [DOI] [PMC free article] [PubMed] [Google Scholar]
- 72.Iwata NK, et al. White matter alterations differ in primary lateral sclerosis and amyotrophic lateral sclerosis. Brain. 2011;134:2642–2655. doi: 10.1093/brain/awr178. [DOI] [PMC free article] [PubMed] [Google Scholar]
- 73.Iwata NK, et al. Evaluation of corticospinal tracts in ALS with diffusion tensor MRI and brainstem stimulation. Neurology. 2008;70:528–532. doi: 10.1212/01.wnl.0000299186.72374.19. [DOI] [PubMed] [Google Scholar]
- 74.Sage CA, Peeters RR, Gorner A, Robberecht W, Sunaert S. Quantitative diffusion tensor imaging in amyotrophic lateral sclerosis. Neuroimage. 2007;34:486–499. doi: 10.1016/j.neuroimage.2006.09.025. [DOI] [PubMed] [Google Scholar]
- 75.Sach M, et al. Diffusion tensor MRI of early upper motor neuron involvement in amyotrophic lateral sclerosis. Brain. 2004;127:340–350. doi: 10.1093/brain/awh041. [DOI] [PubMed] [Google Scholar]
- 76.Chapman MC, Jelsone-Swain LM, Johnson TD, Gruis KL, Welsh RC. Diffusion tensor MRI of the corpus callosum in amyotrophic lateral sclerosis. J Magn Res Imaging. doi: 10.1002/jmri.24218. http://dx.doi.org/10.1002/jmri.24218. [DOI] [PMC free article] [PubMed]
- 77.Ben Bashat D, et al. A potential tool for the diagnosis of ALS based on diffusion tensor imaging. Amyotroph Lateral Scler. 2011;12:398–405. doi: 10.3109/17482968.2011.582646. [DOI] [PubMed] [Google Scholar]
- 78.Stagg CJ, et al. Whole-brain magnetic resonance spectroscopic imaging measures are related to disability in ALS. Neurology. 2013;80:610–615. doi: 10.1212/WNL.0b013e318281ccec. [DOI] [PMC free article] [PubMed] [Google Scholar]
- 79.Metwalli NS, et al. Utility of axial and radial diffusivity from diffusion tensor MRI as markers of neurodegeneration in amyotrophic lateral sclerosis. Brain Res. 2010;1348:156–164. doi: 10.1016/j.brainres.2010.05.067. [DOI] [PubMed] [Google Scholar]
- 80.van der Graaff MM, et al. Upper and extramotoneuron involvement in early motoneuron disease: a diffusion tensor imaging study. Brain. 2011;134:1211–1228. doi: 10.1093/brain/awr016. [DOI] [PubMed] [Google Scholar]
- 81.Ellis CM, et al. Diffusion tensor MRI assesses corticospinal tract damage in ALS. Neurology. 1999;53:1051–1058. doi: 10.1212/wnl.53.5.1051. [DOI] [PubMed] [Google Scholar]
- 82.Prell T, et al. Diffusion tensor imaging patterns differ in bulbar and limb onset amyotrophic lateral sclerosis. Clin Neurol Neurosurg. doi: 10.1016/j.clineuro.2012.11.031. http://dx.doi.org/10.1016/j.clineuro.2012.11.031. [DOI] [PubMed]
- 83.Blain CR, et al. Differential corticospinal tract degeneration in homozygous ‘D90A’ SOD-1 ALS and sporadic ALS. J Neurol Neurosurg Psychiatry. 2011;82:843–849. doi: 10.1136/jnnp.2010.236018. [DOI] [PMC free article] [PubMed] [Google Scholar]
- 84.Schimrigk SK, et al. Diffusion tensor imaging-based fractional anisotropy quantification in the corticospinal tract of patients with amyotrophic lateral sclerosis using a probabilistic mixture model. Am J Neuroradiol. 2007;28:724–730. [PMC free article] [PubMed] [Google Scholar]
- 85.Graham JM, et al. Diffusion tensor imaging for the assessment of upper motor neuron integrity in ALS. Neurology. 2004;63:2111–2119. doi: 10.1212/01.wnl.0000145766.03057.e7. [DOI] [PubMed] [Google Scholar]
- 86.Senda J, et al. Correlation between pyramidal tract degeneration and widespread white matter involvement in amyotrophic lateral sclerosis: a study with tractography and diffusion-tensor imaging. Amyotroph Lateral Scler. 2009;10:288–294. doi: 10.3109/17482960802651717. [DOI] [PubMed] [Google Scholar]
- 87.Ciccarelli O, et al. Investigation of white matter pathology in ALS and PLS using tract-based spatial statistics. Hum Brain Mapp. 2009;30:615–624. doi: 10.1002/hbm.20527. [DOI] [PMC free article] [PubMed] [Google Scholar]
- 88.Toosy AT, et al. Diffusion tensor imaging detects corticospinal tract involvement at multiple levels in amyotrophic lateral sclerosis. J Neurol Neurosurg Psychiatry. 2003;74:1250–1257. doi: 10.1136/jnnp.74.9.1250. [DOI] [PMC free article] [PubMed] [Google Scholar]
- 89.Menke RA, et al. Fractional anisotropy in the posterior limb of the internal capsule and prognosis in amyotrophic lateral sclerosis. Arch Neurol. 2012;69:1493–1499. doi: 10.1001/archneurol.2012.1122. [DOI] [PubMed] [Google Scholar]
- 90.Keil C, et al. Longitudinal diffusion tensor imaging in amyotrophic lateral sclerosis. BMC Neurosci. 2012;13:141. doi: 10.1186/1471-2202-13-141. [DOI] [PMC free article] [PubMed] [Google Scholar]
- 91.Zhang Y, et al. Progression of white matter degeneration in amyotrophic lateral sclerosis: a diffusion tensor imaging study. Amyotroph Lateral Scler. 2011;12:421–429. doi: 10.3109/17482968.2011.593036. [DOI] [PMC free article] [PubMed] [Google Scholar]
- 92.Agosta F, et al. A longitudinal diffusion tensor MRI study of the cervical cord and brain in amyotrophic lateral sclerosis patients. J Neurol Neurosurg Psychiatry. 2009;80:53–55. doi: 10.1136/jnnp.2008.154252. [DOI] [PubMed] [Google Scholar]
- 93.Blain CR, et al. A longitudinal study of diffusion tensor MRI in ALS. Amyotroph Lateral Scler. 2007;8:348–355. doi: 10.1080/17482960701548139. [DOI] [PubMed] [Google Scholar]
- 94.Verstraete E, Veldink JH, Mandl RC, van den Berg LH, van den Heuvel MP. Impaired structural motor connectome in amyotrophic lateral sclerosis. PLoS ONE. 2011;6:e24239. doi: 10.1371/journal.pone.0024239. [DOI] [PMC free article] [PubMed] [Google Scholar]
- 95.Ravits JM, La Spada AR. ALS motor phenotype heterogeneity, focality, and spread: deconstructing motor neuron degeneration. Neurology. 2009;73:805–811. doi: 10.1212/WNL.0b013e3181b6bbbd. [DOI] [PMC free article] [PubMed] [Google Scholar]
- 96.Yin H, et al. Combined MR spectroscopic imaging and diffusion tensor MRI visualizes corticospinal tract degeneration in amyotrophic lateral sclerosis. J Neurol. 2004;251:1249–1254. doi: 10.1007/s00415-004-0526-9. [DOI] [PubMed] [Google Scholar]
- 97.Govind V, et al. Comprehensive evaluation of corticospinal tract metabolites in amyotrophic lateral sclerosis using whole-brain 1H MR spectroscopy. PLoS ONE. 2012;7:e35607. doi: 10.1371/journal.pone.0035607. [DOI] [PMC free article] [PubMed] [Google Scholar]
- 98.Song SK, et al. Demyelination increases radial diffusivity in corpus callosum of mouse brain. Neuroimage. 2005;26:132–140. doi: 10.1016/j.neuroimage.2005.01.028. [DOI] [PubMed] [Google Scholar]
- 99.Smith MC. Nerve fibre degeneration in the brain in amyotrophic lateral sclerosis. J Neurol Neurosurg Psychiatry. 1960;23:269–282. doi: 10.1136/jnnp.23.4.269. [DOI] [PMC free article] [PubMed] [Google Scholar]
- 100.Song SK, et al. Diffusion tensor imaging detects and differentiates axon and myelin degeneration in mouse optic nerve after retinal ischemia. Neuroimage. 2003;20:1714–1722. doi: 10.1016/j.neuroimage.2003.07.005. [DOI] [PubMed] [Google Scholar]
- 101.Cirillo M, et al. Widespread microstructural white matter involvement in amyotrophic lateral sclerosis: a whole-brain DTI study. AJNR Am J Neuroradiol. 2012;33:1102–1108. doi: 10.3174/ajnr.A2918. [DOI] [PMC free article] [PubMed] [Google Scholar]
- 102.Yamauchi H, et al. Corpus callosum atrophy in amyotrophic lateral sclerosis. J Neurol Sci. 1995;134:189–196. doi: 10.1016/0022-510x(95)00220-6. [DOI] [PubMed] [Google Scholar]
- 103.Chapman MC, et al. Corpus callosum area in amyotrophic lateral sclerosis. Amyotroph Lateral Scler. 2012;13:589–591. doi: 10.3109/17482968.2012.708935. [DOI] [PMC free article] [PubMed] [Google Scholar]
- 104.Ashburner J, Friston KJ. Why voxel-based morphometry should be used. Neuroimage. 2001;14:1238–1243. doi: 10.1006/nimg.2001.0961. [DOI] [PubMed] [Google Scholar]
- 105.Bartels C, et al. Callosal dysfunction in amyotrophic lateral sclerosis correlates with diffusion tensor imaging of the central motor system. Neuromuscul Disord. 2008;18:398–407. doi: 10.1016/j.nmd.2008.02.005. [DOI] [PubMed] [Google Scholar]
- 106.Bak TH, Chandran S. What wires together dies together: verbs, actions and neurodegeneration in motor neuron disease. Cortex. 2012;48:936–944. doi: 10.1016/j.cortex.2011.07.008. [DOI] [PubMed] [Google Scholar]
- 107.Abrahams S, et al. Frontotemporal white matter changes in amyotrophic lateral sclerosis. J Neurol. 2005;252:321–331. doi: 10.1007/s00415-005-0646-x. [DOI] [PubMed] [Google Scholar]
- 108.Murphy JM, et al. Continuum of frontal lobe impairment in amyotrophic lateral sclerosis. Arch Neurol. 2007;64:530–534. doi: 10.1001/archneur.64.4.530. [DOI] [PubMed] [Google Scholar]
- 109.Senda J, et al. Progressive and widespread brain damage in ALS: MRI voxel-based morphometry and diffusion tensor imaging study. Amyotroph Lateral Scler. 2011;12:59–69. doi: 10.3109/17482968.2010.517850. [DOI] [PubMed] [Google Scholar]
- 110.Usman U, et al. Mesial prefrontal cortex degeneration in amyotrophic lateral sclerosis: a high-field proton MR spectroscopy study. AJNR Am J Neuroradiol. 2011;32:1677–1680. doi: 10.3174/ajnr.A2590. [DOI] [PMC free article] [PubMed] [Google Scholar]
- 111.Sarro L, et al. Cognitive functions and white matter tract damage in amyotrophic lateral sclerosis: a diffusion tensor tractography study. AJNR Am J Neuroradiol. 2011;32:1866–1872. doi: 10.3174/ajnr.A2658. [DOI] [PMC free article] [PubMed] [Google Scholar]
- 112.Tsujimoto M, et al. Behavioral changes in early ALS correlate with voxel-based morphometry and diffusion tensor imaging. J Neurol Sci. 2011;307:34–40. doi: 10.1016/j.jns.2011.05.025. [DOI] [PubMed] [Google Scholar]
- 113.Schreiber H, et al. Cognitive function in bulbar- and spinal-onset amyotrophic lateral sclerosis. A longitudinal study in 52 patients. J Neurol. 2005;252:772–781. doi: 10.1007/s00415-005-0739-6. [DOI] [PubMed] [Google Scholar]
- 114.Abrahams S, et al. Frontal lobe dysfunction in amyotrophic lateral sclerosis. A PET study. Brain. 1996;119:2105–2120. doi: 10.1093/brain/119.6.2105. [DOI] [PubMed] [Google Scholar]
- 115.Tanaka M, et al. Cerebral blood flow and oxygen metabolism in progressive dementia associated with amyotrophic lateral sclerosis. J Neurol Sci. 1993;120:22–28. doi: 10.1016/0022-510x(93)90019-u. [DOI] [PubMed] [Google Scholar]
- 116.Cistaro A, et al. Brain hypermetabolism in amyotrophic lateral sclerosis: a FDG PET study in ALS of spinal and bulbar onset. Eur J Nucl Med Mol Imaging. 2012;39:251–259. doi: 10.1007/s00259-011-1979-6. [DOI] [PubMed] [Google Scholar]
- 117.Wicks P, et al. Neuronal loss associated with cognitive performance in amyotrophic lateral sclerosis: an (11C)-flumazenil PET study. Amyotroph Lateral Scler. 2008;9:43–49. doi: 10.1080/17482960701737716. [DOI] [PubMed] [Google Scholar]
- 118.Turner MR, et al. Cortical 5-HT1A receptor binding in patients with homozygous D90A SOD1 vs sporadic ALS. Neurology. 2007;68:1233–1235. doi: 10.1212/01.wnl.0000259083.31837.64. [DOI] [PubMed] [Google Scholar]
- 119.DeJesus-Hernandez M, et al. Expanded GGGGCC hexanucleotide repeat in noncoding region of C9ORF72 causes chromosome 9p-linked FTD and ALS. Neuron. 2011;72:245–256. doi: 10.1016/j.neuron.2011.09.011. [DOI] [PMC free article] [PubMed] [Google Scholar]
- 120.Sharma KR, Sheriff S, Maudsley A, Govind V. Diffusion tensor imaging of basal ganglia and thalamus in amyotrophic lateral sclerosis. J Neuroimaging. 2012;23:368–374. doi: 10.1111/j.1552-6569.2011.00679.x. [DOI] [PMC free article] [PubMed] [Google Scholar]
- 121.Sharma KR, Saigal G, Maudsley AA, Govind V. 1H MRS of basal ganglia and thalamus in amyotrophic lateral sclerosis. NMR Biomed. 2011;24:1270–1276. doi: 10.1002/nbm.1687. [DOI] [PMC free article] [PubMed] [Google Scholar]
- 122.Takahashi H, et al. Evidence for a dopaminergic deficit in sporadic amyotrophic lateral sclerosis on positron emission scanning. Lancet. 1993;342:1016–1018. doi: 10.1016/0140-6736(93)92878-w. [DOI] [PubMed] [Google Scholar]
- 123.Pioro EP, Majors AW, Mitsumoto H, Nelson DR, Ng TC. 1H-MRS evidence of neurodegeneration and excess glutamate + glutamine in ALS medulla. Neurology. 1999;53:71–79. doi: 10.1212/wnl.53.1.71. [DOI] [PubMed] [Google Scholar]
- 124.Johansson A, et al. Evidence for astrocytosis in ALS demonstrated by [11C](L)-deprenyl-D2 PET. J Neurol Sci. 2007;255:17–22. doi: 10.1016/j.jns.2007.01.057. [DOI] [PubMed] [Google Scholar]
- 125.Valsasina P, et al. Diffusion anisotropy of the cervical cord is strictly associated with disability in amyotrophic lateral sclerosis. J Neurol Neurosurg Psychiatry. 2007;78:480–484. doi: 10.1136/jnnp.2006.100032. [DOI] [PMC free article] [PubMed] [Google Scholar]
- 126.Cohen-Adad J, et al. Involvement of spinal sensory pathway in ALS and specificity of cord atrophy to lower motor neuron degeneration. Amyotroph Lateral Scler Frontotemporal Degener. 2013;14:30–38. doi: 10.3109/17482968.2012.701308. [DOI] [PubMed] [Google Scholar]
- 127.Ikeda K, et al. Relationship between cervical cord 1H-magnetic resonance spectroscopy and clinoco-electromyographic profile in amyotrophic lateral sclerosis. Muscle Nerve. 2013;47:61–67. doi: 10.1002/mus.23467. [DOI] [PubMed] [Google Scholar]
- 128.Carew JD, et al. Presymptomatic spinal cord neurometabolic findings in SOD1-positive people at risk for familial ALS. Neurology. 2011;77:1370–1375. doi: 10.1212/WNL.0b013e318231526a. [DOI] [PMC free article] [PubMed] [Google Scholar]
- 129.Carew JD, et al. Magnetic resonance spectroscopy of the cervical cord in amyotrophic lateral sclerosis. Amyotroph Lateral Scler. 2011;12:185–191. doi: 10.3109/17482968.2010.515223. [DOI] [PubMed] [Google Scholar]
- 130.Foerster BR, et al. Diagnostic accuracy using diffusion tensor imaging in the diagnosis of ALS: a meta-analysis. Acad Radiol. 2012;19:1075–1086. doi: 10.1016/j.acra.2012.04.012. [DOI] [PMC free article] [PubMed] [Google Scholar]
- 131.Turner MR, et al. Towards a neuroimaging biomarker for amyotrophic lateral sclerosis. Lancet Neurol. 2011;10:400–403. doi: 10.1016/S1474-4422(11)70049-7. [DOI] [PubMed] [Google Scholar]
- 132.Welsh RC, Jelsone-Swain LM, Foerster BR. The utility of independent component analysis and machine learning in the identification of the amyotrophic lateral sclerosis diseased brain. Front Hum Neurosci. 2013;7:1–7. doi: 10.3389/fnhum.2013.00251. [DOI] [PMC free article] [PubMed] [Google Scholar]
- 133.Testa D, Lovati R, Ferrarini M, Salmoiraghi F, Filippini G. Survival of 793 patients with amyotrophic lateral sclerosis diagnosed over a 28-year period. Amyotroph Lateral Scler Other Motor Neuron Disord. 2004;5:208–212. [PubMed] [Google Scholar]
- 134.Zoccolella S, et al. Predictors of long survival in amyotrophic lateral sclerosis: a population-based study. J Neurol Sci. 2008;268:28–32. doi: 10.1016/j.jns.2007.10.023. [DOI] [PubMed] [Google Scholar]
- 135.Kalra S, Vitale A, Cashman NR, Genge A, Arnold DL. Cerebral degeneration predicts survival in amyotrophic lateral sclerosis. J Neurol Neurosurg Psychiatry. 2006;77:1253–1255. doi: 10.1136/jnnp.2006.090696. [DOI] [PMC free article] [PubMed] [Google Scholar]
- 136.Agosta F, et al. MRI predictors of long-term evolution in amyotrophic lateral sclerosis. Eur J Neurosci. 2010;32:1490–1496. doi: 10.1111/j.1460-9568.2010.07445.x. [DOI] [PubMed] [Google Scholar]