Abstract
Objective:
To investigate the agreement between two international criteria for classification of children and adolescents nutritional status.
Methods:
The study included 778 girls and 863 boys aged from six to 13 years old. Body mass and height were measured and used to calculate the body mass index. Nutritional status was classified according to the cut-off points defined by the World Health Organization and the International Obesity Task Force. The agreement was evaluated using Kappa statistic and weighted Kappa.
Results:
In order to classify the nutritional status, the agreement between the criteria was higher for the boys (Kappa 0.77) compared to girls (Kappa 0.61). The weighted Kappa was also higher for boys (0.85) in comparison to girls (0.77). Kappa index varied according to age. When the nutritional status was classified in only two categories - appropriate (thinness + accentuated thinness + eutrophy) and overweight (overweight + obesity + severe obesity) -, the Kappa index presented higher values than those related to the classification in six categories.
Conclusions:
A substantial agreement was observed between the criteria, being higher in males and varying according to the age.
Keywords: body mass index, adolescent, nutritional status, obesity
Abstract
Objetivo:
Investigar la concordancia entre dos criterios internacionales de clasificación del estado nutricional de niños y adolescentes.
Métodos:
Participaron del estudio 778 muchachas y 863 muchachos de seis a 13 años. La masa corporal y la estatura fueron medidas y utilizadas en el cálculo del índice de masa corporal. El estado nutricional fue clasificado conforme a los puntos de corte de la World Health Organization y de la International Obesity Task Force. Se evaluó la concordancia mediante la estadística Kappa y el Kappa ponderado.
Resultados:
Para clasificar el estado nutricional, la concordancia observada entre los criterios fue superior para los muchachos - índice Kappa de 0,774, en comparación con las muchachas - índice Kappa 0,608. El Kappa ponderado fue superior para los muchachos (0,854), en comparación con las muchachas (0,773). Se observó variación del índice Kappa conforme a la edad. Al clasificarse el estado nutricional solamente en dos categorías - adecuado (delgadez + delgadez acentuada + eutrofia) y exceso de peso (sobrepeso + obesidad + obesidad grave) -, el índice Kappa presentó valores superiores a los de la clasificación en seis categorías.
Conclusiones:
Se observó la concordancia sustancial entre los criterios, siendo mayor en el sexo masculino y variando conforme a la edad.
Introduction
The increasing prevalence of obesity among children and adolescents was one of the main themes on public health research in the last decade( 1 - 7 ). Based on observations of greater probability of clinical manifestations among children and adolescents with excess body weight( 8 - 10 ), obesity is considered a serious risk factor for morbidity in adult life and is currently characterized as a major public health issue( 8 ).
Among the evaluation measures, body mass index (BMI) is the most frequently used to characterize the nutritional status of young people and adults. However, the variability of anthropometric measures in children and adolescents in the same age group causes confusion in the use of this measure. Observing this limitation, two institutions, the World Health Organization (WHO) and the International Obesity Task Force (IOTF) developed, with international samples, cut-offs to classify the nutritional status based on BMI, considering age and sex.
In 2007, the WHO published new cut-off points for BMI in children and adolescents( 11 ). In this publication, two different methodologies were used to develop the cut-off points. The classifications for children aged up to 5 years were established with the use of databases from prospective studies with follow-up since the prenatal period. To do so, a strict control was required and samples from different countries were selected and monitored based on criteria such as type of delivery, breastfeeding, and presence of diseases. Therefore, only children with the best environmental conditions to favor physical growth were included. For children older than 5 years, there was a renewal in previous cut-offs, from cross-sectional studies and, after new mathematical analysis, these were published. Regardless of age, the WHO presented, from these points, six different classifications of nutritional status (BMI).
The IOTF, in 2000, presented the proposal of classification of excess weight and obesity, building its curve based on BMI values of 25 and 30 at 18 years and suggested classifications divided by age and sex. In 2012, they released an update of the cut-offs proposed in previous years( 12 ). For this, international samples were used, and the sample selection was based on national representativeness; thus, with 97,876 boys and 94,851 girls, the IOTF presented the construction of the curve based on the method of the LMS curves (skewness, median, and coefficient of variation) and proposed cut-off points for BMI, which resulted in 6 different classifications, similar to the WHO, from pronounced thinness up to severe obesity.
Methodological differences in the formulation of the cut-off points between IOTF and WHO are evident and, consequently, were intensified in the comparisons between the criteria in recent years. The initiative was justified, in most studies, by the attempt to facilitate decision-making regarding the criteria to be employed. However, the main publications performed the comparison by dividing the group into two classifications (normal weight and overweight) and, in some cases, into three classifications (normal weight, overweight, and obesity). As shown in some studies on children and adolescents, differences in the appearance of clinical signs may be observed in the comparison between obesity and severe obesity and, by aggregating these categories, manifestations tend to be diluted. If compared to overweight and normal weight, they may not indicate the actual severity of the risk attributed to severe excess weight or, in other cases, to pronounced thinness.
Thus, the aim of this study was to investigate the agreement in the classification of nutritional status (in six categories) of children and adolescents from two international criteria.
Method
The study sample was extracted from four research projects. The first consisted of a sample from the municipality of Maringá, state of Paraná, and the second was composed of children and adolescents from Rio Claro, state of São Paulo. The third group was composed of participants from an interdisciplinary program for the treatment of obesity in the municipality of Guarapuava, state of Paraná, and the fourth contains a sample from the municipality of Londrina, state of Paraná. The four groups totaled 1,641 participants, from 6 to 13 years, divided into 778 girls and 863 boys. Therefore, the study is characterized as a descriptive cross-sectional study. Those responsible for the projects approved the use of the databases, and all projects were approved by the local Research Ethics Committee in the region of each survey. Participants and/or their parents/guardians signed a consent form for the research and publication of data. The sample's nature in this study does not characterize a methodological problem, since the correlation analyses refer to the classification of the same subject in different methodologies.
Anthropometric measurements were performed by experienced professionals and the techniques used in all projects were based on the same protocols. Measures of body mass (BM) were obtained with a digital scale with accuracy of 0.1kg. Height was measured with a stadiometer attached to the wall or wooden, with a precision of 0.1cm, following the guidelines in the literature( 13 ) and, from the ratio of MC by height squared, we obtained the BMI. The classifications of BMI were performed according to the cut-offs for age and sex proposed by the WHO (2007) and the IOTF (2012)( 11 , 12 ).
The classification process was conducted by 4 researchers in 2 different ways: manually and by conditional equations performed in the software Microsoft(r) Excel 2007 (Redmond, Washington, United States). At the end of this process, data underwent a procedure for conference and comparison. In case of divergence, the result was corrected.
Data analysis was divided into two stages. Initially, the degree of agreement between the criteria (WHO and IOTF) was verified with the Cohen's Kappa statistics and the percentage of agreement. At this stage, we considered the six categories of classification of nutritional status. Additionally, we used the weighted Kappa statistic method, which confirms the agreement of the classifications assuming different weights according to the distances in the categories between the criteria.
The Kappa coefficients range from 0 (no agreement) and 1 (total agreement). Kappa results until 0.19 were classified as poor agreement; from 0.20 to 0.39, fair agreement; from 0.40 to 0.59, moderate agreement; from 0.60 to 0.79, substantial agreement; and values above 0.80, almost perfect agreement(14). In the second stage of analysis, the classification categories of nutritional status were clustered, resulting in only two: eutrophic (thinness + pronounced thinness + eutrophia) and excess weight (overweight + obesity + severe obesity). The results of prevalence were compared using the McNemar paired test. Data were presented in absolute and relative frequencies. The level of significance was established at p<0.05. Data were analyzed with the Statistical Package for the Social Sciences (SPSS), version 20.0 (IBM, Armonk, New York, United States) and GraphPad (GraphPad Software, Inc. San Diego, California, United States).
Results
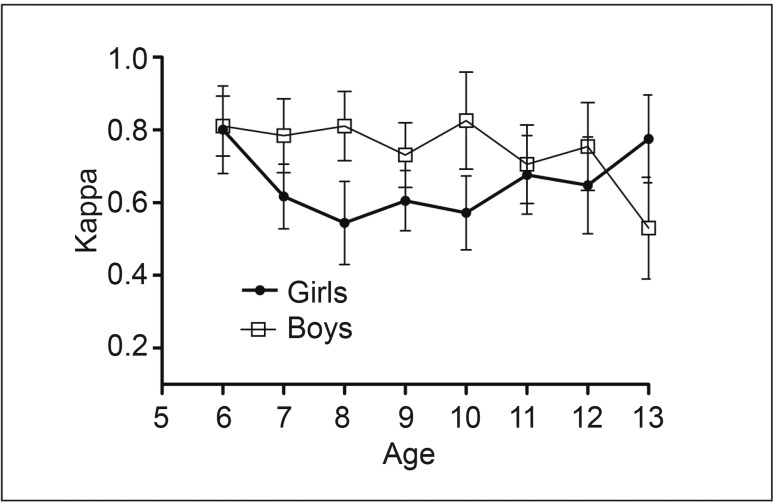
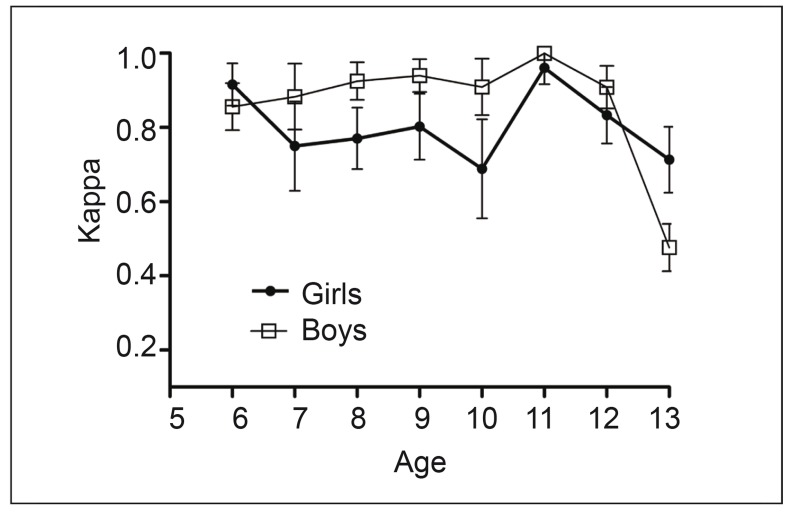
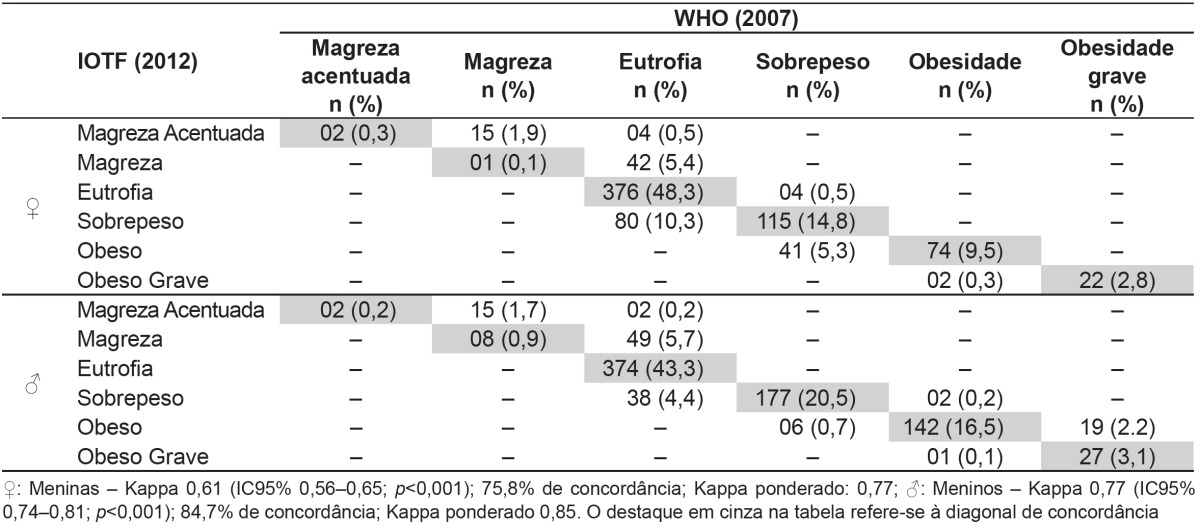
Table 1 presents the results of the classification of the nutritional status according to the criteria used by the WHO Z score (2007) and the IOTF (2012). It was observed a substantial agreement, with a Kappa index of 0.61 for girls and 0.77 for boys. The agreement, observed in the result of the weighted Kappa, was higher for boys (0.85) in comparison to the girls (0.77). Figure 1 shows the Kappa index according to age range and sex. In the age range investigated, a better agreement is observed in the classification of BMI for boys. To detect excess weight, data were divided according to the classification of the nutritional state in two groups: Normal and Excess weight. There was an excellent agreement for the classification of BMI in boys (0.91), while in girls the agreement was high (0.77) (Table 2). In Figure 2, we showed the Kappa coefficient for the classification of excess weight according to age and sex. The difference between boys and girls can be observed and these agreement results were higher than those found in Figure 1.
Table 1. Frequency and agreement for the classification of nutritional status by sex.
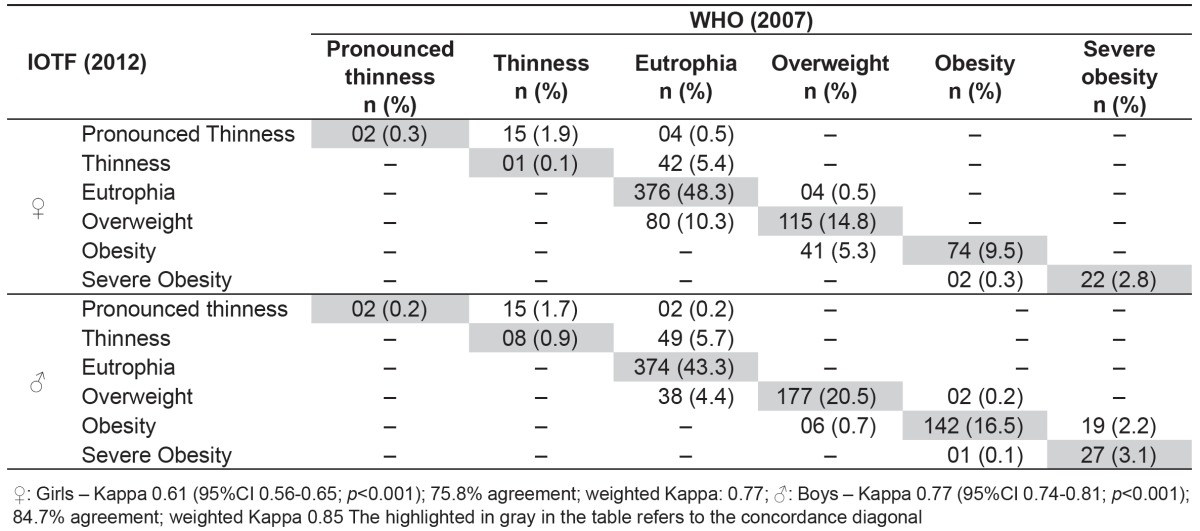
Figure 1. Analysis of agreement between the classification of nutritional status by age and sex.
Table 2. Difference and agreement for the classification of overweight separated by sex.

Figure 2. Analysis of agreement between the classification of excess weight by age and sex.
Discussion
As a differential feature of this study, we can mention the analysis of the degree of agreement of the group when classified in all categories of nutritional status. We began the analysis of the results by investigating the concordance whenall classifications in general were applied (from pronounced thinness to severe obesity) and there was higher agreement for boys in relation to girls. This result is contrary to findings in the literature( 15 , 16 ), which show higher agreement results (Kappa) for girls. However, Kappa values were similar to those found in this study, between 0.71 and 0.96.
In the study by Dumith and Farias Júnior( 15 ), when participants were divided by age, values for agreement were higher in ages from 13 to 15 years and for girls. Moreover, the lowest Kappa coefficients were observed in younger groups, from 7 to 9 years, in boys( 15 ). However, in the present study, we observed different results, as evidenced by the higher Kappa coefficient for boys. Furthermore, ages between 7-10 years for boys showed the highest values for the Kappa coefficient.
When classified only in normal weight and overweight, the Kappa coefficient underwent changes. We observed a higher value than the results presented for the studied population divided into six categories of body mass (Table 1). However, the values of the Kappa coefficient remained higher for boys (0.91; 95%CI 0.88-0.94) in comparison to the girls (0.77; 95%CI 0.77-0.81). It is also observed that the prevalence of excess weight both for boys and girls was different comparing the WHO and the IOTF (p<0.001; McNemar test).
The results of comparing the proportions between different overweight criteria were shown in several studies. In the study by Monasta et al( 17 ), the prevalence of overweight and obesity was higher when using the IOTF cut-off points (15.3 and 3.1%) compared to those by the WHO (3.4 and 1.5%). Interestingly, the opposite was observed in the study of Dumith and Farias Junior( 15 ) with school children; in the study by Twells and Newhook( 18 ) with preschoolers, the prevalence of both overweight and obesity was higher when using the WHO cut-offs in comparison to those of the IOTF. Moreover, in the study by Clemente et al( 16 ), the classification of the excess weight alone, according to the proposed by the WHO, also showed higher prevalence of overweight compared to the IOTF( 16 ).
It is known that the likelihood of cardiovascular and metabolic disorders is higher in overweight individuals. Zimmermann et al( 19 ) sought to verify the validity and accuracy of cut-offs used by the Centers for Disease Control and Prevention (CDC) and the IOTF to detect overweight and obesity in comparison to the fat percentage. The IOTF cut-off points presented lower performance for predicting obesity between 40 and 50%. However, this study used the IOTF cut-offs from 2000. Another study examined the association of cardiometabolic risk with overweight and obesity, classified according to the WHO and the CDC. The results suggested that the WHO cut-offs do not add advantages to detect associations between cardiometabolic risk and overweight/obesity in children and adolescents( 20 ).
The result of this study should be analyzed considering some limitations. The main one relates to the possibility of generalizing only the results of prevalence, which was restricted due to the insertion of projects with different objectives and methodologies for the selection of participants. However, the sample size, the heterogeneity of the group regarding age, and the use of new cut-offs strengthen the study. Moreover, an important result is related to the investigation of the agreement when the subjects were classified in all categories of nutritional status. Confronting this result with the degree of agreement when subjects were classified only as excess weight or not, the first category had lower values, demonstrating the importance of considering several classifications of nutritional status. This fact was also confirmed by applying the weighted Kappa coefficient, which presented the correlation taking into account the distance of the ratings. The results indicated that the discrepancies observed between the criteria differ for similar ratings, since the weighted Kappa was higher than Cohen's Kappa for both sexes.
This evidence becomes important due to the results recently presented by Farrant et al( 21 ) and Marcus et al( 22 ), who compared moderate and severe obesity to metabolic and psychological risk factors, and indicated that interventions should be prioritized for severe obesity. In the present study, we compared the results of the WHO and the IOTF, and obtained a higher prevalence of severe obesity in girls using the IOTF (3.1%) compared to the WHO (2.8%); for boys, there was greater prevalence with the use of WHO (5.3%) versus IOTF (3.4%). We suggest further investigations to assess the validity and accuracy of the classification of the IOTF and the WHO cut-offs for BMI regarding the detection of extreme situations such as severe obesity, including other variables related to health risks.
We concluded that the correlation between the classification of nutritional status by the WHO and the IOTF was characterized as substantial, but this result was modified according to age and sex. The result does not indicate which is the best criterion to be adopted in the face of discrepancies. Therefore, it is suggested that investigations using classifications with a larger number of categories of nutritional status consider the application of both criteria.
Footnotes
Instituição: Universidade Estadual de Londrina (UEL), Universidade Estadual do Centro Oeste (UNICENTRO) e Universidade Estadual de Maringá (UEM), Maringá, PR, Brasil
References
- 1.Tassitano RM, Tenório MC, Hallal PC. Systematic review on obesity in Brazilian adolescents. Rev Bras Cineantropom Desempenho Hum. 2009;11:449–456. [Google Scholar]
- 2.Bianchini JA, da Silva DF, Nardo CC, Carolino ID, Hernandes F, Nardo N., Jr Multidisciplinary therapy reduces risk factors for metabolic syndrome in obese adolescents. Eur J Pediatr. 2013;172:215–221. doi: 10.1007/s00431-012-1865-7. [DOI] [PubMed] [Google Scholar]
- 3.Guimarães AC, Feijó I, Soares A, Fernandes S, Machado Z, Parcias SR. Overweight and obesity in school children: association between biopsychological, socioeconomic and behavioral factors. Arq Bras Endocrinol Metab. 2012;56:142–148. doi: 10.1590/s0004-27302012000200008. [DOI] [PubMed] [Google Scholar]
- 4.Ricardo GD, Caldeira GV, Corso AC. Prevalence of overweight and obesity and central adiposity indexes among school-aged children in Santa Catarina, Brazil. Rev Bras Epidemiol. 2009;12:424–435. [Google Scholar]
- 5.Rech RR, Halpern R, Costanzi CB, Bergmann ML, Alli LR, Mattos AP, et al. Prevalence of obesity and overweight in schoolchildren aged 7 to 12 years from a city in southern Brazil. Rev Bras Cineantropom Desempenho Hum. 2010;12:90–97. [Google Scholar]
- 6.Flegal KM, Carroll MD, Ogden CL, Curtin LR. Prevalence and trends in obesity among US adults, 1999-2008. JAMA. 2010;303:235–241. doi: 10.1001/jama.2009.2014. [DOI] [PubMed] [Google Scholar]
- 7.Nobre MR, Domingues RZ, Silva AR, Colugnati FA, Taddei JA. Prevalências de sobrepeso, obesidade e hábitos de vida associados ao risco cardiovascular em alunos do ensino fundamental. Rev Assoc Med Bras. 2006;52:118–124. doi: 10.1590/s0104-42302006000200023. [DOI] [PubMed] [Google Scholar]
- 8.Lobstein T, Baur L, Uauy R. Obesity in children and young people: a crisis in public health. Obesity Reviews. 2004;5(1):4–85. doi: 10.1111/j.1467-789X.2004.00133.x. [DOI] [PubMed] [Google Scholar]
- 9.Dandona P, Aljada A, Chaudhuri A, Mohanty P, Garg R. Metabolic syndrome: a comprehensive perspective based on interactions between obesity, diabetes, and inflammation. Circulation. 2005;111:1448–1454. doi: 10.1161/01.CIR.0000158483.13093.9D. [DOI] [PubMed] [Google Scholar]
- 10.Rank M, Siegrist M, Wilks DC, Langhof H, Wolfarth B, Haller B, et al. The cardiometabolic risk of moderate and severe obesity in children and adolescents. J Pediatr. 2013;163:137–142. doi: 10.1016/j.jpeds.2013.01.020. [DOI] [PubMed] [Google Scholar]
- 11.De Onis M, Onyango AW, Borghi E, Siyam A, Nishida C, Siekmann J. Development of a WHO growth reference for school-aged children and adolescents. Bull World Health Organ. 2007;85:660–667. doi: 10.2471/BLT.07.043497. [DOI] [PMC free article] [PubMed] [Google Scholar]
- 12.Cole TJ, Lobstein T. Extended international (IOTF) body mass index cut-offs for thinness, overweight and obesity. Pediatr Obes. 2012;7:284–294. doi: 10.1111/j.2047-6310.2012.00064.x. [DOI] [PubMed] [Google Scholar]
- 13.Gordon CC, Chumlea WC, Roche AF. Stature, recumbent length, and weight. In: Lohman TG, Roche AF, Martorell R, editors. Anthropometric standardization reference manual. Champaign: Human Kinetics; 1991. pp. 39–54. [Google Scholar]
- 14.Landis JR, Koch GG. The measurement of observer agreement for categorical data. Biometrics. 1977;33:159–174. [PubMed] [Google Scholar]
- 15.Dumith SC, Farias JC., Júnior Sobrepeso e obesidade em crianças e adolescentes: comparação de três critérios de classificação baseados no índice de massa corporal. Rev Panam Salud Publica. 2010;28:30–35. doi: 10.1590/s1020-49892010000700005. [DOI] [PubMed] [Google Scholar]
- 16.Clemente AP, Santos CD, Benedito-Silva AA, Sawaya AL. Body mass index of adolescents: comparison among different references. Rev Paul Pediatr. 2011;29:171–177. [Google Scholar]
- 17.Monasta L, Lobstein T, Cole TJ, Vignerová J, Cattaneo A. Defining overweight and obesity in pre-school children: IOTF reference or WHO standard? Obes Rev. 2011;12:295–300. doi: 10.1111/j.1467-789X.2010.00748.x. [DOI] [PubMed] [Google Scholar]
- 18.Twells LK, Newhook LA. Obesity prevalence estimates in a Canadian regional population of preschool children using variant growth references. BMC Pediatr. 2011;11:21–21. doi: 10.1186/1471-2431-11-21. [DOI] [PMC free article] [PubMed] [Google Scholar]
- 19.Zimmermann MB, Gübeli C, Püntener C, Molinari L. Detection of overweight and obesity in a national sample of 6-12-y-old Swiss children: accuracy and validity of reference values for body mass index from the US Centers for Disease Control an Prevention and the International Obesity Task Force. Am J Clin Nutr. 2004;79:838–843. doi: 10.1093/ajcn/79.5.838. [DOI] [PubMed] [Google Scholar]
- 20.Kakinami L, Henderson M, Delvin EE, Levy E, O'Loughlin J, Lambert M, et al. Association between different growth curve definitions of overweight and obesity and cardiometabolic risk in children. CMAJ. 2012;184:E539–E550. doi: 10.1503/cmaj.110797. [DOI] [PMC free article] [PubMed] [Google Scholar]
- 21.Farrant B, Utter J, Ameratunga S, Clark T, Fleming T, Denny S. Prevalence of severe obesity among New Zealand adolescents and associations with health risk behaviors and emotional well-being. J Pediatr. 2013;163:143–149. doi: 10.1016/j.jpeds.2012.12.043. [DOI] [PubMed] [Google Scholar]
- 22.Marcus MD, Baranowski T, DeBar LL, Edelstein S, Kaufman FR, Schneider M, et al. Severe obesity and selected risk factors in a sixth grade multiracial cohort: the HEALTHY study. J Adolesc Health. 2010;47:604–607. doi: 10.1016/j.jadohealth.2010.04.017. [DOI] [PMC free article] [PubMed] [Google Scholar]


