Abstract
OBJECTIVE:
To identify the spatial pattern of low birth weight infants in the city of Taubaté, São Paulo, Southeast Brazil.
METHODS:
Ecological and exploratory study, developed with the data acquired from the Health Department of Taubaté, regarding the period from January 1st 2006 and December 31st 2010. Birth certificates were used to obtain the data from infants weighing less than 2500g. A digital basis of census tracts was applied and the Global Moran index (IM) was estimated. Thematic maps were built for the distribution of low birth weight, health centers and tracts, according to the priority care (Moran map). The adopted statistical significance was α=5% and TerraView software conducted the spatial analysis.
RESULTS:
There were 18,915 live births during the study period, with 1,817 low birth weight infants (9.6%). The low birth weight infants' prevalence during the period ranged from 9.3 to 9.8%. A total of 1,185 infants with known addresses, compatible with the digital base (65.2% of low birth weight infants), were included. The IM for low birth weight was 0.12, with p<0.01; regarding the health centers distribution, IM was -0.07, with p=0.01. The Moran map identified 11 census tracts with high priority for intervention by health managers, located in the outskirts of the city.
CONCLUSIONS:
The spatial analysis identified the low birth weight distribution by census tracts and the sectors with a high priority for intervention.
Keywords: infant, low birth weight; primary health care; geographic information systems
Abstract
OBJETIVO:
Identificar el estándar de distribución espacial de recién nacidos (RN) con bajo peso en el municipio de Taubaté, São Paulo.
MÉTODOS:
Estudio epidemiológico de tipo ecológico y exploratorio, con datos de la Secretaría Municipal de Salud de Taubaté, relativos al periodo de 1 de enero de 2006 a 31 de diciembre de 2010. Se utilizó la declaración de nacidos vivos, para obtención de los datos de nacimientos con peso inferior a 2.500g, y una base digital de sectores censitarios para el análisis. Se calculó el Índice de Moran Global (IM), construyéndose mapas temáticos para la distribución de los RN con bajo peso, de los puestos de salud y de los sectores, conforme a la prioridad de atención (Mapa de Moran). La significancia estadística adoptada fue α=5%. Se efectuó el análisis espacial por el programa TerraView.
RESULTADOS:
Se verificaron 18.915 nacidos vivos en el periodo de estudio y 1.817 presentaban bajo peso (9,6%). La prevalencia de bajo peso al nacer en el periodo varió de 9,3 a 9,8%. Se incluyeron 1.185 RN que tenían direcciones conocidas y compatibles con la base digital (65,2% del total con bajo peso). El IM para neonatos con bajo peso fue de 0,12, con p<0,01; para la distribución de los puestos de salud, se obtuvo IM=-0,07, con p<0,01. El Mapa de Moran identificó 11 sectores censitarios que deben ser objeto de intervención por el gestor de salud, que se ubican en las afueras de la ciudad.
CONCLUSIONES:
El análisis espacial identificó la distribución de los RN con bajo peso por sectores censitarios y los sectores con alta prioridad de intervención.
Introduction
Low birth weight refers to the neonate weighing less than 2,500g( 1 ), due to a shorter pregnancy, intrauterine growth retardation, or association of these two conditions( 2 ). Other factors such as smoking, low maternal education, younger maternal age, marital status, slight weight gain during pregnancy, hypertension, and genitourinary tract infection in pregnancy, parity, and fewer prenatal consultations may also be associated with low birth weight. Likewise, socioeconomic variables, such as family income lower than minimum wages, education up to 8 years, demographic and reproductive variables, such as maternal age <19 years, other children with low weight and history of miscarriage and gestational variables, such as hypertension, bleeding, and weight gain up to 10kg, have been reported as associated with low birth weight( 3 , 4 ). Finally, environmental factors, such as maternal exposure to air pollutants, are also associated with this condition( 5 ). Low birth weight is probably one of the leading causes, alone, of infant mortality( 6 ). In 2010, its prevalence was of 8.3%, and, in the state of São Paulo, of 9.1%( 7 ).
The disease mapping, using geoprocessing, is a basic tool in the field of Public Health and recently yielded many advances in analytical techniques, to product maps whose construction should be free from "random noise" or artifacts related to the length of geographical areas and the population of the focused regions( 8 ). When a special pattern is visualized, it is important to translate it into objective considerations: is the observed pattern random or does it have a defined aggregation? May this distribution be associated to measurable causes? Are there groups of areas with different patterns within the study area? The spatial study of prematurity in the urban space aims to identify geographical areas with high rates of specific illness, in this case, of preterm births. Occasionally, this approach may also identify factors associated with the issue in question.
Morais Neto et al( 9 ), in the municipality of Goiânia, state of Goiás, used spatial analysis to assess areas of risk for neonatal death, emphasizing the importance of this study for possible interventions in healthcare. Nascimento et al( 10 ), in a study on the same topic conducted in the Paraíba Valley, indicated the presence of spatial clusters and pointed to the need for municipal interventions. Paulucci et al( 11 ) identified high-priority areas of intervention, to minimize the occurrence of premature births in the municipality of Taubaté, state of São Paulo, using spatial analysis.
In this context, the aim of this study was to identify the spatial distribution of low birth weight in the municipality of Taubaté, correlating it with the distribution of health care centers.
Method
This was an epidemiological, ecological, and exploratory study, with data obtained at the Municipal Health Secretariat of Taubaté, regarding the period of January 1st, 2006 to December 31st, 2010. Taubaté has a population of about 270 thousand inhabitants, located on the banks of the Dutra Highway (Rodovia Presidente Dutra), in the Paraíba Paulista Valley (Vale do Paraíba Paulista), 120km from the municipality of São Paulo.
The Statement of Live Birth (SLB) was used for the analysis, separating only the cases of live births weighing less than 2,500g. The SLB comprises address data (street, number, neighborhood, and ZIP code) inserted in the table analyzed by the TerraView program (available at http://www.dpi.inpe.br/download). Twin newborns (NB), or those with birth weight lower than 500g were excluded from the study.
The TerraView software uses a digital base of census tracts and enables spatial analysis, providing the Global Moran's Index (MI), which estimates the spatial correlation between the polygons. In the present case, these polygons are represented by census tracts. The MI can vary from -1 to +1 e and the computer program used also provides the statistical significance of this index (p-value). Thus, possible clusters of the occurrence of low weight births may be evidenced, according to the census tracts.
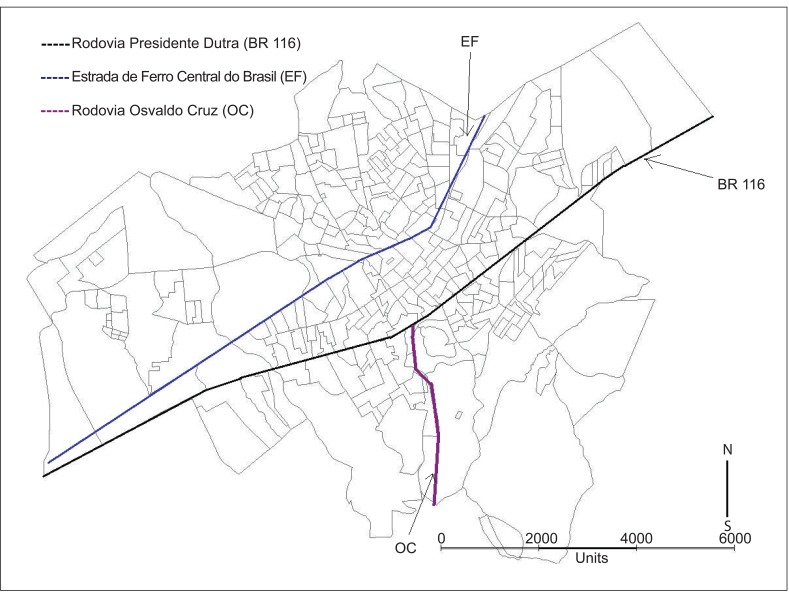
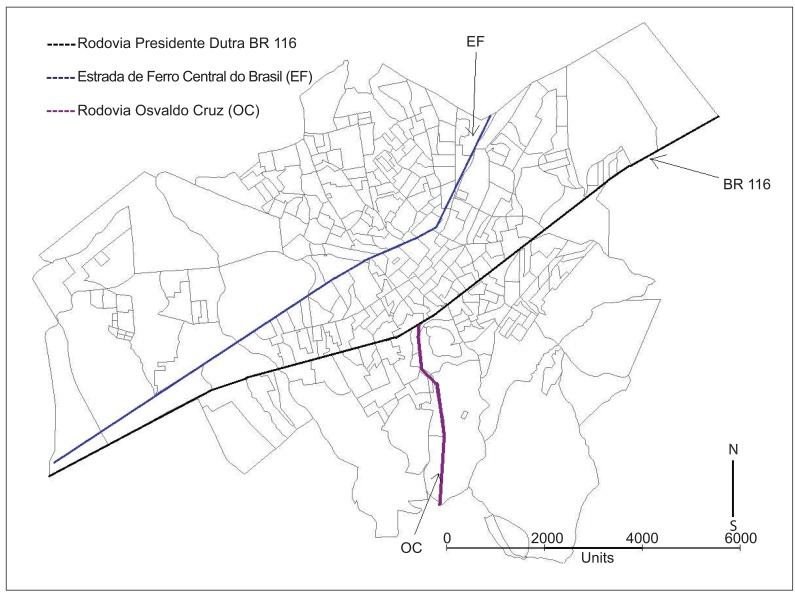
The size of the census tract varies inversely with population density, containing approximately 300 households. The digital map of Taubaté was obtained, with census tracts, at the website of the Brazilian Institute of Geography and Statistics (Instituto Brasileiro de Geografia e Estatística - IBGE) (http://www.ibge.gov.br/home/mapa_site/mapa_site.php#download). Figure 1 shows the census tracts of the municipality, the locations of the railroad (Estrada de Ferro), Presidente Dutra Highway, and Osvaldo Cruz Highway (Rodovia Osvaldo Cruz). The following maps were built: thematic maps (coropletes) regarding the occurrence of low weight newborns, the Map of Moran, which identifies censor tracts that should be object of intervention, and the Kernel Map, which identifies regions with the highest densities of low weight newborns. The thematic map was built with four ranges of values, according to the distribution of low weight newborns in the tracts. The level of significance was established at 5%.
Figure 1. Map of the muncipality of Taubaté with its 313 census tracts and highways.
Results
There were 18,915 live births in the study period, of which 1,817 were underweight (9.6%). The prevalence of this condition in the period ranged from 9.3 to 9.8%. It included data on 1,185 infants who had known addresses compatible with the digital base (65.2% of total underweight).
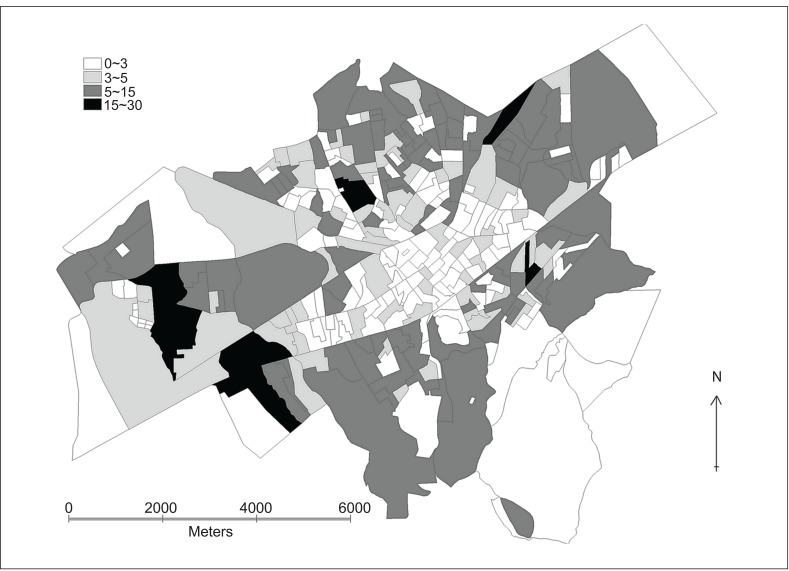
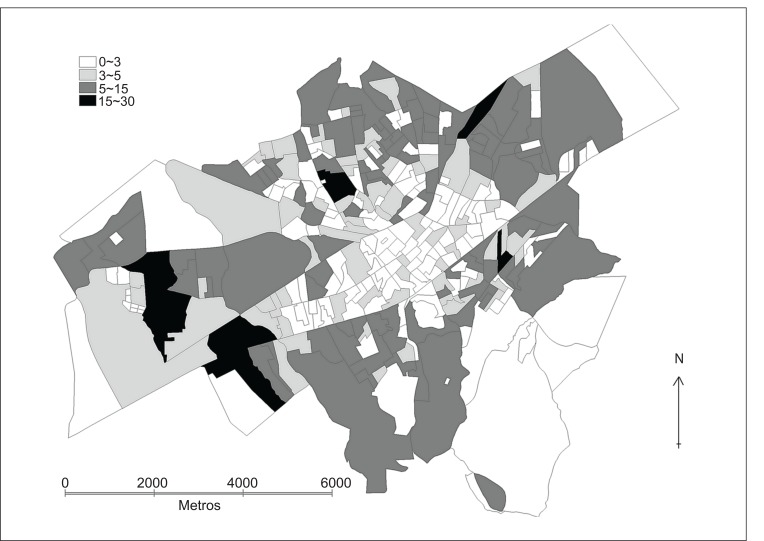
The IM for newborns with low birth weight was 0.12, with p<0.01, which reveals a significant positive correlation, i.e., there are census tracts forming clusters, with the occurrence of low-weight newborns (Figure 2). The number of cases per census tract ranged from zero to 30.
Figure 2. Distribution of occurrence of newborns with low birth weight, in absolute numbers, according to census tracts, Taubaté, state of São Paulo, Brazil, 2006-2010.
There was a higher cluster in the east and west of the municipality (São Paulo in the direction of Rio de Janeiro, along the Dutra Highway) and further clusters of census tracts south of the Dutra Highway. The corridor bounded by the railway line and the Dutra Highway concentrated the tracts with the lowest number of cases (Figure 2).
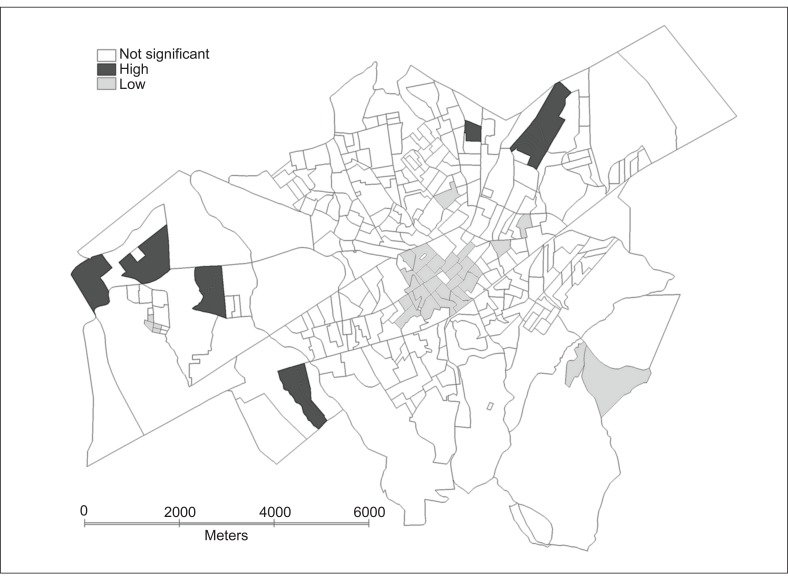
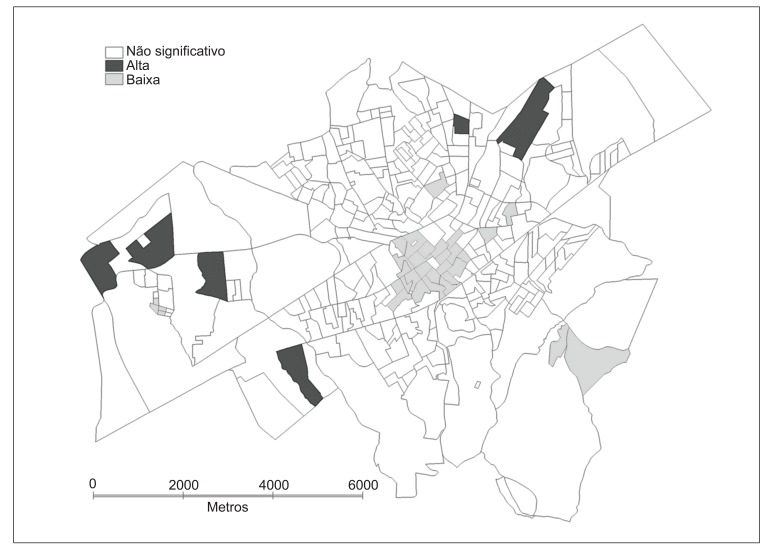
The Moran Map showed 11 census tracts that should be object of intervention by the secretary of health, located on the outskirts. On the other hand, tracts with low priority of intervention were located in the central region and are located between the Dutra Highway and the railroad (Figure 3).
Figure 3. Map of Moran identifying census tracts with high and low priority of intervention and those which are not significant Taubaté, state of São Paulo, Brazil, 2006-2010.
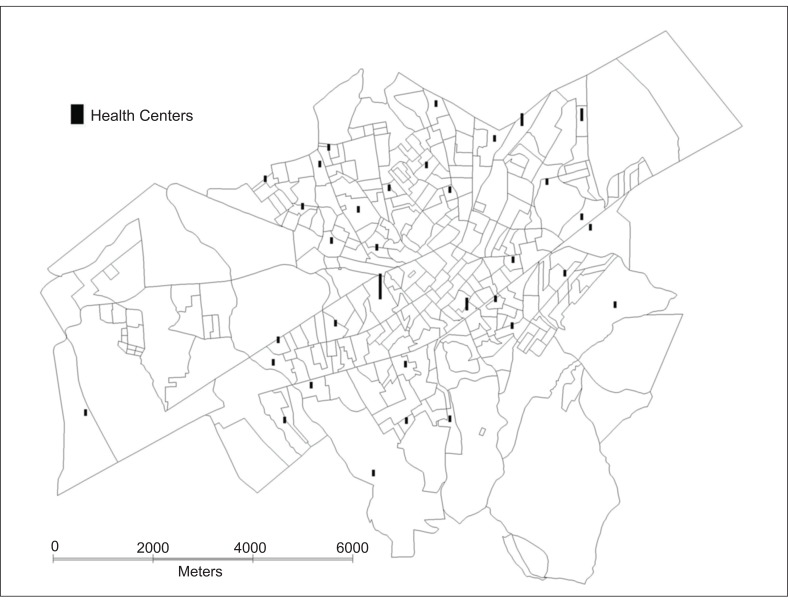
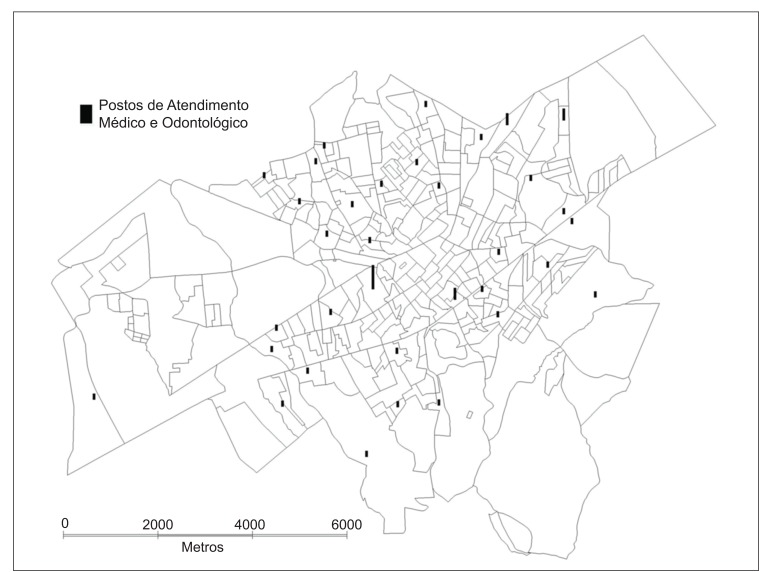
The addresses of 40 Health Centers (HC) were included in the study. Their distribution through the city favors tracts that are away from the central region. The MI for this distribution was of -0.07 (p=0.01), suggesting that there are tracts with HCs surrounded by others without these centers (Figure 4).
Figure 4. Distribution of Health Centers in the census tracts of Taubaté, state of São Paulo, Brazil, 2006-2001.
Discussion
The prevalence of low birth weight was close to the values for the state of São Paulo, ranging from 9.3 to 9.8%( 7 ). This study identified areas with high incidence of low birth weight, which are located, most often, on the outskirts of the municipality. The occurrence of low birth weight has a radial distribution, increasing from the central region to the outskirts, and presents significant positive spatial correlation, as indicated by the value of MI. The tracts involved by the railroad and the Dutra Highway, located in the central region, are those with the lowest numbers for low weight (up to five). In this study, it was considered that the composition of census tracts was homogeneous, with no differences between central and peripheral tracts, for analysis purposes.
The highest incidence of low birth weight on the most peripheral areas can relate to the fact that these tracts possibly house people with lower income. Since low birth weight is associated to families with monthly income lower than three minimum wages(4) and low maternal education, which may be a marker of socioeconomic status( 12 ), this distribution can be understood. In this line, the most central tracts, which are probably housing people with higher education and, consequently, with the best conditions, had a lower incidence of this outcome.
As it was assumed that the composition of the tracts was homogeneous, i.e., the age groups were similar in all tracts, whether they were located centrally or peripherally, the proportion of adolescents would be similar. Thus, births from teenage mothers should occur with this distribution, both in the central region and in the areas distant from the center. There is still no consensus on the association between low birth weight and adolescent motherhood( 13 - 15 ).
Would the cases of low birth weight decrease if there were adequate care for these mothers in prenatal care? It is known that the ideal number of pre-natal visits recommended by the Ministry of Health (more than seven) is associated with a decrease in the number of low weight births( 16 - 18 ), but there is disagreement as to the protection conferred( 19 ). What seems clear is not the quantity, but the quality of the visits. Another important fact is the late onset of prenatal care, which may compromise the outcome of pregnancy. On the other hand, a greater number of pre-natal visits may arise from situations of risk to the mother or the newborn. A smaller number of visits can also be associated to the difficulty of access to health services.
The Health Centers (HC) are distributed in larger quantity in the outskirts than in the center of town. This distribution is significant and spatially autocorrelated, with tracts containing HCs surrounded by tracts without them, hence the negative value of MI. It is noteworthy that there are still tracts with more than one health center.
It is interesting to compare the maps of the distributions of low weight events and the distribution of HCs. There are tracts with a high number of low-weight newborns, but containing HCs, and two tracts, which presented 15-30 NBs in this condition, had at least one HC. We should consider the type of care provided to pregnant women, because it is possible that there is no prenatal care program or that there is a lack of professionals to care for these mothers at these centers, a fact that must be corrected.
Regarding the analysis of the Moran Map, 11 tracts were identified where interventions are prioritized. These tracts have their own dynamics and, by decreasing the occurrences of low-weight newborns in these places, there will be a drop in adjacent tracts. These tracts are located in regions that are more distant from the city center. On the other hand, the Moran map identified tracts where interventions have low priority. These tracts are located, preferably, in the central region.
The 11 high-priority tracts, both located in the northeast and in the southeast region of the municipality, have medical care provided by an obstetrician and gynecologist. On the other hand, they are tracts with a low level of social and economic development, besides being having reports of drug trafficking and prostitution.
The strength of this study lies in its extent of duration (5 years), which reduces the chances of data fluctuation - such as, for example, the large occurrence in a given sector, in a given year. Over time, if this number is not repeated, its importance fades. Another strength of the study is the possibility of assisting the local government to intervene in a few tracts and not in the whole city, which will reduce costs and bring faster results.
Among the possible limitations of the study, the difficulty of locating all addresses may be mentioned. This was probably due to an outdated digital basis, with the emergency of new census tracts which were not included, and addresses without identification by name, such as, "A Street" or "Projected Street", as found in some tracts. However, it is expected that these information losses did not influence the results.
We may conclude that the study identified the spatial distribution of low-weight newborns, located especially in peripheral tracts, and to point tracts that should be subject of intervention by the city manager.
Funding Statement
Fonte financiadora: Fundação de Amparo à Pesquisa do Estado de São Paulo (Fapesp), processo 2010/19956-9
Footnotes
Instituição: Universidade de Taubaté (Unitau), Taubaté, SP, Brasil
Fonte financiadora: Fundação de Amparo à Pesquisa do Estado de São Paulo (Fapesp), processo 2010/19956-9
References
- 1.Organização Mundial da Saúde . CID-10: classificação estatística internacional de doenças e problemas relacionados à saúde. 10th ed. São Paulo: Edusp; 1998. [Google Scholar]
- 2.Kramer MS. Determinants of low birth weight: methodological assessment and meta-analysis. Bull World Health Organ. 1987;65:663–737. [PMC free article] [PubMed] [Google Scholar]
- 3.McDermott S, Cokert AL, McKeown RE. Low birthweight and risk of mild mental retardation by ages 5 and 9 to 11. Paediatr Perinat Epidemiol. 1993;7:195–204. doi: 10.1111/j.1365-3016.1993.tb00393.x. [DOI] [PubMed] [Google Scholar]
- 4.Nascimento LF. Hierarchical analysis of risk factors regarding low birthweight. Rev Paul Pediatr. 2005;23:76–82. [Google Scholar]
- 5.Nascimento LF, Moreira DA. Are environmental pollutants risk factors for low birth weight. Cad Saude Publica. 2009;25:1791–1796. doi: 10.1590/s0102-311x2009000800015. [DOI] [PubMed] [Google Scholar]
- 6.McCormick MC. The contribution of low birth weight to infant mortality and childhood morbity. N Eng J Med. 1985;312:82–90. doi: 10.1056/NEJM198501103120204. [DOI] [PubMed] [Google Scholar]
- 7.Brasil - Ministério da Saúde - DATASUS [cited 2013 Feb 06];[homepage on the Internet]. Nascidos vivos - Brasil. 2013 a Available from: Available from: http://tabnet.datasus.gov.br/cgi/tabcgi.exe?sinasc/cnv/nvuf.def.
- 8.Andrade CL, Szwarcwald CL. Spatial analysis of early neonatal mortality in the municipality of Rio de Janeiro, 1995-1996. Cad Saude Publica. 2001;17:1199–1210. doi: 10.1590/s0102-311x2001000500020. [DOI] [PubMed] [Google Scholar]
- 9.Morais OL, Neto, Barros MB, Martelli CM, Silva SA, Cavenaghi SM, Siqueira JB., Jr Differential patterns of neonatal and post-neonatal mortality rates in Goiânia, Brazil, 1992-1996: use of spatial analysis to identify high-risk areas. Cad Saude Publica. 2001;17:1241–1250. [PubMed] [Google Scholar]
- 10.Nascimento LF, Batista GT, Dias NW, Catelani CS, Becker D, Rodrigues L. Spatial analysis of neonatal mortality in Paraíba Valley, Southeastern Brazil, 1999 to 2001. Rev Saude Publica. 2007;41:94–100. doi: 10.1590/s0034-89102007000100013. [DOI] [PubMed] [Google Scholar]
- 11.Paulucci RS, Nascimento LF, Schulze CA. Spatial analysis of premature delivery in Taubaté, SP, Brazil. Rev Paul Pediatr. 2011;29:336–340. [Google Scholar]
- 12.Haidar FH, Oliveira UF, Nascimento LF. Maternal educational level: correlation with obstetric indicators. Cad Saude Publica. 2001;17:1025–1029. doi: 10.1590/s0102-311x2001000400037. [DOI] [PubMed] [Google Scholar]
- 13.Perez MI, Neto, Segre CA. Comparative analysis of gestations and frequency of prematurity and low birth weight among children of adolescent and adult mothers. Einstein (Sao Paulo) 2012;10:271–277. [PubMed] [Google Scholar]
- 14.Neves AC, Filho, Leite AJ, Bruno ZV, Filho JG, Silva CF. Pregnancy in teenagers and low birthweight infant: is there an association? Rev Paul Pediatr. 2011;29:489–494. [Google Scholar]
- 15.Nascimento LF. Cross-sectional study of factors associated to low birthweight according to records obtained in vaccination service. Rev Bras Saude Mater Infant. 2003;3:37–42. [Google Scholar]
- 16.Carniel EF, Zanolli ML, Antônio MA, Morcillo AM. Determinants for low birth weight according to Live Born Certificates. Rev Bras Epidemiol. 2008;11:169–179. [Google Scholar]
- 17.Leal MC, Gama SG, Ratto KM, Cunha CB. Use of the modified Kotelchuck index in the evaluation of prenatal care and its relationship to maternal characteristics and birth weight in Rio de Janeiro, Brazil. Cad Saude Publica. 2004;20( 1):S63–S72. doi: 10.1590/s0102-311x2004000700007. [DOI] [PubMed] [Google Scholar]
- 18.Nascimento LF, Gotlieb SL. Risk factors for low birth weight, based on information from Live Birth Certificates, in Guaratinguetá, SP, 1998. Inf Epidemiol Sus. 2001;10:113–120. [Google Scholar]
- 19.Silveira DS, Santos IS. Adequacy of prenatal care and birthweight: a sytematic review. Cad Saude Publica. 2004;20:1160–1168. doi: 10.1590/s0102-311x2004000500009. [DOI] [PubMed] [Google Scholar]


