

Abstract
Microarray analyses were performed on livers from adrenalectomized male Wistar rats chronically infused with methylprednisolone (MPL) (0.3 mg/kg·h) using Alzet mini-osmotic pumps for periods ranging from 6 h to 7 d. Four control and 40 drug-treated animals were killed at 10 different times during drug infusion. Total RNA preparations from the livers of these animals were hybridized to 44 individual Affymetrix REA230A gene chips, generating data for 15,967 different probe sets for each chip. A series of three filters were applied sequentially. These filters were designed to eliminate probe sets that were not expressed in the tissue, were not regulated by the drug, or did not meet defined quality control standards. These filters eliminated 13,978 probe sets (87.5%) leaving a remainder of 1989 probe sets for further consideration. We previously described a similar dataset obtained from animals after administration of a single dose of MPL (50 mg/kg given iv). That study involved 16 time points over a 72-h period. A similar filtering schema applied to the single-bolus-dose data-set identified 1519 probe sets as being regulated by MPL. A comparison of datasets from the two different dosing regimens identified 358 genes that were regulated by MPL in response to both dosing regimens. Regulated genes were grouped into 13 categories, mainly on gene product function. The temporal profiles of these common genes were subjected to detailed scrutiny. Examination of temporal profiles demonstrates that current perspectives on the mechanism of glucocorticoid action cannot entirely explain the temporal profiles of these regulated genes.
Glucocorticoids are a class of steroid hormones that play a central role in regulating the production, storage, and distribution of substrates for systemic energy metabolism. Most tissues are targets for glucocorticoid action and contribute in some way to their wide-ranging physiological effects. Synthetic glucocorticoids (corticosteroids) are used therapeutically for a wide variety of conditions that require immune and/or inflammatory modulation. Because corticosteroids pharmacologically magnify the physiological actions of endogenous glucocorticoids, therapeutic use of this class of drugs is accompanied by a wide range of adverse effects that include hyperglycemia, dyslipidemia, muscle wasting, hypertension, nephropathy, fatty liver, and an increased risk of arteriosclerosis (1–5). The physiological and pharmacological effects of these drugs are complex and involve changes in the expression of many genes in multiple tissues.
Microarrays can provide a method of high-throughput data collection that is necessary for constructing comprehensive information on the transcriptional basis of such complex systemic polygenic phenomena. When microarrays are used in a rich in vivo time series, they yield temporal patterns of changes in gene expression that illustrate the cascade of molecular events that cause broad systemic responses. However, the magnitude of data produced in such studies provides challenges of data mining and analysis.
Previously, we described the mining and analysis of microarray time series illustrating the responses of liver, skeletal muscle, and kidney taken from the same set of animals to a single bolus dose of the corticosteroid methylprednisolone (MPL) (6 – 8). These time series included individual chips from multiple control animals as well as multiple animals at each of 16 times over a 72-h period after bolus dosing with MPL. Because these experiments were initiated using adrenalectomized animals, the drug in essence acts as a stimulus that perturbs the homeostatic balance of the system, and the experiment monitored the deviation of the system and its return to the original state. Mining such time series datasets presents uniquely different problems from those encountered when microarrays are used to distinguish one group from another (e.g. cancerous vs. noncancerous tissues) (9 –11). For this type of application, one attempts to define a pattern or fingerprint that distinguishes such groups with very high probability, and need not include all differentially regulated genes. In those cases, it is identifying a distinguishing pattern of gene expression rather than the relationship between the genes that is the important focus. In mining a time series microarray dataset, the problem is sorting through the vast amount of data to identify probe sets with temporal patterns of change in expression that indicate that the gene is regulated over time. In this case, the mechanistic relationships between the genes whose expression is changing in response to the stimulus are of paramount importance. For example, the stimulus may change the expression of a particular transcription factor that in turn alters the expression of downstream genes. For this application, the goal of the initial data mining is to avoid discarding valuable data. This is of particular importance because in our hands, each gene that is identified as being potentially regulated becomes the subject of extensive literature searches to allow placement into a temporal context of all other regulated genes.
Although very useful, a single time series only provides a one-dimensional view of the dynamics of the system in response to the stimulus. A pharmacological time series is different from most time series studies (for example those assessing developmental changes) in that it can be repeated using a different dosing regimen. A second dosing regimen is valuable in two regards. First, it can serve to corroborate results of the first dosing regimen. When considering gene array results, this can be useful. Second, the results can be used to group genes into clusters with common mechanisms of regulation. If two or more genes have a common mechanism of regulation, then their response profiles should be the same regardless of the dosing regimen. In the present report, we describe the use of microarrays to broadly characterize the response of liver to a second dosing regimen that entailed chronic infusion of MPL. Here the drug essentially was used as an unbalancing stimulus, and the experiment evaluated the capacity of the system to rebalance in the continuous presence of the drug. This dataset was mined using a similar filtration approach as was applied to the acute dosing dataset, and results from both datasets were compared. Probe sets common to both analyses were identified, allowing the coincidental evaluation of the two profiles for each gene.
Materials and Methods
Animals
Adrenalectomized male Wistar rats with body weights of 339 ± 28 (SD) g were used in the study. All animals were housed in our University Laboratory Animal Facility maintained under constant temperature (22 C) and humidity with a controlled 12-h light, 12-h dark cycle. A time period of at least 2 wk was allowed before they were prepared for surgery. Rats had free access to rat chow and 0.9% NaCl drinking water. This research adheres to Principles of Laboratory Animal Care (National Institutes of Health publication 85-23, revised 1985) and was approved by the Institutional Animal Care and Use Committee of the State University of New York at Buffalo.
Forty rats were administered 0.3 mg/kg·h infusions of MPL sodium succinate (Solu-Medrol; The Upjohn Co., Kalamazoo, MI) reconstituted in supplied diluent. The infusions were administered via Alzet osmotic pumps (model 2001, flow rate 1 μl/h; Alza, Palo Alto, CA). The pump drug solutions were prepared for each rat based on its predose body weight. On the day of implantation, rats were anesthetized using 60 – 80 mg/kg ketamine and 8 –10 mg/kg xylazine im. Pumps were sc implanted between the shoulder blades on the back. Rats were killed at various times up to 7 d. The time points included were 6, 10, 13, 18, 24, 36, 48, 72, 96, and 168 h. A control group of four animals was implanted with a saline-filled pump and killed at various times throughout the 7-d study period. A more detailed description of the experiment can be found in previous reports (12, 13).
Microarrays
Liver samples from each animal were ground into a fine powder in a mortar cooled by liquid nitrogen and 100 mg was added to 1 ml prechilled Trizol reagent (Invitrogen, Carlsbad CA). Total RNA extractions were carried out according to manufacturer’s directions and were further purified by passage through RNeasy mini-columns (QIAGEN, Valencia, CA) according to manufacturer’s protocols for RNA clean-up. Final RNA preparations were resuspended in RNase-free water and stored at −80 C. The RNAs were quantified spectrophotometrically, and purity and integrity were assessed by agarose gel electrophoresis. All samples exhibited 260/280 absorbance ratios of approximately 2.0, and all showed intact ribosomal 28S and 18S RNA bands in an approximate ratio of 2:1 as visualized by ethidium bromide staining. Isolated RNA from each liver sample was used to prepare target according to manufacturer’s protocols. The biotinylated cRNAs were hybridized to 44 individual Affymetrix GeneChips Rat Genome 230A (Affymetrix, Inc., Santa Clara, CA), which contained 15,967 probe sets. These gene chips contain over 7000 more probe sets than the ones used (U34A) in our previous liver bolus-dose MPL study (6 – 8). The high reproducibility of in situ synthesis of oligonucleotide chips allows accurate comparison of signals generated by samples hybridized to separate arrays.
Data analysis
Affymetrix Microarray Suite 5.0 (Affymetrix) was used for initial data acquisition and analysis. The signal intensities were normalized for each chip using a distribution of all genes around the 50th percentile. The dataset was then loaded into a data mining program, GeneSpring 7.0 (Silicon Genetics, Redwood City, CA), for further analysis. The generated dataset has been submitted to the National Center for Biotechnology Information (NCBI) Gene Expression Omnibus (GEO, http://www.ncbi.nlm.nih.gov/projects/geo/) database (GDS972). Before screening for probe sets with altered expression levels, the dataset was normalized again to the mean values of control samples so that all probe sets from control samples had a mean value of 1, and probe sets from treated animals had a value of either greater than, less than, or equal to 1, representing up-regulation, down-regulation, or no change. These normalized probe sets were then filtered with a series of predetermined screening criteria to identify probe sets with appreciable expression levels, expression changes, and acceptable data quality. This set of filters is approximately the same as used to analyze the acute bolus dosing datasets with minor modifications to accommodate the different number of samples in the two experiments (6 – 8).
The process of data mining was performed in the GeneSpring program, and the progress after each step was visualized using a cluster feature of the program. This cluster feature could rearrange the order of the probe sets and group them based on the similarity (Pearson’s correlation) of their expression dynamics. Then the probe sets that were not eliminated by the filter were displayed vertically as a gene tree, and their expression dynamics over time were displayed horizontally in colors with yellow in the graph representing an expression ratio around 1, or no change. The color progressing toward red indicates a normalized value greater than 1, or up-regulation, and the color toward blue indicates a value less than 1, or down-regulation from control levels. The brightness of the colors reflects the original signal intensities or expression levels before normalization. The more abundantly expressed mRNAs exhibit brighter colors. Figure 1 shows the gene tree of the entire dataset (15,967 probe sets). The x-axis represents the 11 time points including vehicle controls (nominally time 0). The y-axis represents the list of the probe sets in order of similarity. Figure 2 (top) shows a magnification of five probe sets on the tree with an apparent response of enhanced expression. It should be noted that two of these probe sets directly adjacent to each other, 1370200 and 1387878, are both for the enzyme glutamate dehydrogenase 1 (Glud1). This enzyme is involved in ammonia detoxification, which is necessary when amino acid carbon is used for gluconeogenesis (14). A significant deficit of the gene tree representation is that all time intervals are represented as equal, and therefore to some degree temporal patterns are misrepresented in the gene tree presentations. This is illustrated by comparing the top and bottom panels in Fig. 2. The bottom panel shows a linear plot of the data for the two probe sets for Glud1 presented in the top panel. As illustrated by this example, it is possible to visually identify genes under regulation using gene trees. However, this approach does not entail objective criteria for selection of probes for further consideration.
Fig. 1.

Gene tree representation of all probe sets (15,967) on individual Affymetrix R230A gene chips hybridized to total RNA prepared from livers taken from animals treated chronically with MPL (0.3 mg/kg·h) for periods ranging from 6 –168 h. The values for each individual probe set at each time point were normalized to the mean value of that probe set for time zero controls. The x-axis represents the 11 time points, including time zero controls. The y-axis presents the list of probe sets grouped by similarity using Pearson’s correlation. Yellow indicates no change from controls, red indicates probe sets with enhanced expression relative to controls, and blue indicates suppressed expression relative to controls.
Fig. 2.

The top panel provides a magnification of five probe sets selected from Fig. 1 that show apparent enhanced regulation by MPL. Two of these probe sets represent the same gene (Glud1). The linear plots for both Glud1 probe sets are presented in the lower panel.
To screen for the probe sets objectively, the entire dataset was filtered with criteria similar to the ones applied to the dataset from a bolus-dose MPL experiment (6 – 8). This approach does not select for probe sets but rather eliminates those probe sets that do not meet certain criteria, leaving the remainder for further consideration. The first filter was designed to eliminate probe sets for genes that are not expressed in the liver. This filter employed a function in the Affymetrix Microarray Suite 5.0. During initial data analysis, a call of present (P), absent (A), or marginal (M) for each probe set on each chip was determined based on the intensity comparison of the matched and mismatched probe sequence pairs. The first filter eliminated all probe set that did not have a call of P on at least four of the 44 chips. This filter eliminated 6668 probe sets, leaving a remainder of 9299 probe sets for further consideration. These genes are more likely to be expressed in rat liver than those that were eliminated.
The second level of filtering that we applied was designed to eliminate probe sets that could not meet the basic criterion of a regulated probe. Specifically, this filtering approach was designed to eliminate probe sets whose average did not deviate from baseline by a certain value for a reasonable number of time points and employed two filters that were designed to eliminate probe sets that were neither down- nor up-regulated. The first of these filters eliminated probe sets that could not meet a minimal criterion for down-regulation. Starting with the 4P filtered list, we eliminated all probe sets that did not have average values less than 0.65 in at least two conditions (time points). Those probe sets that were not eliminated by this filter were retained as potentially down-regulated probe sets. The next filter was designed to eliminate probe sets that could not meet a minimal criterion for up-regulation. Starting with the 4P filtered list, we eliminated all probe sets that did not have average values above 1.5 in at least two conditions (time points). Those probe sets that were not eliminated by this filter were retained as potentially up-regulated probe sets. However, there were a small number of probe sets that were not eliminated by either filter. Using a Venn diagram, we removed these from both lists and created a list of probe sets with potential complex regulation. Probe sets not eliminated by this filtering approach included 1581 potential down-regulated probe sets, 1212 potential up-regulated probe sets, and a group of 85 probe sets that met both criteria.
The last filter we applied addressed the quality of the data. For this quality control filter, we eliminated probe sets that did not meet two conditions. The first condition focused on the control chips. As indicated above, our initial operation was to divide the value of each individual probe set on each chip by the mean of the values for that probe set on the four control chips. Therefore, the quality of the control data for each particular probe set is of unique importance in defining regulation by the drug. This filter eliminated probe sets whose control values exhibited coefficients of variation of greater than 50%. The second condition focused on the remaining 10 time points. This filter also eliminated probe sets with coefficients of variation for more than five of the remaining 10 time points exceeded 50%. After the application of this filter, 1989 probe sets remained for consideration. Of the 1989, 1049 were in the up-regulated list, 922 were in the down-regulated list, and 18 were in the list that met both criteria. Figure 3 shows a gene tree of all 1989 remaining probe sets. The three lists are published as supplemental data on The Endocrine Society’s Journals Online web site at http://endo.endojournals.org.
Fig. 3.

Gene tree representation of probe sets remaining (1989) after filtering.
Results
Figure 4 (left) presents concentrations of MPL in plasma of animals receiving chronic glucocorticoid administration through Alzet pumps. The infusion dose (0.3 mg/kg·h) was chosen for dose equivalency at 168 h (the final time point in this study) with the single 50 mg/kg dose employed in our acute studies. By 6 h, MPL levels reach a stable steady state that is maintained throughout the 7-d infusion period. Preliminary experiments (data not shown) demonstrated that steady-state drug levels were attained by 6 h after pump implantation. Therefore, 6 h was chosen as the initial time point for these studies. In contrast, single bolus dose administration (right) results in drug levels that dissipate in a biexponential fashion and reach below the level of detection by 7 h after drug administration. Analyses of MPL kinetics for both acute and chronic dosing have been described previously (12, 15). In addition, pharmacokinetic/pharmacodynamic relationships for the expression of both tyrosine aminotransferase (TAT) and phosphoenolpyruvate carboxykinase (PEPCK) activities and mRNA levels assessed by Northern hybridization have been previously published for both the acute and chronic dose regimens (15, 16).
Fig. 4.
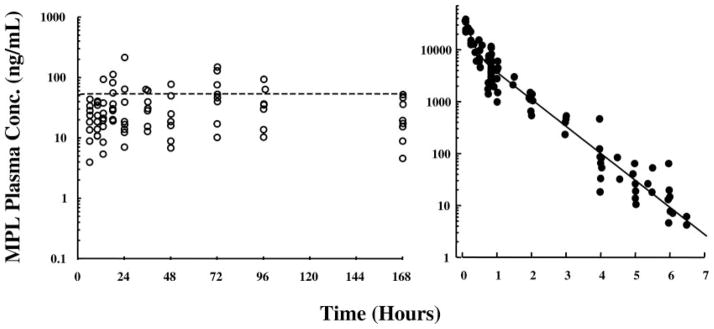
MPL concentrations in rat plasma after chronic (left) and acute (right) administration of drug. MPL concentrations were determined by normal-phase HPLC analysis of plasma samples obtained from individual animals.
Data mining of gene arrays from this chronic MPL treatment series identified 1989 MPL-regulated probe sets on the R230A gene chips used in this experiment. We also previously obtained liver samples from a population of animals after administration of a single dose of MPL. Liver samples from those animals were collected in a time series that involved 16 time points over a 72-h period. RNAs from those livers were applied to the older Affymetrix RU34A chip. A similar filtering schema as applied to that dataset identified 1519 probe sets as being regulated by MPL. Using Affymetrix homology tables and Blast searches, we identified 464 probe sets of the 1519 on the U34A chip that corresponded to 417 of the 1989 identified probe sets on the U230A chip. Because both chips in some cases contain multiple probe sets for the same gene, and because there is a higher degree of probe set redundancy on the older U34 chip, the number of corresponding probe sets common to the two chips are not equal. Likewise, the number of genes actually represented in this common set is less than the number of probe sets. We identified 358 genes that were regulated by MPL in response to both dosing regimens. Most likely this list does not contain all genes regulated by MPL in liver. A perusal of both data-sets indicates that there were many probe sets that failed the quality control filter on one of the two chips and were thus eliminated. Nonetheless, these 358 genes have a very high degree of certainty of being regulated by MPL in the liver. In addition, the two profiles taken together provide an important foundation for understanding the mechanisms underlying the drug’s regulation of genes in the liver.
Response profiles
Of the 358 genes, profiles for 109 showed enhanced regulation after both dosing regimens. A reasonable hypothesis is that if different genes are responding by the same mechanism of regulation, then their profiles should be the same in response to these two different dosing regimens. However, examination of individual profiles demonstrates that this is not always the case. As an example, Fig. 5 shows response profile exemplars of two different genes with enhanced expression to the two dosing regimens but that differ from each other in response to MPL. The first gene (Fig. 5, left) is ornithine decarboxylase 1 (Odc1), the first enzyme in polyamine biosynthesis (17). This gene exhibits tolerance, a phenomenon we have earlier described for the enzyme TAT in liver (12, 18). Specifically, this gene almost recovers to its baseline after a period of time in response to chronic MPL infusion despite continuous presence of the drug (12). In various earlier reports, we presented data demonstrating that the glucocorticoid receptor (GR) is strongly down-regulated in response to MPL (12, 13, 15, 18, 19). Because GR mediates the effect of the drug, the large reduction in this effector molecule should greatly reduce the driving force for changes in gene expression, thus reducing the effect of the drug. The second gene (Fig. 5, right) showing enhanced expression is tryptophan 2,3-dioxygenase (Tdo2), the first enzyme in the kynurenine pathway (20). For this gene, the enhanced expression in response to the single bolus dose is more sustained than Odc1. However, the chronic time profile shows a second and higher period of enhanced expression that continues throughout the entire 168-h infusion period. These data illustrate that enhanced expression to corticosteroids probably involves multiple mechanisms and that our initial classification of enhanced regulation is too simplistic.
Fig. 5.
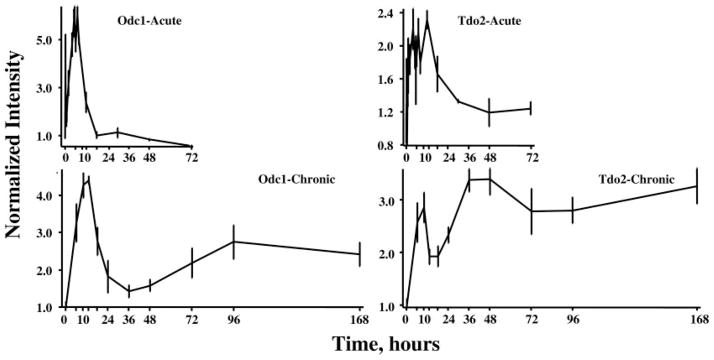
Response profiles of two genes showing enhanced expression after acute and chronic MPL dosing. Ornithine decarboxylase (Odc1) expression is shown in the two left panels and exhibits a similar pattern of enhanced expression with acute and chronic dosing. Tryptophan 2,3-dioxygenase (Tdo2) is presented in the two right panels and exhibit dissimilar patterns with acute and chronic dosing.
Of the 358 genes, the profiles of 104 showed down-regulation after both dosing regimens. As with enhanced regulation, this classification is inadequate to capture the multiple patterns extant within this group. As an example, Fig. 6 shows the expression profiles of two genes that exhibit reduced expression in response to both dosing regimens. The first gene (Fig. 6, left) is progestin and adipoQ receptor family member VII (paqr7). One endogenous ligand for this receptor is adiponectin, a protein hormone produced and secreted by adipocytes and which regulates the metabolism of lipids and glucose (21). The response of this gene to acute dosing is a transient reduced expression. The first part of the response profile to chronic infusion also suggests a transient down-regulation with return to baseline. However, a second influence seems to then cause a slow decline in expression throughout the remainder of the infusion period. The second exemplar of a gene responding to both dosing regimens with decreased expression (Fig. 6, right) is C-type lectin, superfamily member 13, also known as Kupffer cell receptor (Kclr), which is involved in the cellular immune response (22). The response of this gene to acute dosing is a longer lasting transient period of decreased expression than is seen with paqr7. However, the response to chronic dosing is a decreased expression that is sustained throughout the entire infusion period.
Fig. 6.
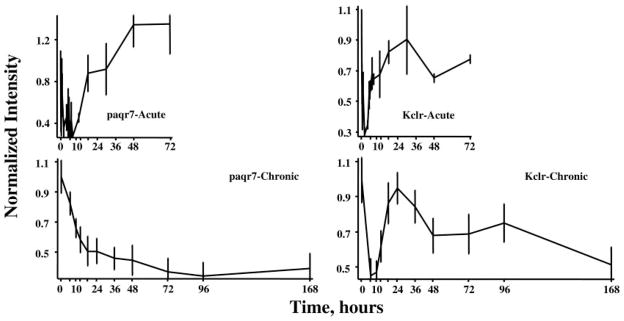
Response profiles of two genes showing reduced expression after acute and chronic MPL dosing. Progestin and adipoQ receptor family member VII (paqr 7) expression is shown in the two left panels and exhibits a similar pattern of reduced expression in the two dosing regimens. Kupffer cell receptor (Kclr), which exhibits dissimilar patterns of regulation with acute and chronic dosing, is presented in the two right panels.
The remaining 145 of the 358 genes showed profiles suggesting complex regulation involving both enhanced expression and down-regulated expression. In the initial analysis of the acute response dataset, we identified two clusters of genes with what we referred to as biphasic regulation in which there was an initial down-regulation followed by enhanced expression. Figure 7 shows the acute and chronic profiles of two genes that show initial down-regulation in the acute profile followed by a period of enhanced regulation. The first gene (Fig. 7, left) is G0/G1 switch gene 2 (GOS2), which is involved in cell cycle regulation (23). The acute profile shows down-regulation followed by enhanced expression. In the response to chronic infusion, the initial down-regulation phase is only suggested by one point and is followed by enhanced expression that continues throughout the entire 168 h. However, the pattern suggests that a third factor may be influencing expression beyond 48 h. In preliminary experiments, we determined that the release from the pump required about 6 h to reach steady-state blood MPL concentrations. This governed our choice of 6 h as the first sampling point. The second exemplar of down-regulation followed by enhanced regulation (Fig. 7, right) is arginase 1 (Arg1), which is involved in ammonia detoxification (24). Acutely the profile shows a sharp down-regulation followed by a period of enhanced regulation and a return to baseline by 48 h. However, in the response to chronic infusion, the initial down-regulation was missed due to our sampling schema. The profile does suggest that a second influence may be intervening after 24 h to maintain the enhanced expression throughout the remainder of the infusion period.
Fig. 7.

Response profiles of two genes showing complex regulation of expression after acute and chronic MPL dosing. G9/G1 switch gene 2 (GOS2) and Arginase (Arg1) both exhibit initial down-regulation followed by a period of enhanced regulation.
Figure 8 provides examples of two genes in which the profile suggests a period of enhanced expression followed by down-regulation. The first exemplar (Fig. 8, left) is heterogeneous nuclear ribonucleoproteins methyltransferase-like 2 (Hrmt1L2), which is involved in the regulation of transcription (25). This enzyme shows a period of enhanced regulation followed by down-regulation in both profiles. The second exemplar in this group is nuclear receptor superfamily 0, group B, member 2 (NR0b2), also known as small heterodimer partner (Fig. 8, right). Proteins in this superfamily bind and are activated by small hydrophobic hormones such as retinoic acid, thyroid hormone, and steroids. This superfamily also includes orphan nuclear receptors (26). The acute profile for this gene shows a rapid and short-lived transient increase followed by a relatively long-lasting period of down-regulation. The chronic profile misses the initial up-regulation but captures what appears to be a two-phase down-regulation.
Fig. 8.
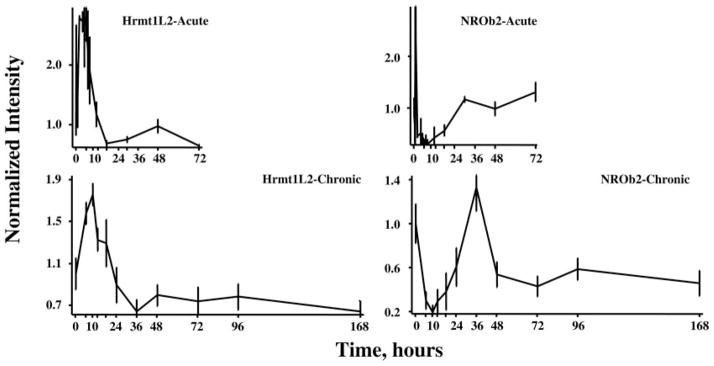
Response profiles of two genes showing complex regulation of expression after acute and chronic MPL dosing. In this case, both heterogenous nuclear ribonucleoprotein methyltransferase (Hrm1L2) and nuclear receptor superfamily 0, group B member 2 (NROb2) show initial up-regulation followed by a later down-regulation.
Gene groupings and expression profiles
We also searched all 358 genes primarily using the NCBI “search across databases” feature. Based on this information and domain knowledge, we grouped the 358 genes primarily on function with two additional groups based on subcellular localization (mitochondrial and plasma membrane). These groups are presented in Tables 1–13 and list identifying criteria as well as temporal responses after both acute and chronic treatments. Although not perfect, these groupings together with the expression profiles provide insight into the global impact of corticosteroids on the liver. The most highly populated group is termed transcription-translation, which contains 54 genes (Table 1). The majority of genes in this group are transcription factors, indicating that a major influence of corticosteroids derives from their ability to alter the effect of other influences of transcription. Because alterations in the amount of messages have an impact only once they are reflected as changes in protein, the consequence of these changes should be delayed in time. Such a time delay may therefore explain the significant number of genes that express complex regulation. Also included in this group are a number of genes such as Nap1l1, Ddx3x, Nopp140, IMP3, EIF2C1, and EIF3 whose enhanced expression indicate increased translational activity, which is consistent with the generally anabolic effect of corticosteroids on liver.
TABLE 1.
MPL-regulated probe sets related to transcription-translation
| 230A probe set | 230A accession | U34A probe set/accession | Symbol | Identification | Response
|
|
|---|---|---|---|---|---|---|
| Acute | Chronic | |||||
| 1387947 | U56241 | U56241 | Mafb | Transcription factor Maf1 | Up | Up |
| 1387870 | AB025017 | X63369 | TIS11 | Transcription factor (immediate early gene) | Up | Up |
| 1386910 | AF311054 | D44495 | Apex | Apurnic Endonuclease (DNA repair) | Up | Up |
| 1371987 | BI274697 | AA891891 | DNA repair | Polymerase (DNA directed) sigma (DNA repair) | Up | Up |
| 1367601, 1367602 | NM_053698 | AA900476 (2), AI014091 | Cited2 | Cbp/p300-interacting transactivator | Up | Up |
| 1387779 | NM_031668 | AI237258, AI229637 | Mybbp1a | MYB binding protein (P160) 1a | Up | Up |
| 1368308 | NM_012603 | Y00396 (2) | Myc | Myelocytomatosis proto-oncogene | Up | Up |
| 1367831 | NM_030989 | X13058 | Tp53 | Tumor protein p53, p53 tumor sUppressor | Up | Up |
| 1389508, 1374404 | BI288619 | AA944014 | v-jun Sarcoma virus 17 oncogene | Up | Up | |
| 1389521 | AI408553 | AA799539 | IVNS1ABP | Influenza virus NS1A binding protein | Up | Up |
| 1392633 | BE105480 | AA946439 | H4 | Histone H4 | Up | Up |
| 1371872, 1370826, 1373473 | BM386384 | AF062594 (2), AA859920, AA866472 | Nap1l1 | Nucleosome assembly protein 1-like 1 | Up | Up |
| 1372242, 1375901 | AI169598 | U21719 | Ddx3x | DEAD (Asp-Glu-Ala-Asp) box polypeptide 3, helicase (RNA) | Up | Up |
| 1368031, 1368032, 1368033 | NM_022869 | AA998882, M94287 | Nopp140, Nolc1 | Nucleolar phosphoprotein 140, interacts with RNA pol | Up | Up |
| 1388321 | BG378108 | AA799369 | IMP3 | U3 small nucleolar ribonucleoprotein (ribosome biogenesis) | Up | Up |
| 1368867 | BF281131 | H31692 | EIF2C1, GERP95 | Translation initiation factor 2C | Up | Up |
| 1388576 | BF281368 | AA875205 (2) | EIF3 | Translation initiation factor 3 | Up | Up |
| 1372090 | AI231566 | D14448 | Max | Myc family DNA-binding protein, leucine zipper | Up | Up |
| 1388779, 1387962 | U41164, BG381516 | U41164 | rKr1, Zfp180 | Cys2/His2 zinc finger protein (Kruppel family) | Up | Up |
| 1373012, 1373011 | BE109520 (2) | AA894086 | Zfp622 | Zinc finger protein 622 | Up | Up |
| 1371864, 1370209 | BE101336, AW524563 | D12769 | Bteb1 | Klf9, Basic transcription element binding protein 1 | Up | Up |
| 1387714, 1369737, 1369738 | AB031423, NM_017334 (2) | S66024 | CREM | Transcriptional repressor, cAMP-responsive element | Up | Up |
| 1371781 | BI285863 | AI639141, X91810 | Stat3 | Signal transducer and activator of transcription 3 | Up | Up |
| 1371714 | BG378760 | AA893885 | Foxk2 | Forkhead box K2 | Up | Up |
| 1371489 | AI011748 | AF022081 | Rnf4 | Small nuclear RING finger protein | Up | Up |
| 1370510 | AB012600 | AF015953 | ARNTL, BMAL1b | BMAL1b, aryl hydrocarbon receptor nuclear translocator-like | Up | Up |
| 1370309 | AJ238854 | AB016536 | alf-c1 | Heterogeneous nuclear ribonucleoprotein type A/B | Up/down | Up |
| 1370474, 1370474 | J03933 | J03819 | Thrb, (c-erbA-β) | Rat thyroid receptor hormone β | Down/up | Up |
| 1387365 | NM_031627 | U11685 | Nr1h3 | Liver X receptor, α | Down/up | Up |
| 1372876 | AA799700 | AA799700 | SPS2 | Selenophosphate synthetase 2 | Down/up | Up |
| 1369679 | AB060652 | D78018, × 13167 | NFI-A | Transcription factor nuclear factor1-A1 | Down/up | Up |
| 1369834 | NM_012742 | X55955 | Hnf3a, Foxa1 | Hepatocyte nuclear factor 3-α Forkhead box A1 | Down | Up |
| 1375428 | BE099979 | AA858607 | Creg1 | Repressor of E1A-stimulated genes (cell growth and differentiation) | Down | Up |
| 1376196 | BG375059 | AA800290 | D receptor interacting protein | Down | Down | |
| 1389601, 1373644 | BI293610 | AA859994 | Nfib | Nuclear factor I/B | Down | Down |
| 1387769 | AF000942 | AI171268, AF000942 | Id3 | DNA binding protein inhibitor 3 BHLH | Down | Down |
| 1368712 | NM_019620 | U67082 | Kzf1 | Zinc finger protein 386 (Kruppel-like) | Down | Down |
| 1369959 | NM_017172 | AI136891, AI112516 | Zfp36l1 | Zinc finger protein 36, C3H type-like 1, Kruppel Type 18 | Down | Down |
| 1368711 | NM_012743 | L09647 | Hnf3b, Foxa2 | Forkhead box A2 | Down | Down |
| 1373837 | BI296633 | AI227715 | Rbl2 | Retinoblastoma-like 2 (p130) | Down | Down |
| 1369063 | NM_012903 | AA875495, D32209, | Anp32 | Acidic (leucine-rich) nuclear phosphoprotein 32 family, member A | Down | Down |
| 1367826 | NM_031789 | AI177161 | NF-E2-related factor 2 | Nuclear factor erythroid 2-like 2 | Down | Down |
| 1388650 | BM385445 | AA899854 | Top2a | Topoisomerase (DNA) 2α | Down | Down |
| 1372889 | AI407489 | M64862, AA800797 | DNA-binding protein; matrin F/G | Down | Down | |
| 1367759 | NM_012578 | AI232374 | H1f0 | Histone H1–0 | Down | Down |
| 1370381 | U61729 | U61729 | Prol2 | Proline rich 2 | Up/down | Down |
| 1368376 | NM_057133 | D86580 | Nr0b2 | Small heterodimer partner; SHP; SHP1 | Up/down | Down |
| 1374752 | AI408734 | AI639149 | Mdfic | MyoD family inhibitor domain containing | Up/down | Down |
| 1398756,1398757, 1398758 | NM_012992 | J03969, J04943 | Npm1 | Nucleophosmin 1, nuclear protein B23 | Up | Down |
| 1398832 | NM_012749 | M55015, M55017 | Ncl | Nucleolin | Up | Down |
| 1370711 | AF000900 | U63839, AF000899, AF000901 | p58/p45 | Nucleoporin p58 | Up | Down |
| 1387028 | M86708 | L23148 | Id1 | DNA-binding protein inhibitor 1 BHLH | Up | Down |
| 1372757, 1368835, 1387354 | BM386875 | AA892553 | Stat1 | Activator of transcription 1 | Up | Down |
| 1386897 | NM_024363 | U60882 | Hrmt1l2 | Heterogeneous nuclear ribonucleoproteins methyltransferase-like 2 | Up/down | Up/down |
| 1368303 | NM_031678 | AB016532 | Per2 | Period homolog 2 | Oscillating | Oscillating |
Probe sets regulated by MPL in rat liver after both acute and chronic drug administration and categorized as relating to either transcription or translation. Affymetrix 230A arrays use a probe set number distinct from GenBank accession numbers, whereas U34A chips use a common probe set/GenBank accession number for identification.
TABLE 13.
ESTs regulated by MPL
| 230A probe set | 230A accession | U34A probe set/accession | Symbol | Response
|
|
|---|---|---|---|---|---|
| Acute | Chronic | ||||
| 1394127 | AA943800 | AA892541 | EST | Up | Up |
| 1382516 | AI170660 | AA859725 | EST | Up | Up |
| 1376965 | BM389656 | AA893603 | EST | Up | Up |
| 1367543 | BG377443 | AA894234 | EST | Up | Up |
| 1383233 | BI289032 | AA891749 | EST | Down/up | Up |
| 1393061 | AI030103 | AA891739 | EST | Down/up | Up |
| 1385889 | AA893212 | AA893212 | EST | Down | Up |
| 1393751 | AA859029 | AA892778 | EST | Down | Down |
| 1372261 | AI409067 | AA891737 | EST | Down | Down |
| 1373970 | AI716248 | AA892986 | EST | Down | Down |
| 1389561 | BE110624 | AA891950 | EST | Down | Down |
| 1376792 | AW251313 | AA892027 | EST | Down | Down |
| 1374478 | AA819329 | AA892861 | EST | Down | Down |
| 1374767 | AI105450 | AA799396(2) | EST | Down | Down |
| 1376098 | BF282304 | AA875126 | EST | Up/down | Up/down |
Probe sets regulated by MPL in rat liver after both acute and chronic drug administration but at present unidentified. Affymetrix 230A arrays use a probe set number distinct from GenBank accession numbers, whereas U34A chips use a common probe set/GenBank accession number for identification. EST, Expressed sequence tag.
The second most populated group is termed signaling with 53 members (Table 2). Eighteen members of this group show up-regulation in both the acute and chronic profiles, and 15 show down-regulation in both acute and chronic. What is unusual about this group is the large number of genes, 21, that show complex regulation. As might be expected, this group is dominated by kinases and phosphatases. We have also included in this group several membrane receptors that could have been included in the membrane group but were included in this group because of their involvement in signaling. Of particular interest is paqr7 whose endogenous ligand is adiponectin, a hormone produced by adipose tissue that is involved in the regulation of systemic energy metabolism (21). The down-regulation of this receptor after both acute and chronic dosing may provide additional insight into the metabolic dysregulation attendant on corticosteroid treatment.
TABLE 2.
MPL-Regulated probe sets related to cell signaling
| 230A probe set | 230A accession | U34A probe set/accession | Symbol | Identification | Response
|
|
|---|---|---|---|---|---|---|
| Acute | Chronic | |||||
| 1371081 | U78517 | U78517 | Cgef2, Rapgef4 | Rap guanine nucleotide exchange factor (GEF) 4 | Up | Up |
| 1367960 | NM_019186 | X77235 | Arl4 | ADP-ribosylation factor-like 4 | Up | Up |
| 1398790 | NM_017039 | AI012595 | Ppp2ca | Protein phosphatase 2a, catalytic sub-unit, α isoform | Up | Up |
| 1368147, 1368146 | U02553, BE110108 | U02553 | Ptpn16, Dusp1 | MAPK phosphatase-1, protein tyrosine phosphatase non-receptor-type 16 | Up | Up |
| 1387078 | NM_031002 | U26397 | Inpp4a | Inositol polyphosphate-4-phosphatase, type 1 | Up | Up |
| 1398847, 1370180 | AA891213, BG376935 | U95001 | Nudt4 | Diphosphoinositol polyphosphate phosphohydrolase 2 | Up | Up |
| 1377136, 1367697 | NM_031020, AW254190 | AA924542, U73142 (2), AI171630, U91847, AI137862 | Mapk14, p38 | MAPK 14 | Up | Up |
| 1367802 | NM_019232 | L01624 | Sgk | Serum/glucocorticoid-regulated kinase, serine/threonine protein kinase SGK | Up | Up |
| 1367725 | NM_022602 | AF086624 | Pim3 | Serine/threonine-protein kinase pim-3 | Up | Up |
| 1380262 | AA893436 | AA893436 | sgk | Serum/glucocorticoid regulated kinase | Up | Up |
| 1368947 | NM_024127 | L32591 (2), AI070295, AI070295 | Gadd45a | Growth arrest and DNA-damage-inducible 45α | Up | Up |
| 1369065 | NM_017290 | J04024 | Atp2a2, Serca2 | ATPase, Ca2+ transporting | Up | Up |
| 1387154 | NM_012614 | M15880 | Npy | Neuropeptide Y (Npy) | Up | Up |
| 1372558 | AI177404 | AI177404 | NMDA receptor-regulated gene 1 | Up | Up | |
| 1389974 | BF555171 | L15618 | CK2 | Casein kinase II α subunit | Up | Up |
| 1387907 | J05510 | J05510 | InsP3R1 I145TR |
Inositol 1,4,5-triphosphate receptor | Up | Up |
| 1373306 | BM386212 | M81639 | Snn | Stannin | Up | Up |
| 1372355 | BE109242 | U09793 | c-Ki-ras | Kirsten rat sarcoma viral oncogene homolog 2 | Up | Up |
| 1373082 | AA893743 | AA893743 | Protein kinase inhibitor, α | Up | Up/down | |
| 1372770 | BF281357 | X13933 | CaMI | Calmodulin 1 | Up | Down/up |
| 1390240 | BM389611 | AA800456 | CKLiK | Calcium-calmodulin-dependent kinase I-like kinase (CKLiK) | Down | Up |
| 1377417 | BE099931 | AA800678 | Ticam1 | Toll-like receptor adaptor molecule 1 | Down | Up |
| 1370522 | L04796 | M96674 | Gcgr | Glucagon receptor | Down | Up |
| 1387981 | AF079864 | AF079864 | Olfr78 | G-protein coupled receptor RA1c, olfactory receptor 59 | Down | Up |
| 1368675 | NM_032084 | AI232194 | CHN2 | Chimerin (chimaerin) 2 | Down | Up |
| 1368289 | AA944965 | M12450 | Vdbp, DBP02 | Group-specific component (vitamin D-binding protein) | Down | Up |
| 1390798 | BF288130 | M10072 | L-CA | Leukocyte common antigen | Down | Down |
| 1387024 | NM_053883 | X94185 | mkp-3 | MAPK phosphatase | Down | Down |
| 1368871 | NM_053887 | U48596 | Map3k1 | MAPK kinase kinase 1 | Down | Down |
| 1368646 | NM_017322 | L27112, AI231354 | Mapk9 | MAPK 9 | Down | Down |
| 1387024 | NM_053883 | X94185, U42627 | Dusp6 | Dual specificity phosphatase 6 | Down | Down |
| 1368646 | NM_017322 | AI231354 | SAPK | Stress-activated protein kinase α II | Down | Down |
| 1372844, 1398273 | AW531877, NM_053599 | AA892417, D38056 | Efna1, B61 | Eph-related receptor tyrosine kinase ligand 1 | Down | Down |
| 1389779 | AA800626 | AA800626 | Sh2d4a | SH2 domain containing 4A | Down | Down |
| 1375879 | BE111762 | AF061443 | Gpr48 | G protein-coupled receptor 48 | Down | Down |
| 1367644 | L01115 | L01115 | Adcy6 | Adenylyl cyclase type VI | Down | Down |
| 1369644 | NM_134408 | AF063102 | CIRL-2 | Calcium-independent α-latrotoxin receptor homolog 2, latrophilin 2 | Down | Down |
| 1368924 | NM_017094 | Z83757 (2) | Ghr | GH receptor | Down | Down |
| 1377966 | BI275560 | AA894316 | paqr7 | Progestin and adipoQ receptor family member VII | Down | Down |
| 1367745 | NM_031143 | D78588 | Dgkz | Diacylglycerol kinase ζ | Down | Down |
| 1371969 | BI291848 | AI180288 | Cald1 | Caldesmon 1 | Down | Down |
| 1368202 | NM_024159 | U95178 | Dab2 | Disabled homolog 2 | Up/down | Down |
| 1367881 | NM_013016 | D85183 | SHPS-1 | Protein tyrosine phosphatase, non-receptor-type substrate 1 | Up/down | Down |
| 1370949, 1370948, 1373432 | BE111604, M59859 | AA859896, AA925762, AA899253 | Macs | Myristoylated alanine-rich C-kinase substrate | Up | Down |
| 1368856 | NM_031514 | U13396, AJ000557, U13396 | Jak2 | Janus kinase 2 | Up | Down |
| 1368693 | NM_024145 | X57018 | Fgr | Gardner-Rasheed feline sarcoma viral oncogene homolog (kinase) | Up | Down |
| 1367844 | M12672 | AA875225 | G-α-i2 | GTP-binding protein | Up | Down |
| 1368975, 6, 1390325 | NM_013127, D30795, BI289418 | D29646 | Cd38 | ADP-ribosyl cyclase; CD38 | Up | Down |
| 1368821, 1368822, 1372331 | BG665037, BI290885, NM_024369 | AA891233 | Fstl1 | Follistatin-related protein | Up | Down |
| 1370288 | AF372216 | X02412, M60666 | TP-3 | Tropomyosin α-isoform | Up | Down |
| 1388140 | AW253722 | M83678 | Rab13 | RAB13, member RAS oncogene family | Down/up | Down |
| 1370414 | M94043 | M94043 | Rab38 | Rab38, member of RAS oncogene family | Down/up | Down |
| 1368821 | NM_024369 | AA859885, AA891233 | Frp, Fstl1 | Follistatin-like 1, activin-binding protein | Down/up | Down |
| 1368536 | NM_057104 | D28560 | NPH-type III | Phosphodiesterase I/nucleotide pyrophosphatase 2 | Down | Down/up/down |
Probe sets regulated by MPL in rat liver after both acute and chronic drug administration and categorized as relating to cell signaling. Affymetrix 230A arrays use a probe set number distinct from GenBank accession numbers, whereas U34A chips use a common probe set/GenBank accession number for identification.
The third most populated group is termed small molecule metabolism and contains 38 genes (Table 3). The large numbers of genes in this group reflect both the major role of the liver in small molecule metabolism and the impact of corticosteroids on this function. This group is also unusual in the large number of genes showing complex regulation.
TABLE 3.
MPL-regulated probe sets related to small molecule metabolism
| 230A probe set | 230A accession | U34A probe set/accession | Symbol | Identification | Response
|
|
|---|---|---|---|---|---|---|
| Acute | Chronic | |||||
| 1387109 | NM_031576 | AI137856, M10068 | Por | P450 (cytochrome) oxidoreductase | Up | Up |
| 1371021, 1375412 | AI101331 | D49434 | Arsb | Arylsulfatase B, lysosomal Glycosaminoglycan degradation | Up | Up |
| 1370370 | AF034218 | AF034218 (2) | Hyal2 | Hyaluronidase 2, lysosomal glycosaminoglycan degradation | Up | Up |
| 1387963 | M24396 | J03959, × 13098 | Uricase, urate oxidase 2 | Up | Up | |
| 1387740, 1379361 | NM_053487 | AA892128, AJ224120 | Pex11a | Peroxisome biogenesis factor 11A | Down/up | Up |
| 1368180 | NM_017013 | AI235747 | Gsta2 | Glutathione-S-transferase, α-type 2 | Down/up | Up |
| 1369986 | NM_033349 | AI012802 | Hagh | Hydroxyacyl glutathione hydrolase, both cytosol and M | Down/up | Up |
| 1367798 | NM_017201 | M15185 | Ahcy | S-adenosylhomocysteine hydrolase, cytosol | Down/up | Up |
| 1370698 | M13506 | M13506 | UDPGTR-2 | Liver UDP-glucuronosyltransferase, phenobarbital-inducible, microsomal | Down/ up | Up |
| 1398307 | D38381 | D38381 | Cyp3a18 | P450 6β-2 | Down/up | Up |
| 1387314 | NM_022513 | D89375 | Sult1b1 | Sulfotransferase family 1B, member 1 cytosol | Down/up | Up |
| 1387825 | NM_031533 | J02589 | Androsterone UDP-glucuronosyltransferase | Down/up | Up | |
| 1368226 | NM_133525 | U82591 | Rcl, C6orf108 | Nucleoside 2-deoxyribosyltransferase domain (c-Myc-responsive) | Down/up | Up |
| 1387659 | AF245172 | AA859837 (2) | Gda | Guanine deaminase | Up | Down/up |
| 1387973 | U39206 | U39206 | CYP4F4 | CYP4F4 | Down | Up |
| 1387243 | K02422 | K03241 | Cyp1a2 | Cyp1a2 | Down | Up |
| 1370496 | AB008424 | AB008424 | Cyp2d3 | Cyp2d3 | Down | Up |
| 1367843 | NM_134407 | AA892821 (2) | Akr7a2, Aiar | Aldo-keto reductase family 7, member A2 (aflatoxin aldehyde reductase), perox | Down | Up |
| 1388300 | AA892234 | AA892234 | Gst3 | Glutathione S-transferase 3, microsomal | Down | Up |
| 1368717 | NM_024132 | U72497 | Faah | Fatty acid amide hydrolase (degrades bioactive fatty acid amides) | Down | Up |
| 1387958 | L32601 | L32601 | 20 α-Hydroxysteroid dehydrogenase | Down | Up | |
| 1387672 | NM_017084 | X06150, AA893219 | Gnmt | Glycine methyltransferase | Down/up/down | Up |
| 1371076 | AI454613 | K01721 | Cyp2b15 | Cyp2b15 | Down/up | Down/up |
| 1368497 | NM_012833 | D86086 | Abcc2 | ATP-binding cassette, sub-family C (CFTR/MRP), member 2 | Down/up | Down |
| 1370397 | M33936 | AA924591 | Cyp4A3 | Cytochrome P450 4A3 | Up | Down |
| 1370080 | NM_012580 | J02722 | HEOXG Heox Hmox | Heme oxygenas | Up | Up/down |
| 1387916 | U39208 | U39208 | U39208 | CYP4F6 | Down | Down |
| 1369424 | NM_012693 | J04187 | Cyp2a2 | Cyp2a2 | Down | Down |
| 1367988 | U04733 | U04733 | cyp 2C23 | Cytochrome P450 arachidonic acid epoxygenase | Down | Down |
| 1387669 | NM_012844 | M26125 | Ephx1 | Epoxide hydrolase 1, microsomal | Down | Down |
| 1387214 | NM_031565 | X81395 | Ces1 | Carboxylesterase 1 | Down | Down |
| 1387022 | NM_022407 | AF001898 | Aldh1a1 | Aldehyde dehydrogenase family 1, member A1 cytosolic | Down | Down |
| 1369296 | NM_031732 | L22339 (2) | Sult1a2 | Sulfotransferase family, cytosolic, 1C, member 1, N-hydroxy-2-acetylaminofluorene; sulfotransferase | Down | Down |
| 1387221 | NM_024356 | AI639457 | Gch | GTP cyclohydrolase 1 | Down | Down |
| 1378753 | AI638971 | AI638971 | Tpmt | Thiopurine methyltransferase | Down | Down |
| 1368409 | NM_012796 | AI138143, D10026 | Gstt2 | Glutathione S-transferase, θ 2 | Down | Down |
| 1370688, 1372523, 1370030 | J05181, AA892770, NM_017305 | J05181 (3), S65555 | Glclc | Glutamate-cysteine ligase, catalytic subunit | Down | Down |
| 1368826 | NM_012531 | M93257, M60753 | Comt | Catechol-O-methyltransferase | Up/down/up | Down |
Probe sets regulated by MPL in rat liver after both acute and chronic drug administration and categorized as relating to small molecule metabolism. Affymetrix 230A arrays use a probe set number distinct from GenBank accession numbers, whereas U34A chips use a common probe set/GenBank accession number for identification.
The next most populated group is classified as plasma membrane localized with 33 members (Table 4). Because the surface membrane of a cell mediates its interaction with the external environment, this group by necessity is difficult to distinguish from the signaling group. Pharmacologically, corticosteroids are used for their antiinflammatory and immunomodulatory effects. The liver plays a major role in immune protection both directly and indirectly. The direct effects are the production and secretion of a variety of proteins involved in immune responses such as complement proteins. Indirectly, the liver harbors the Kupffer cell population that provides a defense barrier between the hepatic portal system and general circulation. The immune related group contains 31 genes (Table 5). These 31 genes illustrate the broad impact of corticosteroids on both immune and inflammatory processes. In addition, these results illustrate the type of coordinated effects corticosteroids have on the immune system. For example, complement protein C1q is down-regulated in both the acute and chronic profiles, whereas complement protein C1q binding protein, which binds and inhibits C1q activation, is up-regulated in both (27, 28).
TABLE 4.
MPL-regulated probe sets localized to plasma membranes
| 230A probe set | 230A accession | U34A probe set/accession | Symbol | Identification | Response
|
|
|---|---|---|---|---|---|---|
| Acute | Chronic | |||||
| 1371113 | M58040 | M58040 | Tfrc, CD71 | Transferrin receptor | Up | Up |
| 1387027 | U72741 | U72741 | Lgals9 | β-Galactoside binding lectin 9 | Up | Up |
| 1369716 | NM_012976 | L21711 | Lgals5 | β-Galactoside binding protein 5 | Up | Up |
| 1386937, 1367814 | M14137, AI232036 | AI112173 | Atp1b1 | ATPase Na+/K+ transporting β1 | Up | Up |
| 1367585, 1371108 | M74494, M28647 | M74494 | Nkaa1b | Na,K-ATPase α-1 subunit | Up | Up |
| 1370262_at | AI706785 | AF100421 | Lyric | Metadherin, metastasis | Up | Up |
| 1367568_a_at | NM_012862 | AI012030 | Mgp | Matrix Gla protein | Up | Up |
| 1367579_a_at | BI285434 | AA892333 | Tuba1 | Tubulin, α6 | Up | Up |
| 1371542_at | BI284599 | J00797 | Tubulin, α4 | Up | Up | |
| 1367669 | AI233190 | U05784 | MPL3 | Light chain 3 subunit of microtubule-associated proteins 1A and 1B | Up | Up |
| 1367721 | NM_012649 | S61868 | SYND4 | Syndecan 4, ryudocan | Up | Up |
| 1369976_at | NM_053319 | AI009806 | MGC94628 | Dynein, cytoplasmic, light chain 1 | Up | Up |
| 1376098_a_at | BF282304 | AA875126 (2) | Myo1g | Myosin IG | Up | Up |
| 1369720_at | NM_053986 | X68199 | Myo1b | Myosin Ib | Up | Up |
| 1374171, 1387287 | D83598, AI170507 | AF019628 | Sur2 | Sulfonylurea receptor 2 | Up | Up |
| 1373842 | BM390718 | AA858620 | N-WASP | Wiskott-Aldrich syndrome gene-like | Up/down | Up |
| 1370526_at | AF020045 | AF020046 | Itgae | Adhesion receptor, integrin α E1 | Down/up | Up |
| 1369953 | BI285141 | U49062 (2) | Cd24 | CD24 antigen | Up | Down |
| 1373932 | BE098739 | AA894029 | Cybb | Endothelial type gp91-phox | Up | Down |
| 1390659 | BI302830 | M61875 | HAMM CD44A METAA | Cell surface glycoprotein (hyaluronate binding protein) | Up | Down |
| 1368419 | AF202115 | AI639438 | glypican 1 | GPI-anchored ceruloplasmin | Up | Down |
| 1387856_at | BI274457 | AA944422 | Cnn3 | Calponin 3 | Up/down | Down |
| 1387206_at | NM_031740 | AF048687 | B4galt6 | UDP-Gal:β GlcNAc-β 1,4-galactosyltransferase, polypeptide 6 | Up/down | Down |
| 1372087 | BG666916 | AJ012603 | TACE | TNF-α converting enzyme | Up/down | Down |
| 1367849_at | NM_013026 | X60651, S61865 | Synd1 | Syndecan 1 | Down | Down |
| 1368642, 1387259 | AF097593, NM_031333 | AF097593 (2) | Cdh2 | N-cadherin | Down | Down |
| 1388441_at | BG379987 | AA892773 | Thymosin, β 4 | Down | Down | |
| 1386938_at | NM_031012 | M25073 | Anpep, CD13 | Alanyl (membrane) aminopeptidase | Down | Down |
| 1372780_at | BM391310 | AA892353 | Transmembrane protein 53 | Down | Down | |
| 1368115_at | NM_031700 | M74067 | Cldn3 | Claudin 3 | Down | Down |
| 1387061_at | NM_031047 | 1387061_at | Jup | Junction plakoglobin, γ-catenin | Down | Down |
| 1367812_at | NM_019167 | AB001347 | Spnb3 | β-Spectrin 3 | Down | Down |
| 1383606_at | BI302544 | AI639417 | Membrane targeting (tandem) C2 domain containing 1 | Down | Down | |
Probe sets regulated by MPL in rat liver after both acute and chronic drug administration and identified as localized to plasma membranes. Affymetrix 230A arrays use a probe set number distinct from GenBank accession numbers, whereas U34A chips use a common probe set/GenBank accession number for identification.
TABLE 5.
Immune-related MPL-regulated probe sets
| 230A probe set | 230A accession | U34A probe set/accession | Symbol | Identification | Response
|
|
|---|---|---|---|---|---|---|
| Acute | Chronic | |||||
| 1398784 | NM_019259 | AI178135 | C1qbp | C1q binding, inhibits C1 activation | Up | Up |
| 1390104 | BI296551 | AI010580 | Irgq | Immunity-related GTPase family, Q | Up | Up |
| 1388331 | BG057543 | AA685903 | Tumor rejection antigen gp96 | Up | Up | |
| 1375686 | AI706907 | AA892680, AA892298 | Ppil3 | Peptidylprolyl isomerase (cyclophilin)-like 3 | Up | Up |
| 1367657 | NM_017258 | L26268 (2) | Btg1 | B-cell translocation gene 1, antiproliferative | Up | Up |
| 1368668 | NM_053866 | U17901 | Plaa | Phospholipase A2, activating protein | Up | Up |
| 1370750, 1369255 | NM_013123 | M95578 (2), U14010 (2) | Il1r1 | IL-1 receptor, type I | Up | Up |
| 1371926, 1373140, 1370957 | BM383427 | M92340 | Il6st | IL-6 signal transducer | Up | Up |
| 1386987 | NM_017020 | M58587 | Il6r | IL-6 receptor | Up | Up |
| 1372926 | AI009159 | U27201 | TIMP-3 | Tissue inhibitor of metalloproteinase 3 | Up | Up |
| 1370855 | BG666933 | AI231292 | Cst3 | Cystatin C (inhibitor of cysteine proteinases) cathepsins | Down | Up |
| 1387127 | NM_031351 | AA859645 | Atrn, DPPT-L | Attractin | Down | Up |
| 1398256 | NM_031512 | M98820 | Il1b | IL-1β | Down | Down |
| 1374334 | AI412189 | AI234828 | Ig heavy chain V-III region VH26 precursor | Down | Down | |
| 1371100 | AA859049 | D00362, M20629 | Es2 | Esterase 2 | Down | Down |
| 1368755 | NM_053753 | M55532 | Kclr | C-type (calcium dependent) lectin, superfamily member 13 | Down | Down |
| 1368741 | NM_057146 | U52948 | C9 | Complement component C9 | Down | Down |
| 1373025 | AI411618 | AA891576 | Complement protein C1q β chain | Down | Down | |
| 1370027, 1388229 | M22359, NM_023103 | M22360, M22359 | Mug1 | Murinoglobulin 1 homolog, plasma proteinase inhibitor α-1-inhibitor III | Down | Down |
| 1371015 | X52711 | X52711 | Mx1 | Myxovirus (influenza virus) resistance 1 | Up/down | Down |
| 1370056 | NM_020103 | M30691 | Ly6c | Ly6-C antigen | Up/down | Down |
| 1368332 | NM_133624 | M80367 | Gbp2 | Guanylate nucleotide binding protein 2 | Up/down | Down |
| 1367614 | NM_012904 | S57478, AI171962 | Anxa1 | Annexin A1, lipocortin I | Up/down | Down |
| 1368073 | NM_012591 | M34253 (2) | Irf1 | Interferon regulatory factor 1 | Up/down | Down |
| 1368592, 1371170 | AJ245643, NM_017019 | D00403 | Il1a | IL-1α (Il1a) | Up/down | Down |
| 1367679 | NM_013069 | X13044 | INVG34 | Histocompatibility: class II antigens, γ-chain of | Up/down | Down |
| 1383564 | BF411036 | AA799861(2) | Irf7 | Interferon regulatory factor 7 | Up | Down |
| 1398246 | NM_053843 | M32062 (2) | Fcgr3 | Fc receptor, IgG, low affinity III | Up | Down |
| 1387687 | NM_133542 | AJ223184 | Igsf6 | Ig superfamily, member 6 | Up | Down |
| 1367574 | NM_031140 | X62952 | Vim | Vimentin | Up | Down |
| 1376151 | AI407953 | AA891944 | Interferon-γ-induced GTPase | Down/up | Down | |
Probe sets regulated by MPL in rat liver after both acute and chronic drug administration and categorized as immune related. Affymetrix 230A arrays use a probe set number distinct from GenBank accession numbers, whereas U34A chips use a common probe set/GenBank accession number for identification.
The next group are 29 genes related to protein and amino acid metabolism (Table 6). The liver both produces and degrades serum proteins (29). In addition, the liver is only one of two tissues that can synthesize glucose (30). Amino acid carbon from the musculature is a major substrate for gluconeogenesis, which requires that the resulting ammonia be detoxified. We have included proteosome genes, aminotransferases, and chaperonins as well as a variety of genes involved in the metabolism and synthesis of several amino acids.
TABLE 6.
MPL-regulated probe sets related to protein or amino acid metabolism
| 230A probe set | 230A accession | U34A probe set/accession | Symbol | Identification | Response
|
|
|---|---|---|---|---|---|---|
| Acute | Chronic | |||||
| 1386923, 1375642 | M62388 | M62388 (2), AA799612 | Ubiquitin-conjugating protein | Up | Up | |
| 1371814 | BI282191 | AA859722 | Ube2g2 | Ubiquitin-conjugating enzyme E2G 2 | Up | Up |
| 1382059 | BI289529 | AI639506 | Fbxo30 | F-box protein 30 (Fbxo30), protein-ubiquitin ligases | Up | Up |
| 1392633 | AI045724 | AI639312 | Fbxo32 | F-box only protein 32 (Fbxo32), protein-ubiquitin ligases | Up | Up |
| 1370964 | BF283456 | X12459 | Ass | Argininosuccinate synthetase (ammonia detoxification) | Up | Up |
| 1368720 | NM_022403 | AA945143 | Tdo2 | Tryptophan 2,3-dioxygenase (kynurenine pathway) | Up | Up |
| 1368247 | NM_031971 | AI170613 (2) | Hspa1a, Hsp10 | mitochondrial chaperonin | Up | Up |
| 1398960 | AI172328 | AA875047 | TCP20 | chaperonin subunit 6a (ζ) | Up | Up |
| 1388698 | AI236601 | AI236601 | HSP105 | Heat shock protein 105 | Up | Up |
| 1389021 | BF284746 | AA799531 | ASNS | Asparagine synthetase domain containing 1 | Up | Up |
| 1368188 | NM_017233 | AA866302 | Hpd | 4-Hydroxyphenylpyruvic acid dioxygenase | Down/up | Up |
| 1367695 | NM_022390 | J03481 | Qdpr | Quinoid dihydropteridine reductase (PKU) | Down/up | Up |
| 1368794 | NM_020076 | D28339, D44494 | Haao | 3-Hydroxyanthranilate 3,4-dioxygenase (synthesis of quinolinic acid) | Down/up | Up |
| 1368266 | NM_017134 | J02720 | Arg1 | Arginase 1 (ammonia detoxification) | Down/up | Up |
| 1370200, 1387878 | AI179613, AI233216 | BI284411 | Glud1 | Glutamate dehydrogenase 1(ammonia detoxification) | Down | Up |
| 1368085 | NM_133595 | U85512 | Gchfr | GTP cyclohydrolase I feedback regulator (phenylalanine, tyrosine, and tryptophan hydroxylases) | Down | Up |
| 1368092 | NM_017181 | M77694 | Fah | Fumarylacetoacetate hydrolase (tyrosinemia type I) | Down | Up |
| 1367627 | NM_031031 | U07971 | Gatm | Glycine amidinotransferase (L-arginine:glycine amidinotransferase) | Down | Down |
| 1387307 | NM_017159 | M58308, AB002393 | Hal | Histidine ammonia lyase | Down | Down |
| 1373686 | AA893495 | AA893495 | Serpina6 | Serine (or cysteine) proteinase inhibitor, clade A (α-1 antiproteinase, antitrypsin), member 6 | Down | Down |
| 1387193, 1368447, 1368446 | NM_012674 | M35299 | Spink1 | Serine protease inhibitor, Kazal type 1 | Down | Down |
| 1368280 | NM_017097 | D90404 (2) | Ctsc | Cathepsin C | Down | Down |
| 1370386 | AB002406 | AB002406 | Ruvbl1 | Ribosomal protein s25 | Up/down | Down |
| 1374255 | BI281789 | AA875602 | Phenylalanine-tRNA synthetase-like, α-subunit | Up/down | Down | |
| 1373592 | AI407094 | AA875037 | Serine proteinase inhibitor mBM2A, serine (or cysteine) peptidase inhibitor, clade B, member 9 | Up/down | Down | |
| 1373263, 1376737 | AW523737 | H31976 | SUMO | Sentrin specific protease 5 | Up | Down |
| 1367710 | NM_017257 | D45250 | Psme2 | Proteasome (prosome, macropain) 28 subunit, β | Up | Down |
| 1375421 | AI600019 | AA894089 | Neurodap1 | Neurodegeneration associated protein 1 | Up | Down |
| 1372665 | AI230228 | AI230228 | Phosphoserine aminotransferase | Up | Down | |
Probe sets regulated by MPL in rat liver after both acute and chronic drug administration and categorized as relating to protein or amino acid metabolism. Affymetrix 230A arrays use a probe set number distinct from GenBank accession numbers, whereas U34A chips use a common probe set/GenBank accession number for identification.
The next group of genes, containing 23 members, is termed nuclear encoded mitochondrial genes (Table 7). In this group, all but four genes have chronic profiles indicating enhanced expression. Interestingly, a significant number of these genes show an initial down-regulation followed by up-regulation, giving the acute profiles a biphasic characteristic. Of particular interest in this group is the up-regulation of pyruvate dehydrogenase kinase 1 (Pdk) and the down-regulation of pyruvate dehydrogenase phosphatase isoenzyme 2 (Pdp). The pyruvate dehydrogenase complex is a matrix multienzyme complex that provides the primary link between glycolysis and the tricarboxylic acid (TCA) cycle. This complex is inactivated when it is phosphorylated by Pdk and activated when it is dephosphorylated by Pdp (31). The coordinated opposite regulation of these two enzymes in effect breaks the link between glycolysis and the TCA cycle, which would contribute strongly to the insulin resistance caused by corticosteroids.
TABLE 7.
Nuclear-encoded mitochondrial genes regulated by MPL
| 230A probe set | 230A accession | U34A probe set/accession | Symbol | Identification | Response
|
|
|---|---|---|---|---|---|---|
| Acute | Chronic | |||||
| 1398870, 1370785 | D63411 | U21871, D63411 | TOM20 | Outer mitochondrial membrane receptor rTOM20 | Up | Up |
| 1387773 | NM_012839 | K00750 (2) | Cycs | Cytochrome c, apoptosis | Up | Up |
| 1398763, 1368051 | NM_032066 | U81186 (2) | Hsd17b12 | Translocase of inner mitochondrial membrane 23 | Up | Up |
| 1371795, 1370005 | NM_030586 | Y12517, AI232256 | omb5 | Cytochrome b5, outer mitochondrial membrane isoform | Up | Up |
| 1367982 | NM_024484 | J03190 (2) | Alas1 | Aminolevulinic acid synthase 1, heme biosynthetic | Up | Up |
| 1375504 | BM390747 | AA892950 | Polymerase (DNA), γ2, mitochondrial DNA | Up | Up | |
| 1370918 | BI275939 | L19927 | Atp5c1 | ATP synthase, H+ transporting, mitochondrial F1 complex | Down/up | Up |
| 1386917 | NM_012744 | U32314 (2) | Pc | Pyruvate carboxylase (pyruvate to oxaloacetate) | Down/up | Up |
| 1377758 | BF415386 | AA893658 | Short-chain dehydrogenase/reductase 9 | Down/up | Up | |
| 1389021 | BF284746 | AA891785 | Idh2 | Isocitrate dehydrogenase 2 | Down/up | Up |
| 1368514 | NM_013198 | M23601 | Maob | Monoamine oxidase B, mitochondria | Down/up | Up |
| 1369799 | U29701 | D87839 (2) | Abat | 4-Aminobutyrate aminotransferase, GABA amino-transferase mitochondria | Down/up | Up |
| 1370151 | NM_017072 | M11710, | Cps1 | Carbamoyl-phosphate synthetase 1, mitochondrial (ammonia detoxification) | Down/up | Up |
| 1369671 | K03040 | M11266 | Otc | Ornithine transcarbamylase mitochondria (ammonia detoxification) | Down/up | Up |
| 1370592 | AB019693 | AA893035 | HP33, Keg1 | Kidney expressed gene 1 | Down | Up |
| 1369023 | NM_031052 | M96633 | Mipep | Mitochondrial intermediate peptidase | Down | Up |
| 1368566 | AA964381 | AB000098 | Mipp65 | NADH dehydrogenase (ubiquinone) flavoprotein 3-like | Down | Up |
| 1370232 | AI102838 | J05031 | Ivd | Isovaleryl coenzyme A dehydrogenase | Down | Up |
| 1368079 | NM_053826 | L22294 | Pdk1 | Pyruvate dehydrogenase kinase 1 | Down | Up |
| 1370509 | AF062741 | AF062741(2) | Pdp2 | Pyruvate dehydrogenase phosphatase isoenzyme 2 | Down | Down |
| 1368387, 1374765 | BI288055, NM_053995 | AA817846 | BDH | 3-Hydroxybutyrate dehydrogenase mitochondrial | Down | Down |
| 1371824 | AA891949 | AA891949 | Ak4 | Adenylate kinase 4 | Down | Down |
| 1369588, 1370350 | AF368860, NM_012915 | D13122 | IF1PA | ATPase inhibitor (mitochondrial IF1 protein) | Down | Down |
Probe sets regulated by MPL in rat liver after both acute and chronic drug administration and identified as nuclear-encoded mitochondrial genes. Affymetrix 230A arrays use a probe set number distinct from GenBank accession numbers, whereas U34A chips use a common probe set/GenBank accession number for identification.
The liver also is centrally involved in systemic lipid distribution and metabolism. We identified 21 genes associated with lipid metabolism (Table 8). The regulation of these genes may provide insight into the dyslipidemia caused by corticosteroids. For example, the up-regulation of apolipoprotein C-IV suggests the increased production of very-low-density lipoproteins. Very-low-density lipoproteins transport triacylglycerols from liver to extrahepatic tissues (32). Corticosteroids also influence the expression of 16 transporters (Table 9). Because many of these transporters are located on the sinusoidal membranes of hepatocytes, they may influence a variety of functions such as small molecule metabolism. For example, Slc22a7 is involved in the hepatic uptake of organic anions such as salicylate (33). The down-regulation of this gene could alter the metabolism of such drugs.
TABLE 8.
MPL-regulated probe sets related to lipid metabolism
| 230A probe set | 230A accession | U34A probe set/accession | Symbol | Identification | Response
|
|
|---|---|---|---|---|---|---|
| Acute | Chronic | |||||
| 1398272 | NM_022860 | D17809 | Galgt1 | (N-Acetylneuraminyl)-galactosylglucosylceramide N-acetylgalactosaminyltransferase | Up | Up |
| 1369656, 1389299 | M36071 | AA925887 | Pcyt1a | Phosphate cytidylyltransferase 1, choline, α (phosphatidylcholine synthesis) | Up | Up |
| 1368890 | NM_053410 | AA799779 (2) | Gnpat | Glyceronephosphate O-acyltransferase (bio-synthesis of ether phospholipids, peroxisomes) | Up | Up |
| 1384417 | AA998783 | AA945171 | Apoc4 | Apolipoprotein C-IV | Down | Up |
| 1369465 | NM_012584 | M67465 | Hsd3b | Steroid δ-isomerase, 3β (biosynthesis hormonal steroids) | Down | Up |
| 1368239 | NM_053541 | AB009463 | rLRp105 | Low-density lipoprotein receptor-related protein 3 | Down/up | Up |
| 1382680 | AA874941 | AA874941, AA893280 | ADRP | Adipose differentiation-related protein, | Down/up | Up |
| 1367662 | NM_031682 | AA945583 | Hsd17b10 | Hydroxyacyl-coenzyme A dehydrogenase type II (β-oxidation of fatty acids) | Down/up | Up |
| 1368232 | NM_031063 | AA924198, M29472 | Mvk | Mevalonate kinase, biosynthesis of cholesterol | Down/up | Down/up |
| 1387183 | J02844 | U26033, J02844 | CROT | Carnitine octanoyltransferase | Down | Down |
| 1370909, 1388153 | D90109, BI277523 | D90109, AI044900, AA893242 (2) | ACS COAA | Long-chain acyl-CoA synthetase | Down | Down |
| 1392604 | AA997187 | AA893032 | Nsdhl | NAD(P)-dependent steroid dehydrogenase-like | Down | Down |
| 1389906, 1367839 | AW530769 | H33426, M95591 | Fdft1 | Farnesyl diphosphate farnesyl transferase 1 | Down | Down |
| 1367668 | NM_031841 | AA875269 | SCD | Stearoyl-coenzyme A desaturase 2, δ-9-desaturase | Down | Down |
| 1387058 | NM_017225 | AF040261 | Pctp | Phosphatidylcholine transfer protein | Down | Down |
| 1388348, 1387630 | NM_134382 | AA892832 | ELO1 | ELOVL family member 5, elongation of long chain fatty acids | Down | Down |
| 1368075 | NM_012732 | AA874784, S81497 (2) | Lipa | Lysosomal acid lipase 1 | Down | Down |
| 1370024 | NM_030832 | U02096 | Fabp7 | Fatty acid binding protein 7 | Down | Down |
| 1370583, 1370465, 1370364, 1369161 | NM_012690 | L15079 | Abcb4 | ATP-binding cassette, sub-family B (MDR/TAP), member 4 | Down | Down |
| 1398310 | D17309 | S80431, D17309 | Akr1d1 | Aldo-keto reductase family 1, member D1 | Down/up | Down |
| 1386965 | NM_012598 | AI237731, L03294 | Lpl | Lipoprotein lipase | Up | Down |
Probe sets regulated by MPL in rat liver after both acute and chronic drug administration and categorized as relating to lipid metabolism. Affymetrix 230A arrays use a probe set number distinct from GenBank accession numbers, whereas U34A chips use a common probe set/GenBank accession number for identification.
TABLE 9.
MPL-regulated probe sets related to transport
| 230A probe set | 230A accession | U34A probe set/accession | Symbol | Identification | Response
|
|
|---|---|---|---|---|---|---|
| Acute | Chronic | |||||
| 1379739 | BF408431 | AA892414 | SLC4A7 | Solute carrier family 4, sodium bicarbonate co- transporter, member 7 | Up | Up |
| 1369460 | NM_022619 | U53927 | Slc7a2 | Solute carrier family 7 (cationic amino acid transporter, y+ system), member 2 | Up | Up |
| 1376267, 1390036 | AA859652 | AA859652 | Slc16a6, MCT6 | Monocarboxylate Transporter 6 | Up/down | Up |
| 1368600 | NM_022287 | L23413 | sat-1, Slc26a1 | Solute carrier family 26 (sulfate transporter), member 1 | Down | Up |
| 1398295 | NM_031684 | AF015304 | Slc29a1 | Equilibrative nucleoside transporter 1; ent1 | Down | Up |
| 1387228 | NM_012879 | NM_012879 | GLUT2 | Facilitated glucose transporter | Down | Up |
| 1387896, 1370296 | M62763 | M62763, M58287 | Scp2 | Nonspecific lipid transfer protein | Down | Up |
| 1368745 | NM_017222 | U07183 | Slc10a2 | Solute carrier family 10, member 2 (sodium/bile acid cotransporter family) | Up | Down |
| 1375823 | BF392130 | AF004017 | SLC4A4, NBC | Electrogenic Na+ bicarbonate cotransporter | Up/down | Down |
| 1392929 | BF416678 | AA800202 | Slc4A11 | Solute carrier family 4, sodium bicarbonate transporter-like, member 11 | Down | Down |
| 1371525 | BI277550 | AA799691 | KCC3 | Solute carrier family 12 (potassium/chloride transporters), member 7 | Down | Down |
| 1368047 | NM_022866 | AA892616 | Slc13a3 | Solute carrier family 13 (sodium-dependent dicarboxylate transporter), member 3 | Down | Down |
| 1398267 | NM_053537 | L27651 (2) | Slc22a7 | Solute carrier family 22 (organic anion transporter), member 7 | Down | Down |
| 1390416 | H35736 | AA892522 | Slc25a30, KMCP1 | Solute carrier family 25, member 30, mitochondrial carrier protein-1 | Down | Down |
| 1390412, 1376972, 1387130 | NM_133315 | U76714 (2) | Slc39a1 | Solute carrier family 39 (iron-regulated transporter), member 1 | Down | Down |
| 1368316 | NM_019158 | AB005547 | Aqp8 | Aquaporin 8 | Down | Down |
Probe sets regulated by MPL in rat liver after both acute and chronic drug administration and categorized as relating to transport. Affymetrix 230A arrays use a probe set number distinct from GenBank accession numbers, whereas U34A chips use a common probe set/GenBank accession number for identification.
The next 10 genes are grouped because they are involved in cellular fates, proliferation, differentiation, and apoptosis (Table 10). We have included ornithine decarboxylase 1 (Odc1) and ornithine decarboxylase antizyme inhibitor (oa-zin) because polyamines are important to cell proliferation. Odc, the first enzyme in polyamine synthesis, is regulated by a destabilizing antizyme that both inhibits its activity and accelerates it degradation. Oazin binds and traps the anti-zyme, thus promoting Odc activity (34, 35). The fact that both are up-regulated illustrates that corticosteroid treatment promotes polyamine synthesis in a coordinated fashion.
TABLE 10.
MPL-regulated probe sets related to cell fates
| 230A probe set | 230A accession | U34A probe set/accession | Symbol | Identification | Response
|
|
|---|---|---|---|---|---|---|
| Acute | Chronic | |||||
| 1374595, 1376999 | BF389721 | AA892570 | Tnks2 | Tankyrase, telomeric repeat-binding factor 1 | Up | Up |
| 1388953 | AA892598 | AA800679, AA892598 (2) | GNL3 | Guanine nucleotide binding protein-like 3 (nucleolar), stem cell proliferation | Up | Up |
| 1370163 | BF281299 | J04791 | Odc1 | Ornithine decarboxylase 1 | Up | Up |
| 1370575 | D50734 | AI043631 | Oazin | Ornithine decarboxylase antizyme inhibitor | Up | Up |
| 1370807 | AF411216 | AA859954 | Vacuole membrane protein 1 (apoptosis) | Up | Up | |
| 1367764 | NM_012923 | X70871 | Ccng1 | Cyclin G1 | Up | Up |
| 1388395 | AI406939 | AA893235 | GOS2 | G0/G1 switch gene 2 | Down/up | Up |
| 1367847 | NM_053611 | NM_053611 | Nupr1, p8 | Nuclear protein 1 (cell proliferation) | Down/up | Up |
| 1389179 | BF284899 | AA800243 | DFF | Cell death-inducing DNA fragmentation factor | Down/up | Up |
| 1371643 | AW143798 | X75207 | CCND1 | CCND1 gene; cyclin D1 | Down | Down |
| 1368311 | NM_012861 | M76704 | MGMT | O6-Methylguanine-DNA methyltransferase (DNA repair) | Down | Down |
| 1371684 | AA799330 | AA799330 | Pelota homolog (cell division) | Up | Down | |
Probe sets regulated by MPL in rat liver after both acute and chronic drug administration and categorized as relating to cell fates (proliferation, differentiation, or apoptosis). Affymetrix 230A arrays use a probe set number distinct from GenBank accession numbers, whereas U34A chips use a common probe set/GenBank accession number for identification.
The two profiles also identified 10 genes involved in carbohydrate metabolism (Table 11). Some of these genes are involved in both glycolysis and gluconeogenesis. For example, aldolase B is a reversible enzyme that is necessary for gluconeogenesis, so its up-regulation with chronic corticosteroid treatment is reasonable. In contrast, malic enzyme 1 catalyzes the decarboxylation of malate to form pyruvate and provides a link between glycolysis and the TCA cycle (36). The down-regulation of malic enzyme is consistent with the inactivation of the pyruvate dehydrogenase complex discussed above.
TABLE 11.
MPL-regulated probe sets related to carbohydrate metabolism
| 230A probe set | 230A accession | U34A probe set/accession | Symbol | Identification | Response
|
|
|---|---|---|---|---|---|---|
| Acute | Chronic | |||||
| 1386864, 1369473 | NM_053290 | AI169417, U20195 | Pgam1 | Phosphoglycerate mutase 1 (glycolytic) | Up | Up |
| 1387052 | NM_031039 | D10354 | Gpt | Glutamic pyruvic transaminase 1, soluble | Down/up | Up |
| 1369560, 1371363 | NM_022215 | AB002558 | Gpd3 | Glycerol-3-phosphate dehydrogenase 1 (soluble) | Down | Up |
| 1370299 | M10149 | AA892395 | Aldob | Aldolase B | Down | Up |
| 1369635 | NM_017052 | X74593, AI030175 | Sord | Sorbitol dehydrogenase | Down | Down |
| 1373337 | AI412065 | AA892799, AA892799, AA892799 | Glyoxylate reductase/hydroxypyruvate reductase | Down | Down | |
| 1370870, 1370067 | NM_012600 | AI171506, M26594, AI171506, AI008020 | Me1 | Malic enzyme 1 (cytosolic) | Down | Down |
| 1369954 | NM_031510 | AA892314 | IDH1 | Isocitrate dehydrogenase 1, soluble | Down | Down |
| 1370725, 1386944 | NM_013098 | L37333 | G6pc | Glucose-6-phosphatase, catalytic | Down | Down/up |
| 1387312 | NM_012565 | X53588 | Gck | Glucokinase | Down/up | Down/up |
Probe sets regulated by MPL in rat liver after both acute and chronic drug administration and categorized as relating to carbohydrate metabolism. Affymetrix 230A arrays use a probe set number distinct from GenBank accession numbers, whereas U34A chips use a common probe set/GenBank accession number for identification.
We found 19 genes whose expression was regulated but were difficult to put into the above categories and were characterized as other (Table 12). For the most part, these are genes involved in secretory functions of the liver. The accession numbers for every one of the identified probe sets on both chips were submitted to the NCBI Blast program. However, there still remained 16 probe sets that Blasted to the same sequence(s) but could not be identified (Table 13). We have maintained them because identification is an ongoing process.
TABLE 12.
Other MPL-regulated probe sets
| 230A probe set | 230A accession | U34A probe set/accession | Symbol | Identification | Response
|
|
|---|---|---|---|---|---|---|
| Acute | Chronic | |||||
| 1398784 | NM_019259 | AI178135 | C1qbp | C1q binding, inhibits C1 activation | Up | Up |
| 1367794 | NM_012488 | AA900582, M22670, M22670, AI113046 | A2m | α2-Macroglobulin | Up | Up |
| 1367801 | NM_053596 | D29683, AA956930 | Ece1 | Endothelin converting enzyme 1 | Up | Up |
| 1369065 | NM_017290 | J04024 | Atp2a2, Serca2 | ATPase, Ca2+ transporting | Up | Up |
| 1371345 | AI008699 | AI073164 | Scamp1 | Secretory carrier membrane protein | Up | Up |
| 1369982 | NM_031008 | AA800186 | Adaptor protein complex AP-2 | Up | Up | |
| 1386983 | NM_013168 | X06827 | PBGD | Hydroxymethylbilane synthase PBGD | Down/up | Up |
| 1368224 | NM_031531 | D00753 | Spin2c | Serine protease inhibitor | Down | Up |
| 1367647 | NM_022519 | X16273 | Serpina1 | Serine protease inhibitor α1 | Down | Up |
| 1387819 | NM_012552 | L00117 | Ela1 | Elastase 1, serine protease | Down | Up |
| 1371237 | AF411318 | AI102562 | Mt1a | Metallothionein 1 | Down | Up |
| 1387323 | NM_012725 | M30282 | Klk3 | Kallikrein B, plasma 1 | Down | Down |
| 1374524 | BM384384 | AA893080 | Selenocysteine lyase | Down | Down | |
| 1368322 | NM_012880 | Z24721 | ECSODPT | Superoxide dismutase 3 (secreted) | Down | Down |
| 1367720 | NM_012899 | AA800745 | Alad | Aminolevulinate, δ- dehydratase | Down | Down |
| 1367980 | NM_019124 | D85844 | RABPT5 | Rabaptin 5 | Down | Down |
| 1387146 | X57764 | S65355, AA818970 | Ednrb | Endothelin receptor type B | Up/down | Down |
| 1367800 | NM_013151 | M23697 | Plat | Plasminogen activator, tissue | Up/down | Down |
| 1370080 | NM_012580 | AI179610, J02722 | Hmox1 | Heme oxygenase (decycling) 1 | Up | Up/down |
Probe sets regulated by MPL in rat liver after both acute and chronic drug administration but uncategorized. Affymetrix 230A arrays use a probe set number distinct from GenBank accession numbers, whereas U34A chips use a common probe set/GenBank accession number for identification.
Discussion
This report describes the mining of a microarray dataset obtained from the analysis of livers from a population of adrenalectomized animals treated with a chronic infusion of MPL for up to 1 wk. Liver RNA from four control animals and four animals killed at each of 10 time points over a 168-h period were applied to individual Affymetrix R230A chips. The dataset was mined using a filtering approach similar to the one applied to datasets developed from the liver, skeletal muscle, and kidneys of animals treated with a single bolus dose of MPL where animals were killed at 16 time points after dosing and compared with untreated controls (6 – 8). This filtration approach does not select for probes but rather eliminates probe sets that do not meet explicit requirements. Those probe sets not eliminated are retained for analysis. The filtration yielded a remainder of 1989 probe sets for further consideration. These probe sets were compared with 1518 probe sets that remained after filtering of the dataset obtained after bolus dosing with MPL (6). This comparison yielded 464 probe sets in the bolus dosing dataset that corresponded to 417 probe sets in the chronic infusion dataset. The results identified 358 different genes regulated by both dosing regimens. Because the filtering process is quite stringent, these 358 genes most likely do not include all genes regulated by MPL in the tissue. However, they do provide a basis for evaluating the global effects of corticosteroids on the liver.
The objective of obtaining two time series profiles for each gene is to identify genes with common mechanisms of regulation. The hypothesis is that if two or more genes have a common mechanism of regulation then they should have the same temporal profile in response to all dosing regimens. There are available a variety of clustering methods designed to group genes based on their profiles. However, at present, there is no analytical method available to cluster using two profiles, bi-clustering. Our filtering approach crudely identifies genes that meet minimal criteria for up- and down-regulation based on deviation from baseline. In both the acute (bolus dose) and chronic (infusion) datasets, some profiles met both criteria, suggesting complex regulation. We visually inspected all profiles (464 acute and 417 chronic) and categorized each based on up or down deviation from baseline. In many cases, because of probe set redundancy, more than one profile was available for acute, chronic, or both. These instances are noted on the tables. With this information we proceeded to evaluate acute and chronic profiles together. Based solely on this crude classification, we identified four basic patterns. For more than 60% of the genes, the profile was either up or down in both the acute and chronic profiles. In the remaining cases, the profiles were complex involving both up- and down-regulation.
The value of expression profiling using a rich in vivo time course such as this, particularly when two different dosing regimens are examined, is that patterns of transcriptional changes become apparent. Examination of expression patterns, as illustrated by examples presented in Figs. 5– 8, indicate that our crude classification into four basic categories is too simplistic. Even when the more than 60% of the genes where the profiles from the two dosing regimens were either both up or down were examined, the mechanism of regulation is generally not straightforward. Single time point studies allow one to determine only magnitude of change at a single instant, which may not be indicative of either the actual extent or in some cases even the direction of change. This is particularly evident in cases of genes that express a biphasic pattern, where at different points in time the gene may show enhanced as opposed to reduced expression. Furthermore, temporal patterns may provide insight as to the mechanisms involved in regulation of transcriptional activity of a particular gene or genes.
The generally accepted mechanism for most glucocorticoid effects involves binding of free steroid to a cytoplasmically localized receptor, translocation of ligand-bound receptor to the nucleus, binding of a ligand receptor dimer to a specific DNA site [glucocorticoid response element (GRE)], and modulation of the amount of selective mRNAs (37). Although some effects on mRNA stability have been noted, a common mechanism involves increasing or decreasing the rate of transcription of particular genes. Previously, studying the enzyme TAT in liver and using both a repeated dosing and a chronic dosing paradigm, we described the phenomena of steroid tolerance (12, 13, 18). In those reports, we demonstrated that MPL treatment caused a rather long-lived down-regulation of the GR (mRNA and protein) and that when a second dose was administered before full recovery of receptor, the enhanced expression of TAT (mRNA and protein) was reduced proportional to the reduced concentration of receptor (18). In subsequent studies, we found that chronic infusion of MPL caused a sustained down-regulation of the receptor (mRNA and protein) and that the expression of TAT (mRNA and protein) returned back toward the baseline in the continuous presence of the drug (12, 13). If the receptor mediates the effect of the drug, then this is a rational result. Figure 5 (left) shows that the acute and chronic profiles of Odc1 come close to approximating those for TAT. Similarly, Fig. 6 (left) to some degree approximates this result for down-regulation. However, the major question posed by a perusal of the remaining profiles is: how can the drug continue to have sustained high-level effects when the receptor is greatly diminished to the point of almost being gone?
There are a number of possible explanations for more complex expression profiles that do not show tolerance. One rational possibility is that our concept of the structure and function of the GRE is entirely too simplistic. If multiple GREs with greatly different affinities for the drug receptor complex exist, then the type of result seen for Kclr in Fig. 6 (right) could be explained. A second and related possibility is that the GR is not a single entity. This possibility is supported by the recent report by Lu and Cidlowski (38), who showed the existence of multiple GR isoforms with different trafficking and transcriptional activities. It is possible that different isoforms may have different GRE binding affinities. Another possibility is that our concept that only the GR can mediate the effects of corticosteroids may be simplistic and that some other receptor can mediate the effects of these drugs. Alternatively, secondary or tertiary effects may involve glucocorticoid modulation of a secondary biosignal (which likely could be a different transcription factor) that in turn would modulate transcriptional activity. In addition, changes in the physiological states of the animal (such as altered glucose or lipid levels) with chronic treatment could also act as an additional biosignal that leads to secondary and tertiary changes in gene expression. This possibility is suggested by the chronic profile for Tdo seen in Fig. 5. Initially, it appears as if Tdo is going to respond with a pattern similar to Odc1 and return to baseline, but the expression is enhanced again to even a higher level that is maintained throughout the remainder of the infusion period. In any case, the results demonstrate that at present there is much we do not know about how corticosteroids influence gene expression.
We attempted to use domain knowledge to sort the 358 genes into groups, which are presented in Tables 1–13. In particular, Tables 1 and 2 demonstrate the broad impact these drugs have on transcription and translation as well as signaling. These results provide interesting examples of the type of physiological coordination that exists. Corticosteroids cause both insulin resistance and gluconeogenesis. The enhanced expression of Pdk along with the down-regulation of Pdp should maintain the pyruvate dehydrogenase complex in an inactive state, preventing pyruvate from entering the mitochondrial TCA cycle. The down-regulation of malic enzyme would also contribute to the cellular depletion of pyruvate. In contrast, the expression of aldolase B is enhanced, contributing to gluconeogenesis. Likewise, the down-regulation of complement protein C1q along with the enhanced expression of C1q binding protein demonstrates similar coordination, as does the enhanced expression of both Odc and Oazin.
Tables 1–13 present lists of genes regulated by both acute and chronic corticosteroid treatment. In these tables, we qualitatively list the response of each gene as down, up, down/up, or up/down to both acute and chronic treatments. We have not attempted to include a quantitative measure of magnitude of change for each gene in the two treatments. We feel that to choose a single time point to define a maximum or minimum would be potentially misleading, because it is the response pattern over time that is a true measure of magnitude of response. For example, one probe set response may show a sharp peak that rises and declines over a 4-h period, whereas a different gene may respond with a broader but shallower peak over an extended time range. In such a case, presenting magnitude of change at a single time is not a valid comparison of expression levels of the two. The situation becomes more complicated when one considers complex patterns of regulation (i.e. initial up-regulation followed by later down-regulation or vice versa).
All datasets described in this and related cited publications are available online in GEO. In addition, all data are available online at the Public Expression Profiling Resource site (http://pepr.cnmcresearch.org) developed and maintained by the Hoffman laboratory at Children’s National Medical Center (39). These data are available to all researchers in a user-friendly format, where individual temporal profiles are searchable, and all data can be obtained and used without requirement for any additional specialized software.
Acknowledgments
This dataset was developed at the Children’s National Medical Center under the auspices of a grant from the National Heart, Lung, and Blood Institute/National Institutes of Health Programs in Genomic Applications HL 66614 (Eric P. Hoffman, PI). This work was supported by GM 24211 and GM 67650 from the National Institute of General Medical Sciences, National Institutes of Health, Bethesda, MD.
Abbreviations
- GR
Glucocorticoid receptor
- GRE
glucocorticoid response element
- MPL
methylprednisolone
- TAT
tyrosine aminotransferase
- TCA
tricarboxylic acid
Footnotes
Disclosure Statement: The authors have nothing to disclose.
References
- 1.Bialis MC, Routledge PA. Adverse effects of corticosteroids. Adverse Drug React Toxicol Rev. 1998;17:227–235. [PubMed] [Google Scholar]
- 2.Frauman A. An overview of the adverse reactions to adrenal corticosteroids. Adverse Drug React Toxicol Rev. 1996;15:203–206. [PubMed] [Google Scholar]
- 3.Locsey L, Asztalos L, Kincses Z, Gyorfi F, Berczi C. Dyslipidaemia and hyperlipidaemia following renal transplantation. Int Urol Nephrol. 1996;28:419–430. doi: 10.1007/BF02550506. [DOI] [PubMed] [Google Scholar]
- 4.Reynolds RM, Walker BR. Human insulin resistance: the role of glucocorticoids. Diabetes Obes Metab. 2003;5:5–12. doi: 10.1046/j.1463-1326.2003.00221.x. [DOI] [PubMed] [Google Scholar]
- 5.Wald JA, Farr RS. Abnormal liver-function tests associated with long-term systemic corticosteroid use in subjects with asthma. J Allergy Clin Immunol. 1991;88:277–278. doi: 10.1016/0091-6749(91)90340-t. [DOI] [PubMed] [Google Scholar]
- 6.Almon RR, Dubois DC, Jin JY, Jusko WJ. Pharmacogenomic responses of rat liver to methylprednisolone: an approach to mining a rich microarray time series. AAPS J. 2005;7:E156–E194. doi: 10.1208/aapsj070117. [DOI] [PMC free article] [PubMed] [Google Scholar]
- 7.Almon RR, DuBois DC, Piel WH, Jusko WJ. The genomic response of skeletal muscle to methylprednisolone using microarrays: tailoring data mining to the structure of the pharmacogenomic time series. Pharmacogenomics. 2004;5:525–552. doi: 10.1517/14622416.5.5.525. [DOI] [PMC free article] [PubMed] [Google Scholar]
- 8.Almon RR, Lai W, DuBois DC, Jusko WJ. Corticosteroid-regulated genes in rat kidney: mining time series array data. Am J Physiol Endocrinol Metab. 2005;289:E870–E882. doi: 10.1152/ajpendo.00196.2005. [DOI] [PMC free article] [PubMed] [Google Scholar]
- 9.Friedman N, Kaminski N. Statistical methods for analyzing gene expression data for cancer research. Ernst Schering Res Found Workshop. 2002;38:109–131. doi: 10.1007/978-3-662-04747-7_6. [DOI] [PubMed] [Google Scholar]
- 10.Kaminski N. Microarray analysis of idiopathic pulmonary fibrosis. Am J Respir Cell Mol Biol. 2003;29:S32–S36. [PubMed] [Google Scholar]
- 11.Lock C, Hermans G, Pedotti R, Brendolan A, Schadt E, Garren H, Langer-Gould A, Strober S, Cannella B, Allard J, Klonowski P, Austin A, Lad N, Kaminski N, Galli SJ, Oksenberg JR, Raine CS, Heller R, Steinman L. Gene-microarray analysis of multiple sclerosis lesions yields new targets validated in autoimmune encephalomyelitis. Nat Med. 2002;8:500–508. doi: 10.1038/nm0502-500. [DOI] [PubMed] [Google Scholar]
- 12.Ramakrishnan R, DuBois DC, Almon RR, Pyszczynski NA, Jusko WJ. Fifth-generation model for corticosteroid pharmacodynamics: application to steady-state receptor down-regulation and enzyme induction patterns during seven-day continuous infusion of methylprednisolone in rats. J Pharmacokinet Pharmacodynam. 2002;29:1–24. doi: 10.1023/a:1015765201129. [DOI] [PMC free article] [PubMed] [Google Scholar]
- 13.Ramakrishnan R, DuBois DC, Almon RR, Pyszczynski NA, Jusko WJ. Pharmacodynamics and pharmacogenomics of methylprednisolone during 7-day infusions in rats. J Pharmacol Exp Ther. 2002;300:245–256. doi: 10.1124/jpet.300.1.245. [DOI] [PubMed] [Google Scholar]
- 14.Mavrothalassitis G, Tzimagiorgis G, Mitsialis A, Zannis V, Plaitakis A, Papamatheakis J, Moschonas N. Isolation and characterization of cDNA clones encoding human liver glutamate dehydrogenase: evidence for a small gene family. Proc Natl Acad Sci USA. 1988;85:3494–3498. doi: 10.1073/pnas.85.10.3494. [DOI] [PMC free article] [PubMed] [Google Scholar]
- 15.Sun YN, DuBois DC, Almon RR, Jusko WJ. Fourth-generation model for corticosteroid pharmacodynamics: a model for methylprednisolone effects on receptor/gene-mediated glucocorticoid receptor down-regulation and tyrosine aminotransferase induction in rat liver. J Pharmacokinet Biopharmaceut. 1998;26:289–317. doi: 10.1023/a:1023233409550. [DOI] [PubMed] [Google Scholar]
- 16.Jin JY, DuBois DC, Almon RR, Jusko WJ. Receptor/gene-mediated pharmacodynamic effects of methylprednisolone on phosphoenolpyruvate carboxykinase regulation in rat liver. J Pharmacol Exp Ther. 2004;309:328–339. doi: 10.1124/jpet.103.061515. [DOI] [PubMed] [Google Scholar]
- 17.Law GL, Itoh H, Law DJ, Mize GJ, Merchant JL, Morris DR. Transcription factor ZBP-89 regulates the activity of the ornithine decarboxylase promoter. J Biol Chem. 1998;273:19955–19964. doi: 10.1074/jbc.273.32.19955. [DOI] [PubMed] [Google Scholar]
- 18.Sun YN, DuBois DC, Almon RR, Pyszczynski NA, Jusko WJ. Dose-dependence and repeated-dose studies for receptor/gene-mediated pharmacodynamics of methylprednisolone on glucocorticoid receptor down-regulation and tyrosine aminotransferase induction in rat liver. J Pharmacokinet Biopharmaceut. 1998;26:619–648. doi: 10.1023/a:1020746822634. [DOI] [PubMed] [Google Scholar]
- 19.McKay LI, DuBois DC, Sun YN, Almon RR, Jusko WJ. Corticosteroid effects in skeletal muscle: gene induction/receptor autoregulation. Muscle Nerve. 1997;20:1318–13120. doi: 10.1002/(sici)1097-4598(199710)20:10<1318::aid-mus17>3.0.co;2-z. [DOI] [PubMed] [Google Scholar]
- 20.Comings DE, Muhleman D, Dietz G, Sherman M, Forest GL. Sequence of human tryptophan 2,3-dioxygenase (TDO2): presence of a glucocorticoid response-like element composed of a GTT repeat and an intronic CCCCT repeat. Genomics. 1995;29:390–396. doi: 10.1006/geno.1995.9990. [DOI] [PubMed] [Google Scholar]
- 21.Hu E, Liang P, Speigelman BM. AdipoQ is a novel adipose-specific gene dysregulated in obesity. J Biol Chem. 1996;271:10697–10703. doi: 10.1074/jbc.271.18.10697. [DOI] [PubMed] [Google Scholar]
- 22.Toth CA, Thomas P, Broitman SA, Zamcheck N. A new Kupffer cell receptor mediating plasma clearance of carcinoembryonic antigen by the rat. Biochem J. 1982;204:377–381. doi: 10.1042/bj2040377. [DOI] [PMC free article] [PubMed] [Google Scholar]
- 23.Zandbergen F, Mandard S, Escher P, Tan NS, Patsouris D, Jatkoe T, Rojas-Caro S, Madore S, Wahli W, Tafuri S, Muller M, Kersten S. The G0/G1 switch gene 2 is a novel PPAR target gene. Biochem J. 2005;392:313–324. doi: 10.1042/BJ20050636. [DOI] [PMC free article] [PubMed] [Google Scholar]
- 24.Takiguchi M, Haraguchi Y, Mori M. Human liver-type arginase gene: structure of the gene and analysis of the promoter region. Nucleic Acids Res. 1988;16:8789–8802. doi: 10.1093/nar/16.18.8789. [DOI] [PMC free article] [PubMed] [Google Scholar]
- 25.Wang H, Huang ZQ, Xia L, Feng Q, Erdjument-Bromage H, Strahl BD, Briggs SD, Allis CD, Wong J, Tempst P, Zhang Y. Methylation of histone H4 at arginine 3 facilitating transcriptional activation by nuclear hormone receptor. Science. 2001;293:853–857. doi: 10.1126/science.1060781. [DOI] [PubMed] [Google Scholar]
- 26.Seol W, Choi HS, Moore DD. An orphan nuclear hormone receptor that lacks a DNA binding domain and heterodimerizes with other receptors. Science. 1996;272:1336–1339. doi: 10.1126/science.272.5266.1336. [DOI] [PubMed] [Google Scholar]
- 27.Sellar GC, Cockburn D, Reid KB. Localization of the gene cluster encoding the A, B, and C chains of human C1q to 1p34.1–1p36.3. Immunogenetics. 1992;35:214–216. doi: 10.1007/BF00185116. [DOI] [PubMed] [Google Scholar]
- 28.Ghebrehiwet B, Lim BL, Peerschke EI, Willis AC, Reid KB. Isolation, cDNA cloning, and overexpression of a 33-kD cell surface glycoprotein that binds to the globular “heads” of C1q. J Exp Med. 1994;179:1809–1821. doi: 10.1084/jem.179.6.1809. [DOI] [PMC free article] [PubMed] [Google Scholar]
- 29.Fowlkes DM, Mullis NT, Comeau CM, Crabtree GR. Potential basis for regulation of the coordinately expressed fibrinogen genes: homology in the 5′ flanking regions. Proc Natl Acad Sci USA. 1984;81:2313–2316. doi: 10.1073/pnas.81.8.2313. [DOI] [PMC free article] [PubMed] [Google Scholar]
- 30.Hanson R, Reshef L. Regulation of phosphoenolpyruvate carboxykinase (GTP) gene expression. Annu Rev Biochem. 1997;66:581–611. doi: 10.1146/annurev.biochem.66.1.581. [DOI] [PubMed] [Google Scholar]
- 31.Sugden MC, Holness MJ. Therapeutic potential of the mammalian pyruvate dehydrogenase kinases in the prevention of hyperglycaemia. Curr Drug Targets Immune Endocr Metabol Disord. 2002;2:151–165. [PubMed] [Google Scholar]
- 32.Kamboh MI, Aston CE, Hamman RF. DNA sequence variation in human apolipoprotein C4 gene and its effect on plasma lipid profile. Atherosclerosis. 2000;152:193–201. doi: 10.1016/s0021-9150(99)00459-1. [DOI] [PubMed] [Google Scholar]
- 33.Sekine T, Cha SH, Tsuda M, Apiwattanakul N, Nakajima N, Kanai Y, Endou H. Identification of multispecific organic anion transporter 2 expressed predominantly in the liver. FEBS Lett. 1998;429:179–182. doi: 10.1016/s0014-5793(98)00585-7. [DOI] [PubMed] [Google Scholar]
- 34.Koguchi K, Kobayashi S, Hayashi T, Matsufuji S, Murakami Y, Hayashi S. Cloning and sequencing of a human cDNA encoding ornithine decarboxylase antizyme inhibitor. Biochim Biophys Acta. 1997;1353:209–216. doi: 10.1016/s0167-4781(97)00106-1. [DOI] [PubMed] [Google Scholar]
- 35.Koguchi K, Murakami Y, Hayashi S. Involvement of antizyme-like regulatory protein in polyamine-caused repression of ornithine decarboxylase in insect-derived Trichoplusia ni 5 cells. Biochim Biophys Acta. 1997;1357:291–296. doi: 10.1016/s0167-4889(97)00033-5. [DOI] [PubMed] [Google Scholar]
- 36.Granner D, Pilkis S. The genes of hepatic glucose metabolism. J Biol Chem. 1990;265:10173–10176. [PubMed] [Google Scholar]
- 37.Sun YN, McKay LI, DuBois DC, Jusko WJ, Almon RR. Pharmacokinetic/pharmacodynamic models for corticosteroid receptor down-regulation and glutamine synthetase induction in rat skeletal muscle by a receptor/gene-mediated mechanism. J Pharmacol Exp Ther. 1999;288:720–728. [PubMed] [Google Scholar]
- 38.Lu NZ, Cidlowski JA. Translational regulatory mechanisms generate N-terminal glucocorticoid receptor isoforms with unique transcriptional target genes. Mol Cell. 2005;18:331–342. doi: 10.1016/j.molcel.2005.03.025. [DOI] [PubMed] [Google Scholar]
- 39.Chen J, Zhao P, Massaro D, Clerch LB, Almon RR, DuBois DC, Jusko WJ, Hoffman EP. The PEPR GeneChip data warehouse, and implementation of a dynamic time series query tool (SGQT) with graphical interface. Nucleic Acids Res. 2004;32:D578–D581. doi: 10.1093/nar/gkh003. [DOI] [PMC free article] [PubMed] [Google Scholar]