

Significance
We tested the hypothesis that a form of mitochondrial dysfunction alters the homeostasis of the cytosolic Parkinson disease (PD)-associated protein α-synuclein (α-syn). Using yeast and worm models of PD, we show that low levels of phosphatidylethanolamine (PE), caused by the depletion of mitochondrial phosphatidylserine decarboxylase (psd), lead to decreased respiration, endoplasmic reticulum (ER) stress, high levels of α-syn and cytoplasmic α-syn foci, and slow growth. Ethanolamine, which replenishes PE through the Kennedy pathway, diminished ER stress, decreased the level of α-syn, eliminated foci, and restored growth of psd1Δ cells to near wild-type levels. A low level of mitochondrial PE disrupts the homeostasis of α-syn and leads to the accumulation of cytoplasmic foci of this protein.
Keywords: aging, lipid disequilibrium, proteinopathy
Abstract
Phosphatidylserine decarboxylase, which is embedded in the inner mitochondrial membrane, synthesizes phosphatidylethanolamine (PE) and, in some cells, synthesizes the majority of this important phospholipid. Normal levels of PE can decline with age in the brain. Here we used yeast and worms to test the hypothesis that low levels of PE alter the homeostasis of the Parkinson disease-associated protein α-synuclein (α-syn). In yeast, low levels of PE in the phosphatidylserine decarboxylase deletion mutant (psd1Δ) cause decreased respiration, endoplasmic reticulum (ER) stress, a defect in the trafficking of the uracil permease, α-syn accumulation and foci, and a slow growth phenotype. Supplemental ethanolamine (ETA), which can be converted to PE via the Kennedy pathway enzymes in the ER, had no effect on respiration, whereas, in contrast, this metabolite partially eliminated ER stress, decreased α-syn foci formation, and restored growth close to that of wild-type cells. In Caenorhabditis elegans, RNAi depletion of phosphatidylserine decarboxylase in dopaminergic neurons expressing α-syn accelerates neurodegeneration, which supplemental ETA rescues. ETA fails to rescue this degeneration in worms that undergo double RNAi depletion of phosphatidylserine decarboxylase (psd-1) and choline/ETA phosphotransferase (cept-1), which encodes the last enzyme in the CDP–ETA Kennedy pathway. This finding suggests that ETA exerts its protective effect by boosting PE through the Kennedy pathway. Overall, a low level of PE causes ER stress, disrupts vesicle trafficking, and causes α-syn to accumulate; such cells likely die from a combination of ER stress and excessive accumulation of α-syn.
Parkinson disease occurs as a result of the progressive loss of dopaminergic neurons in the midbrain region called the substantia nigra pars compacta (1). A hallmark of the disease is the formation of cytoplasmic inclusions (termed Lewy bodies) in the affected neurons. A leap forward in this field came from the discoveries that the principal component of Lewy bodies is the protein α-synuclein (α-syn) (2) and that mutations (3) and multiplications (4) of the α-syn locus cause familial, early-onset forms of Parkinson disease. These findings have led to intense investigations meant to elucidate the mechanism by which α-syn triggers the selective death of dopaminergic neurons.
α-syn is most abundant in dopaminergic neurons, where it is thought to regulate neurotransmitter vesicle fusion at the presynaptic membrane (5). Localization of α-syn at the presynaptic membrane depends on its association with detergent-resistant membrane microdomains called lipid rafts (6). Our interest is in the mechanism by which α-syn is recruited into lipid rafts. Lipid rafts, which are enriched with cholesterol, sphingolipids, and proteins such as receptors and glycosylphosphatidylinositol (GPI)-anchored proteins, are distributed throughout the plasma membrane, where they serve as platforms for signal transduction and vesicle trafficking (7). In neurons, most of the neurotransmitter receptors reside in lipid rafts (8). Lipid rafts are also involved in membrane traffic (9). Studies have shown that lipid rafts, along with raft proteins, associate in the endoplasmic reticulum (ER) in yeast and in the Golgi apparatus in mammalian cells, and then are transported to the plasma membrane (10). GPI-anchored proteins play a critical role in recruiting certain proteins into rafts. α-syn associates with lipid rafts and traffics through the secretory pathway to the plasma membrane in both yeast and human cells (6, 11, 12).
A common posttranslational modification, the GPI anchor enables a modified protein to be tethered via its C terminus to the outer leaflet of the plasma membrane (13). A GPI anchor consists of a phosphoethanolamine linker, a glycan core, and a phospholipid tail (14). During processing of nascent GPI-anchored proteins in the ER, phosphoethanolamine groups, donated by phosphatidylethanolamine (PE), are attached to the mannoses of the glycan core (15, 16). Although GPI-anchored proteins are functionally and structurally diverse, a common feature is that they associate with lipid rafts (10).
Two major pathways synthesize PE in eukaryotic cells. Phosphatidylserine (PS) decarboxylase (Psd) (17), which is lodged in the inner mitochondrial membrane, converts PS to PE, whereas the Kennedy pathway enzymes, which are located in the ER, condense ethanolamine (ETA) and diacylglycerol to PE when ETA is available (Fig. 1A). Depending on the type of cell, Psd may synthesize most of the cellular PE; for example, Psd1 synthesizes ∼50% of the total cellular PE in budding yeast (16). PE is thought to transfer from mitochondria into the ER via mitochondrial-associated membranes (18).
Fig. 1.

α-syn forms foci and is toxic to psd1Δ cells. (A) Scheme for PE synthesis in mitochondrion and ER. CDP, cytidine diphosphate; Cho, choline; p-ETA/p-Cho, phosphorylated ETA/choline; PM, plasma membrane. (B) α-syn–GFP forms foci in psd1Δ cells. Yeast cells transformed with indicated plasmids were induced for 5 h in mixed medium (1% Suc/1% Gal) at 30 °C and then imaged using fluorescence microscopy. ETA (5 mM) was used for the rescue. (Scale bar, 5 μm.) (C) Growth assay (liquid medium). psd1Δ cells (±α-syn) were grown in liquid mixed medium with or without added ETA (5 mM), and the optical density was monitored at 600 nm. (D) PE/PC ratio in psd1Δ cells with indicated conditions normalized to the PE/PC ratio of wild-type (WT) cells (medium, mixed). Values are means ± SD (n = 3). **P < 0.002 determined using one-way ANOVA, Dunnett post hoc test. (E) Western blots of α-syn in indicated cells. Lysates were prepared after a 5-h induction time and then subjected to SDS/PAGE and Western blotting. Pgk1 is the loading control. (F) α-syn accumulates in psd1Δ cells. The plot shows the fold increase in α-syn expression in the indicated cells ± ETA (5 mM) (Materials and Methods). Values are means ± SD (n = 3). ***P < 0.0002 determined using one-way ANOVA, Dunnett post hoc test. (G) Growth assay (plates). α-syn is toxic to psd1Δ cells but not to wild-type cells; the toxicity is suppressed by adding ETA (5 mM). Strains were serially diluted into the indicated medium and imaged after a 3-d incubation at 30 °C. Glu, glucose. Mix, 1% Suc/1% Gal. (H and I) Growth assay (liquid medium). psd1Δ cells (±α-syn) were grown in liquid mixed medium with or without added ETA (5 mM), and the optical density was monitored at 600 nm. Plot of doubling time for cells cultured in mixed medium (H) or 2% (wt/vol) Gal medium (I). Horizontal line is the doubling time of wild-type cells (vector, –ETA). Values are means ± SD (n = 3). ***P < 0.0001 determined using one-way ANOVA, Tukey post hoc test.
We show here that a deficiency of PE from knocking out the gene coding for mitochondrial PSd1 causes ER stress, α-syn foci, vesicle trafficking defects, and cell death. ETA, which can be converted to PE via the Kennedy pathway, rescues most of the effects of low levels of PE. These data extend to metazoans, as we demonstrate that ETA attenuates dopaminergic neurodegeneration in a Caenorhabditis elegans model of Parkinson disease. Collectively, we present a functional paradigm whereby cellular regulators of lipid content and vesicle trafficking interface with a key neurodegenerative factor, α-syn, to impact cytotoxicity.
Results
Deletion of Mitochondrial PSD1 Produces Multiple Cellular Defects; α-Syn Homeostasis Is Disrupted.
Saccharomyces cerevisiae cells, which do not express an ortholog of α-syn, were transformed with a plasmid that contained human α-syn or human α-syn tagged at its C terminus with the green fluorescent protein (α-syn–GFP) under control of a galactose (Gal)-inducible promoter. Unless otherwise noted, cells were cultured in synthetic complete (SC) dropout medium supplemented with 1% sucrose and 1% Gal (SC–Suc/Gal), which yielded moderate expression of α-syn.
We found that whereas wild-type yeast cells display α-syn–GFP around the perimeter of cells, consistent with an association with the plasma membrane, identically treated psd1Δ cells primarily display cytoplasmic α-syn–GFP foci (Fig. 1B). The foci are not due to the binding of α-syn–GFP to or colocalizing with mitochondria, lipid droplets, or peroxisomes (Fig. S1). Because yeast cells can use ETA to synthesize PE via the Kennedy pathway (19) (Fig. 1A), we hypothesized that exogenous ETA would increase the level of PE (see Lipid Content, α-Syn Expression, Growth, and Mitochondrial Functions of psd1Δ.) and thus block the formation of α-syn foci in psd1Δ cells. After a 5-h induction with added ETA (5 mM), psd1Δ cells expressing α-syn–GFP were indistinguishable from wild-type cells (Fig. 1B). A potential confounding element to this analysis is that ETA could have a general effect on cell growth (Fig. 1C) separate from its ability to replenish low PE due to Psd1 deletion. Because after 5 h of induction the growth curve of psd1Δ+α-syn cells is nearly the same as the growth curve of psd1Δ+α-syn+ETA (Fig. 1C), we suggest that α-syn–GFP foci formation is unrelated to a growth effect; instead, foci formation is a consequence of low PE in psd1Δ cells (see Lipid Content, α-Syn Expression, Growth, and Mitochondrial Functions of psd1Δ.). All of the experiments in this study were conducted at 5 h of incubation. If ETA is added several hours after the start of induction—that is, to cells with preformed α-syn–GFP foci—most foci disappear and growth is restored (Fig. S2 and Discussion, α-Syn Accumulates in psd1Δ Cells).
Lipid Content, α-Syn Expression, Growth, and Mitochondrial Functions of psd1Δ.
Using TLC, we found that the PE/phosphatidylcholine (PC) ratio is lower (by 65%) in psd1Δ cells (+α-syn/–ETA) compared with wild-type cells (+α-syn/–ETA) (Fig. 1D), and added ETA increased the PE/PC ratio close to that of wild-type cells (+α-syn/–ETA) (Fig. 1D and Fig. S3). α-syn was expressed in the various strains (Fig. 1E), although its level was threefold higher in psd1Δ than in wild-type cells (P < 0.0002, one-way ANOVA) (Fig. 1F). Added ETA decreased α-syn in psd1Δ cells (to near the level in wild-type cells) [Fig. 1F; compare psd1Δ(+α-syn/±ETA) to WT(+α-syn/+ETA)]. Our findings agree with those of Voelker and coworkers, who found that psd1Δ cells have 70% less PE than control wild-type cells and that added ETA substantially increases PE in psd1Δ cells (20).
The effect of low PE and α-syn expression on cell growth was evaluated using two assays. First, on solid plates, wild-type cells expressing α-syn grow at the same rate as cells without α-syn (Fig. 1G; compare rows 1 and 2, Center). In contrast, psd1Δ cells expressing α-syn grow much slower than cells with empty vector (EV) (compare rows 3 and 4, Center). We also tested whether ETA would rescue the severe slow growth phenotype of psd1Δ+α-syn cells; ETA indeed rescued the growth defect (compare row 4 of Center and Right). ETA also rescued the slow growth phenotype of psd1Δ+vector (compare row 3 of Center and Right). Second, we also conducted a complementary growth analysis of psd1Δ cells cultured in liquid medium (Fig. 1 H and I). Mixed medium and 2% (wt/vol) Gal medium were tested, which give moderate and high α-syn expression, respectively. In mixed medium, psd1Δ-vector and psd1Δ+α-syn cells exhibited doubling times of 2.69 ± 0.04 h and 3.08 ± 0.06 h, respectively (Fig. 1H). In mixed medium supplemented with ETA (5 mM), the doubling time of psd1Δ cells, with or without α-syn, decreased to 2.24 ± 0.03 h (+ETA). Under identical conditions, wild-type cells doubled at 1.8 h, as indicated by the horizontal line in the plot. Overall, low PE induces a slow growth phenotype in psd1Δ cells, which is exacerbated by α-syn expression, and added ETA partially rescues the slow growth phenotype—that is, the doubling time of psd1Δ(±α-syn; +ETA) cells was always longer than that of wild-type cells. Similar results were obtained in the 2% (wt/vol) Gal medium (Fig. 1I), although in 2% Gal medium, which yields higher expression of α-syn, α-syn was extremely toxic to psd1Δ cells, as judged by the twofold increase in the doubling time compared with vector control cells (Fig. 1I; –ETA). ETA (5 mM) rescued the slow growth [13.5 ± 0.5 h (–ETA) → 4.0 ± 0.4 h (+ETA)].
Knocking out PSD1 disrupts both mitochondrial and extramitochondrial functions (16, 21, 22), which is consistent with the deletion of PSD1 decreasing the level of PE in mitochondria and extramitochondrial compartments. Similar to a recent study (21), we found that low PE inhibits respiration and causes mitochondrial fragmentation in psd1Δ cells, but adding ETA fails to prevent either of these defects (Figs. S1 and S4 and SI Text). In contrast, ETA rescues multiple extramitochondrial functions, including α-syn–GFP foci formation and stress in the ER (SI Text). These combined data show that the cooccurrence of low PE (psd1Δ) and α-syn yield a synthetic sick phenotype, and that added ETA restores the level of PE and partially rescues the synthetic sick phenotype (Fig. 1, Figs. S1–S6, and SI Text).
α-Syn Accumulates in the ER in psd1Δ Cells.
To probe the role by which PE facilitates the transit of α-syn through the ER, we transformed cells with one plasmid that harbored α-syn–GFP and another plasmid that harbored the red fluorescent protein (RFP) with a C-terminal ER retention sequence composed of the tetrapeptide histidine–aspartic acid–glutamic acid–leucine (HDEL) and then monitored the localization of the two proteins using fluorescence microscopy. In wild-type cells, α-syn–GFP localized to the plasma membrane, and the RFP–HDEL protein localized to an internal compartment (Fig. 2A, Top), which we attribute to the ER. α-syn–GFP is not retained in the ER. In psd1Δ cells, α-syn–GFP clustered in one or more bright green cytoplasmic foci, some of which overlap with the bright red fluorescence due to RFP–HDEL (Fig. 2A, Center). At a higher expression level [2% (wt/vol) Gal], α-syn–GFP is retained in the ER in wild-type cells (Fig. 2A, Bottom).
Fig. 2.

PC and PE, and not ER stress, control α-syn foci formation. (A) α-syn is trapped in the ER when levels of PE are low or those of protein are high. psd1Δ and wild-type cells, transformed with plasmids (pAG426–α-syn–GFP and pRS315–RFP–HDEL), were induced for 5 h in the indicated media and then imaged using fluorescence microscopy. (Scale bar, 5 μm.) (B) Low PE levels induce ER stress. β-gal activity of cells transformed with pAG425–α-syn plasmid and pMCZ-Y plasmid (UPRE–lacZ) induced for 5 h. Values are means ± SD (n = 3). **P < 0.002 and ***P < 0.0007 were determined using one-way ANOVA with Dunnet post hoc test. (C) α-syn foci formation. The indicated strains were transformed with pAG426–α-syn–GFP, pregrown in SC–Ura Suc, diluted into SC–Ura mixed medium (±5 mM ETA or choline), grown for 5 h at 30 °C, and then imaged using fluorescence microscopy. (Scale bar, 5 μm.) (D) Plot of ER stress versus PE% composition. ER stress test of lipid metabolism mutants. β-gal activity of cells transformed with pAG425–α-syn plasmid and pMCZ-Y plasmid (UPRE–lacZ) induced for 5 h. PE amount was determined as described in E. Points are means ± SD (n = 3 for ER stress; n = 3 for PE%). (E) PC and PE content in lipid metabolism mutants expressing α-syn. Total lipids were chemically extracted from each strain and analyzed using TLC. Green indicates strains in which α-syn is soluble; red indicates strains in which α-syn forms foci. Points are means ± SD (n = 3 for PC%; n = 3 for PE%). Best fit line through cho1Δ, psd1Δ, ino2Δ, and cho2Δ is PC% = –1.38 PE% + 23.72% (R2 = 0.955).
Because α-syn is retained in the ER in psd1Δ cells, we tested whether this retention induces ER stress. ER stress was assessed using the reporter plasmid pMCZ-Y (23), which contained bacterial lacZ gene driven by the CYC1 (cytochrome c, isoform 1) promoter under the control of the unfolded protein-response element (UPRE) from KAR2 (UPRE–lacZ). Kar2, which is an Hsp70 chaperone equivalent to BiP in mammalian cells, regulates the unfolded protein response in yeast cells. Kar2 expression is induced by ER stress; thus, in this assay, LacZ activity is proportional to ER stress. Wild-type cells (with or without α-syn) exhibited a basal level of ER stress of 50 nmol/min/mg of β-gal activity (Fig. 2B). In contrast, psd1Δ cells exhibited 587% more ER stress than wild-type cells, and no further increase occurred when the cells expressed α-syn. ETA treatment, which partially replenished the level of PE (Fig. 1D), decreased ER stress by 53–60% in psd1Δ cells (P < 0.002, one-way ANOVA) (Fig. 2B).
To gain insight into the factors that govern the formation of α-syn foci, we tested other lipid metabolism mutants (cho1Δ, cho2Δ, opi3Δ, and ino2Δ) for α-syn foci, ER stress, and PC+PE content. Cho1, which is the only PS synthase in yeast, catalyzes the reaction of CDP–diaclyglycerol and l-serine to yield PS, which is the substrate for Psd. Cho2 and Opi3 are methyltransferases. Cho2 catalyzes the first methylation of PE, whereas Opi3 catalyzes the second and third methylations to yield PC. Deletion of OPI3 enhances the toxicity of α-syn (24). Ino2 is a transcription factor that regulates phospholipid biosynthesis.
α-syn–GFP formed foci in cho1Δ, cho2Δ, ino2Δ, opi3Δ, and psd1Δ cells, but not in wild-type cells or in psd1Δ cells treated with ETA or choline (Fig. 2C). ER stress and PE% (but not PC%) are inversely related. No appreciable ER stress occurred when levels of PE equaled 10% of total phospholipids, whereas ER stress increased dramatically (by 1900%) when PE levels decreased from 10% to 2% (Fig. 2D). Because α-syn formed foci in each of the five mutants, but only three of the mutants exhibited stress, ER stress is not sufficient to induce the formation of α-syn foci. The plot of PC% versus PE% shows four mutants (cho1Δ, psd1Δ, ino2Δ, and cho2Δ) with PC and PE values on the best fit line (PC% = –1.38 PE% + 23.7%), whereas opi3Δ falls below this line (Fig. 2E). α-syn formed foci in each of these five mutants, but failed to form foci in strains with PC and PE values above this line. The three samples above the best fit line are wild-type cells expressing α-syn and psd1Δ cells expressing α-syn treated with ETA or choline. The best fit line through the PC/PE space separates soluble and insoluble phases of α-syn.
Low PE Levels Disrupt the Trafficking of the Raft-Associated Protein to the Plasma Membrane.
Given that GPI-anchored proteins recruit permeases such as Tat2 and Fur4 into lipid raft microdomains (25) and that low PE levels retard the maturation of GPI-anchored proteins (16), we hypothesized that low levels of PE would block ER-to-Golgi apparatus transport of the uracil permease Fur4 and α-syn in psd1Δ cells and lead to foci formation. A schematic of a GPI-anchored protein is shown in Fig. 3A.
Fig. 3.

Low PE causes protein trafficking problems. (A) A GPI-anchored protein. Gluc, glucosamine; In, inositol; P, phosphate; PM, plasma membrane. (B) α-syn colocalizes with Fur4. The fluorescence images were taken from the transformants induced to express α-syn–RFP and Fur4–EGFP in the mixed medium for 5 h. (C) psd1Δ is less sensitive to 5-FOA than wild-type cells. Wild-type and psd1Δ cells transformed with pAG426 EV were grown to the exponential phase and then serially diluted in successive 10-fold dilutions and spotted onto indicated plates (±5-FOA), which were incubated for 3 d at 30 °C. (D) α-syn–GFP forms foci in gpi7Δ mutant cells and myriocin-treated wild-type cells. For myriocin treatment, cells were induced for 5 h in mixed medium containing 2 µM myriocin. Fluorescence images were obtained after 5 h of induction at 30 °C.
To test this hypothesis, we monitored the localization of Fur4–EGFP and α-syn–RFP in cells transformed with two plasmids using fluorescence microscopy. Wild-type cells, when grown in SC–Ura medium, exhibited Fur4–EGFP at very low levels on the plasma membrane and at higher levels clustered inside cells (Fig. 3B, Upper). In these cells, α-syn–RFP decorated the plasma membrane. In contrast, Fur4–EGFP and α-syn–RFP were diffusely distributed in psd1Δ cells, and from the merged image the two proteins appear to colocalize (Fig. 3B, Lower). The images show that Fur4–EGFP and α-syn–RFP cluster together in psd1Δ cells.
Yeast cells take up the compound 5-fluoroorotic acid (5-FOA) via the Fur4 permease (26). Inside cells, 5-FOA is converted into the toxin 5-fluorouracil. If low PE levels decrease the amount of Fur4 on the plasma membrane, psd1Δ cells should take up less 5-FOA than wild-type cells. Using a growth assay to assess sensitivity to 5-FOA, we found that wild-type cells with empty vector (EV) (URA3 marker) failed to grow on plates supplemented with 5-FOA (0.06%), whereas psd1Δ cells with EV formed colonies at two dilutions (Fig. 3C). These data are consistent with less Fur4 in the plasma membrane of psd1Δ cells than in wild-type cells.
Given that GPI-anchored proteins recruit permeases and α-syn into lipid raft microdomains, defects in the synthesis of GPI anchors or sphingolipids should phenocopy low PE levels and cause the formation of α-syn foci. To test this idea, we surveyed selected mutants defective in the synthesis of GPI anchors for the formation of α-syn foci and found that α-syn forms foci in gpi7Δ cells (Fig. 3D). Gpi7 is an integral membrane transferase located in the ER and plasma membrane that attaches phosphoethanolamine to the second mannose of the GPI core glycan structure (27). The failure to attach phosphoethanolamine to the second mannose of GPI anchors perturbs the vesicular trafficking of α-syn. Myriocin, which inhibits serine palmitoyl transferase, is widely used to disrupt sphingolipid synthesis. We previously showed that myriocin induces α-syn foci when α-syn is expressed at high levels [2% (wt/vol) Gal] (28). Here we confirm that myriocin triggers the formation of α-syn foci in wild-type cells cultured in the low expression mixed medium (Fig. 3D).
Low Levels of PE Induce Cell Wall Stress.
Because mutants of gpi7 have cell separation defects (29), which are characterized by an abnormal three-cell arrangement in which the mother cell is attached to two daughter cells, we sought to determine whether psd1Δ cells have a similar morphology. Using transmission electron microscopy, we found that psd1Δ cells with EV displayed a normal morphology, indistinguishable from that of wild-type cells (Fig. 4A). In contrast, expression of α-syn in psd1Δ (but not wild-type) cells reproducibly displayed an abnormal three-cell arrangement in 10% of the cells (Fig. 4A). We next tested whether a PE deficiency activates the cell wall integrity (CWI) pathway, as does gpi7Δ (29), using a reporter plasmid in which the bacterial lacZ gene is controlled by the Rlm1-regulated promoter of PRM5 (PPRM5::lacZ) (30). Prm5 is induced in response to activation of the CWI pathway. Without α-syn expression, psd1Δ cells displayed 309% more cell wall stress than wild-type cells (Fig. 4B). α-syn decreased the amount of stress in wild-type and mutant cells (P < 0.002, one-way ANOVA). Low PE levels trigger cell wall stress, activating this stress response to repair cell wall defects. Because α-syn partially inhibits the activation of this pathway (31), cell wall defects worsen and yield the unusual cell separation defect in a subpopulation of cells.
Fig. 4.
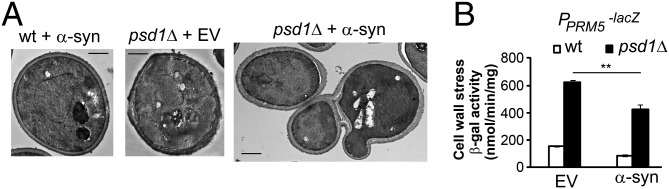
Low PE levels cause cell wall stress. (A) α-syn expression causes the abnormal three-cell arrangement phenotype in psd1Δ. EM images were taken from wild-type and psd1Δ cells harboring blank vector or pAG426–α-syn after 5 h of induction. (Scale bar, 1 μm.) (B) β-galactosidase activity. Cells, transformed with pAG425/pAG425-α-syn and 1366 plasmids, were induced for 5 h, and then lysates were prepared. Values are means ± SD (n = 3). **P < 0.002 was determined by one-way ANOVA with Dunnett post hoc test.
α-Syn–Induced Dopaminergic Neurodegeneration Is Enhanced upon Depletion of psd-1 in C. elegans.
To validate findings from yeast, we used a C. elegans model of neurodegeneration to test whether knocking down psd-1, which encodes Psd, enhances the toxicity of α-syn. Expression of the wild-type (nonmutated) human α-syn cDNA under control of a dopamine transporter-specific promoter [Pdat-1::α-syn+Pdat-1::GFP] results in age- and dose-dependent neurodegeneration (32, 33). Compared with worms expressing GFP alone, which almost never exhibit dopaminergic neuron degeneration (Fig. 5A), worms expressing α-syn displayed a reproducible loss of dopaminergic neurons as they aged (Fig. 5B). Until recently, dopaminergic neurons in C. elegans have been found to be recalcitrant to RNAi. However, there are now methods available that enable neuronal-sensitive RNAi (34). These methods have been adapted for selective RNAi in our Pdat-1::α-syn+Pdat-1::GFP strain whereby the impact of RNAi knockdown targeting gene candidates can be selectively examined exclusively in the dopaminergic neurons {UA196 [sid-1(pk3321); Pdat-1::α-syn, Pdat-1::GFP; Pdat-1::sid-1, Pmyo-2::mCherry]}. As a control, RNAi-selective worms expressing GFP, but not α-syn, in the dopaminergic neurons were also constructed {UA202 [sid-1(pk3321); Pdat-1::GFP; Pdat-1::sid-1, Pmyo-2::mCherry]} (35, 36).
Fig. 5.

Depletion of psd-1 in C. elegans dopaminergic neurons enhances dopaminergic degeneration in the presence of α-syn. (A–D) Representative images of dopaminergic neurons. Arrowheads show intact dopaminergic neuron cell bodies. Arrows indicate areas where dopaminergic neurons have degenerated. Pdat-1::GFP indicates C. elegans strain UA202 [sid-1(pk3321); Pdat-1::GFP; Pdat-1::sid-1, Pmyo-2::mCherry], and Pdat-1::GFP+Pdat-1::α-syn indicates C. elegans strain UA196 [sid-1(pk3321); Pdat-1::α-syn, Pdat-1::GFP; Pdat-1::sid-1, and Pmyo-2::mCherry]. (A) Control (GFP only) animal; all six anterior dopaminergic neurons were intact following EV RNAi. (B) An example of baseline dopaminergic neuronal toxicity in an animal expressing α-syn; this worm was treated with EV RNAi. Five of the six dopaminergic neurons remain. (C) Enhanced neurodegeneration in dopaminergic neurons in α-syn–expressing animals is observed following psd-1 RNAi; only three dopaminergic neurons remain in this representative animal. (D) Knockdown of psd-1 does not cause neurodegeneration when α-syn is absent. In this example, all six anterior dopaminergic neurons were intact following psd-1 (RNAi) in the control (GFP only) strain. (E) RNAi knockdown of candidate genes occurs selectively in the dopaminergic neurons of worms expressing α-syn (strain UA196). After synchronizing, worms were analyzed at days 6 and 7 posthatching. RNAi bacteria, which do not express an RNAi clone (EV) or the vps-41 RNAi clone, were used as negative and positive controls, respectively. A worm was scored as normal when it had a full complement of six anterior dopaminergic neurons. Data are reported as the mean ± SD, n = 90 worms. ****P < 0.0001, one-way ANOVA.
Using these dopaminergic-specific RNAi strains of C. elegans, we knocked down psd-1 and analyzed dopaminergic neurodegeneration in worm populations (Fig. 5 C–E). Worms treated with EV RNAi (negative control) or vps-41 dsRNA (positive control) were also examined. Observing dopaminergic neurodegeneration following depletion of vps-41 confirms this methodology because VPS-41 is involved in lysosomal protein trafficking and is an established modifier of α-syn accumulation and dopaminergic neurodegeneration (35).
When α-syn is expressed in dopaminergic neurons of C. elegans, the six dopaminergic neurons within the anterior region of the worm display progressive degenerative characteristics (Fig. 5 A vs. B). Cell bodies as well as the neuronal processes of worms at days 6 and 7 posthatching were assessed to determine whether these structures were normal or displayed degenerative changes (Fig. 5E). A total of 30 worms, in triplicate, were analyzed per RNAi condition, for a total of 90 worms per gene knockdown condition. Data were scored and reported based on neuronal degeneration occurring in worm populations.
We found that only 37% of the population of worms expressing α-syn in the dopaminergic neurons had all six anterior dopaminergic neurons intact at day 6 and that this percentage dropped to 24% at day 7 (Fig. 5 B and E; EV RNAi). In contrast, exposure of C. elegans to vps-41 or psd-1 dsRNA led to significantly fewer animals in the population with a full complement of normal dopaminergic neurons (Fig. 5E; P < 0.0001, one-way ANOVA). Specifically, at day 6, only 16% and 12% of α-syn–expressing worms exhibited normal dopaminergic neurons following depletion of vps-41 and psd-1, respectively, whereas 37% of α-syn–expressing, EV control worms exhibited normal dopaminergic neurons. At day 7, only 10% and 8% of the vps-41–depleted and psd-1–depleted worms, respectively, displayed normal neurons compared with 24% of the EV controls (Fig. 5 C–E).
To determine whether the effects of psd-1 depletion depend on α-syn, we performed an additional control experiment using a companion, neuronal-sensitive RNAi strain that does not express α-syn. These animals, which express GFP (only) in dopaminergic neurons, rarely show degeneration with age (Fig. 5A). When exposed to dsRNA EV, 96% and 92% of the population displayed normal dopaminergic neurons at days 6 and 7 of development, respectively (Fig. 5A). Furthermore, knockdown of the candidate genes did not affect dopaminergic neuron survival at days 6 and 7 of development when α-syn was absent. Depletion of psd-1 resulted in 97% and 96% of the population of C. elegans exhibiting normal neurons at days 6 and 7, respectively (Fig. 5D). In total, the combined data show that endogenous PSD-1 partially protects dopaminergic neurons from α-syn toxicity in the C. elegans model.
ETA Partially Rescues α-Syn–Induced Neurodegeneration.
We also tested whether ETA can rescue α-syn–induced neurodegeneration in C. elegans dopaminergic neurons. Transgenic worms expressing α-syn in dopamine neurons were treated with 50 μM ETA or a solvent control solution (0.35% vol/vol ethanol) and then exposed to EV or psd-1 dsRNA. The solvent control treatment did not significantly interfere with the RNAi conditions. As described above, at day 7 there was a significant difference between α-syn–expressing worms treated with EV/ethanol, where 28% of the population displayed a full complement of neurons, and α-syn–expressing worms with psd-1–depleted/ethanol, where 13% of the population retained a full complement of neurons (Fig. 6 A and C; P < 0.0005, two-way ANOVA). In contrast, treating the psd-1–depleted, α-syn–expressing worms with ETA increased the percentage of the population of worms that retained a full complement of neurons from 13% to 52% (Fig. 6 A and E). ETA also protected the EV control, α-syn–expressing worms from age-dependent neurodegeneration. For example, consider the two different treatments of α-syn–expressing worms at day 7: 28% and 58% of the worms retained a full complement of neurons after treatment with EV/ethanol and EV/ETA, respectively (Fig. 6 A and D). These data show that ETA rescues α-syn–induced neurodegeneration with or without the depletion of psd-1.
Fig. 6.

α-syn–induced dopaminergic neurodegeneration in C. elegans is rescued by ETA. (A) Ethanol or ETA treatment of nematodes expressing α-syn in the dopaminergic neurons (strain UA196) in the presence of dopamine neuron-specific RNAi for select targets. After synchronizing, worms were analyzed at days 6 and 7 posthatching. RNAi bacteria, which do not express an RNAi clone (EV), were used as a negative control. A worm was scored as normal when it had a full complement of six anterior dopaminergic neurons. Data are reported as the mean ± SD, n = 90 worms. ***P < 0.0005, two-way ANOVA. (B–E) Representative images of dopaminergic neurons treated with the solvent control (B and C) or ETA (D and E). Arrowheads show intact dopaminergic neuron cell bodies. Arrows indicate areas where dopaminergic neurons have degenerated. (B) Dopaminergic neurotoxicity in an animal expressing α-syn following treatment with EV RNAi and ethanol solvent. Five of the six dopaminergic neurons remain. (C) Control neurodegeneration in a nematode exposed to psd-1 dsRNA and ethanol; only three dopaminergic neurons remain. (D) When an α-syn–expressing animal was treated with EV RNAi and ETA, all six anterior dopaminergic neurons were intact. (E) Knockdown of psd-1 plus treatment with ETA resulted in far fewer animals with neurodegeneration, as evidenced in this nematode where dopaminergic neuroprotection was observed. (F) Graph depicting percentage of 7-d-old worms with normal DA neurons following RNAi targeting psd-1+EV, psd-1+cept-1, or EV+cept-1 with or without ETA treatment. Worms expressing α-syn specifically in the dopamine neurons were used in this study (strain UA196). *P < 0.05 and ****P < 0.0001, two-way ANOVA. (G) ETA rescues α-syn neurotoxicity at different time points following α-syn expression. Data are reported as the mean ± SD, n = 90 worms. *P < 0.05 and **P < 0.001, one-way ANOVA.
ETA Rescue Depends on the CDP–ETA Kennedy Pathway.
We hypothesized that the ETA rescue depends on the CDP–ETA arm of the Kennedy pathway (Fig. 1A). To test this, we performed double RNAi depletion of psd-1 and ETA phosphotransferase cept-1, which encodes the last enzyme in the Kennedy synthesis pathway. At day 7 after hatching, about 11% of α-syn–expressing worms depleted for psd-1 and EV exhibit normal DA neurons when provided an ethanol control (Fig. 6F). With ETA treatment, 50% of α-syn–expressing worms have normal DA neurons; thus, as previously shown (Fig. 6A), ETA significantly rescues α-syn–induced neurodegeneration when psd-1 is depleted (****P < 0.0001, two-way ANOVA). In the double RNAi conditions, about 13% of the animals had intact DA neurons when psd-1 and cept-1 were both depleted and treated with ETA, whereas 11% of worms displayed normal dopamine neurons when treated with the ethanol control using the same RNAi conditions (Fig. 6F). In cept-1–depleted and EV worms, 11% of the worms had intact DA neurons when treated with ethanol, whereas about 19% of the worms treated with ETA had normal DA neurons, which may due to partial replenishment of PE from PSD-1. For example, ETA can be converted to choline via stepwise methylations (37), and an increased level of choline should increase the level of PC. PS can be synthesized from PC or PE through PS synthase, and the resultant PS can be converted to PE via PSD-1. ETA thus significantly rescues (*P < 0.05) α-syn–induced neurodegeneration in EV+ cept-1–depleted worms; however, this rescue is much weaker than the rescue by ETA of EV+ psd-1–depleted worms (****P < 0.0001). Therefore, ETA fails to rescue the enhanced α-syn–induced neurodegeneration caused by psd-1 depletion when the PE Kennedy pathway is blocked.
To further examine the impact of ETA on α-syn–induced neurodegeneration, C. elegans expressing α-syn in DA neurons were exposed to ETA at different times in nematode development and lifespan. In our C. elegans α-syn transgenic model, α-syn expression begins during late embryogenesis from the Pdat-1 promoter and DA neurotoxicity increases during the aging process. By day 7 of adulthood, only 30% of the α-syn–expressing population displays normal neurons (Fig. 6G). We exposed populations of worms expressing α-syn to ETA either continuously or waited 3 or 5 d before the addition of ETA (or ethanol solvent control). Because we analyzed DA neurons at day 7 of development, this corresponded to 7, 4, or 2 d of ETA exposure, respectively. All three ETA treatments significantly enhanced DA neuronal survival compared with ethanol solvent (**P < 0.001) (Fig. 6G). DA neuron survival was not different when exposure was continuous (7 d) or temporally withheld, with only 4 d of ETA exposure. A comparison of DA neuron survival between the 4- and 2-d ETA treatments also did not show a significant difference. However, the exposure of ETA for 7 versus 2 d was significantly different (*P < 0.05). This is likely reflective of the nature of our α-syn degenerative model, which exhibits age-dependent neurodegeneration. Although the 2-d ETA treatment was not as protective, it still significantly rescued α-syn–expressing animals from DA neurodegeneration compared with ethanol control (**P < 0.001).
Discussion
ETA.
ETA stimulates growth of various types of cells, including mammary carcinoma cells, keratinocytes, and hepatocytes (38–40). An issue is whether ETA stimulates growth in these cells by triggering the synthesis of PE through the Kennedy pathway or by some other mechanism not involving PE. Many of these studies reported an increase in PE upon treatment of cells with ETA, and the authors (38) of one of the studies stated the following: “that an exogenous load of ETA increases the amount of PE in the plasma membrane of ETA-responsive cells suggests that the effect of ETA could be attributed to the stimulation of phospholipid synthesis.” Our assessment of the literature is that ETA likely stimulates the synthesis of PE through the Kennedy pathway, which allows cells to grow in serum-free medium. Collectively, the results in this study are consistent with ETA being converted to PE through the Kennedy pathway (Figs. 1D and 6F), which consequently increases the level of PE in cells with PSD1/psd-1 knocked out or depleted.
α-Syn Accumulates in psd1Δ Cells.
We found that psd1Δ cells expressing α-syn cultured in the mixed medium have significantly less PE and significantly more α-syn (and α-syn foci) than identically treated wild-type cells expressing α-syn (Fig. 1 B and D–F). The mutant has less PE than wild-type cells because PSD1 is deleted, but why does the mutant have more α-syn? The answer to this question comes about from the analysis of the following reaction (reaction 1), which depicts α-syn homeostasis in a single cell:
| [1] |
First, we found that whether α-syn is soluble or forms foci depends on cellular PC+PE content (Fig. 2E). When PC% + 1.38 PE% > 23.7%, α-syn is soluble, whereas when PC% + 1.38 PE% ≤ 23.7%, α-syn forms foci (Fig. 2E). The PE+PC content of psd1Δ cells favors α-syn foci, whereas the PE+PC content of psd1Δ cells with added ETA favors soluble α-syn, similar to wild-type cells cultured in the same medium. Second, if the α-syn foci in psd1Δ cells cannot be degraded by the proteasome or by the vacuole/lysosome, or if the rate of α-syn synthesis and the rate of α-syn degradation are out of balance, then the level of α-syn should increase, as we found (Fig. 1 E and F). Third, an issue is whether reaction 1 is really reversible; for example, if ETA is added to cells with preformed α-syn foci, does the increased PE shift the above reaction to the left, reestablish the catabolism of α-syn, and lower the level of α-syn? Such “rescue” experiments were conducted in yeast and worms (Fig. 6G and Fig. S2). In yeast, adding ETA to psd1Δ cells with preformed α-syn–GFP foci caused a burst of growth (because PE was replenished), and the foci were eliminated after a couple of hours. In this case, we cannot rule out that growth—cycles of cell division—diluted out both α-syn and the foci, which would be inconsistent with ETA shifting α-syn from foci to a soluble state within a single cell (reaction 1). On the other hand, consider C. elegans, whose neurons once formed do not undergo cycles of division: ETA protected adult worms from α-syn–induced degeneration when this metabolite was present during the last 2 or 4 d of the 7-d experiment. ETA also failed to protect when the last enzyme of the Kennedy pathway was knocked down (Fig. 6F). Such results show that ETA protects worm neurons through the Kennedy pathway—independent of growth—from the accelerated neurodegeneration induced by the cooccurrence of α-syn and low PE. Because we did not visualize α-syn foci in worm neurons, additional experiments are required to determine whether boosting PE through the Kennedy pathway eliminates these α-syn foci cells. Overall, we suggest that low PE increases the concentration of α-syn indirectly: Low PE causes trafficking defects, which promotes the formation of foci that contain concentrated (and probably aggregated) α-syn, and because these structures cannot be degraded, α-syn accumulates in cells.
Low PE and Vesicular Trafficking.
α-syn at elevated levels inhibits ER to Golgi trafficking in wild-type yeast cells and in mammalian cells (41). The present findings have focused on how low levels of PE disturb vesicular trafficking and promote the accumulation of α-syn in yeast cells. We propose that our data, together with previous reports (16, 25, 29, 42), support a model whereby a low level of PE in the ER inhibits the transport of a specific set of ER-derived vesicles and associated proteins to the plasma membrane (Fig. 7A). Daum (16) showed that the GPI-anchored protein Gas1 is inefficiently processed in the ER of psd1Δ cells and that the inefficient processing is a result of low PE, which is required for the attachment of the GPI anchor to the target protein, Gas1. However, he also found that the general secretory machinery is functional in psd1Δ cells, because the proteins carboxypeptidase Y and invertase are properly processed. Okamato (26) showed that GPI-anchored proteins recruit permeases (Tat2 and Fur4) into ER-derived vesicles that transit to the plasma membrane. Our findings that Fur4 and α-syn fail to localize to the plasma membrane in psd1Δ cells (Fig. 3 B and C) and the unique three-budded morphology of psd1Δ cells (Fig. 4A) are interpreted to be a consequence of the inefficient formation of GPI-anchored proteins, which are required to recruit Fur4 and α-syn to the plasma membrane. In short, we propose that a low level of PE in psd1Δ cells inhibits a vesicular pathway that contains ER-derived vesicles enriched in GPI-anchored proteins and lipid rafts, which include ergosterol (cholesterol) and sphingolipids, and that α-syn associates with vesicles in this pathway. In support of such a model, in yeast, α-syn mistrafficks and forms foci when lipid rafts are disrupted by inhibiting the synthesis of sphingolipids (Fig. 3D) (28), when ergosterol synthetic enzymes are knocked out (12), when ergosterol synthesis is inhibited by simvastatin or fluconazole (43), or when a GPI anchor enzyme is knocked out (Fig. 3D). In mammalian cells, cholesterol depletion with β-methylcyclodextrin also impedes the vesicular trafficking of α-syn (6). Although the specific details may be slightly different in human cells, the basic cellular components and processes are largely conserved. Overall, we suggest that psd1Δ cells expressing α-syn die from a combination of ER stress (SI Text), trafficking defects, and the accumulation of α-syn.
Fig. 7.

(A) Model of low PE-induced lipid disequilibrium in the ER. PE donates phospho-ETA to GPI anchor synthesis biosynthetic enzymes in the ER. Low levels of PE inhibit the attachment of the GPI anchor to the target precursor proteins in the ER. Because GPI-anchored proteins recruit permeases and α-syn into lipid rafts in the ER, the failure to process GPI-anchored proteins results in the failure of lipid raft-mediated, ER-to-Golgi transport of permeases and α-syn. α-syn thus forms foci in cells depleted of PE. ETA boosts the level of PE in cells and lessens α-syn inclusion formation. (B) Proposed dose–response curve for PE–α-syn. The y axis is neuronal viability; the x axis is [PE]. ETA is converted to PE in the ER through the Kennedy pathway. Worms are proposed to have basal levels of PE that are less than optimal, [PE]opt, to keep α-syn in a soluble nontoxic state.
ETA Protects Worms Expressing α-Syn from Age-Dependent Neurodegeneration.
A striking aspect of ETA is that it protects worms expressing α-syn from age-dependent neurodegeneration in the absence of the silencing of psd-1. For example, compare the neurodegeneration that occurs when worms expressing α-syn in the dopaminergic neurons were exposed to control RNAi (EV), with or without ethanol or ETA. Specifically, for α-syn/EV worms, 37% of the worms had all six anterior dopaminergic neurons intact after 6 d versus 24% after 7 d (Fig. 5E). Nearly the same extent of degeneration occurred for α-syn/ethanol worms (41% vs. 28%) (Fig. 6A). In contrast, for α-syn/ETA worms, 60% of the worms had all six anterior dopaminergic neurons intact after 6 d versus 58% after 7 d (Fig. 6A). Rescue by ETA implies that the neurons may have been deficient in PE. Perhaps this reflects a decline in PE with age in worms, as has been reported for mammals (44). Additional comments are given below.
Consider the bell-shaped curve in Fig. 7B. We suggest that this curve models the relationship between the viability of worm neurons expressing α-syn and the level of PE (Fig. 7B). Several points need to be made about the proposed profile: (i) Given that yeast and worms do not express human α-syn, the cellular levels of PE in yeast and worms are likely to be less than the optimal level of PE found in human cells. The human brain is particularly enriched in PE (45). (ii) Data points from our C. elegans experiments are overlaid on the theoretical bell-shaped profile. Although we did not measure PE levels in worms, knocking out PSD1 in yeast resulted in >50% decrease in PE, and a similar result likely occurs in worm neurons. (iii) Added ETA protects worms expressing α-syn depleted of psd-1, because ETA is converted to PE via the Kennedy pathway (Fig. 6). (iv) Added ETA also protects against age-dependent neurodegeneration in wild-type worms that express α-syn (but without psd-1 knockdown). Our interpretation of this latter finding is that added ETA increases the level of PE in the neurons of wild-type worms closer to [PE]opt, which is the level of PE at which α-syn is soluble, functions optimally, and the least neurodegeneration occurs (Fig. 7A).
PE in Humans.
Analyses of PE, PE precursors, and PE biosynthetic enzymes in Parkinson disease patients or postmortem tissue have shown the following: (i) The amount of PE in the substantia nigra of Parkinson disease patients was significantly lower compared with control subjects (46). (ii) Phosphoethanaolamine and phosphocholine levels were significantly lower in the midbrain of early Parkinson disease patients but not in the advanced patients compared with control subjects, according to a recent imaging study (47). Phosphoethanaolamine is also significantly lower in the cerebrospinal fluid of Parkinson patients compared with controls (48). (iii) The activity of Kennedy pathway enzymes phosphoethanolamine cytidylyltransferase, phosphocholine cytidylyltransferase, and PS synthase was significantly elevated in the substantia nigra of Parkinson disease patients compared with age-matched control subjects (49). The activities of these enzymes probably increase to compensate for low levels of PE.
In summary, we have discovered a highly conserved lipid metabolism gene that affects the homeostasis of α-syn. It is important to verify whether inducing PE synthesis through the Kennedy pathway via treatment with ETA can protect neurons from degeneration induced by overexpression of α-syn or toxins.
Materials and Methods
Yeast Strains, Media, and Materials.
The S. cerevisiae wild-type strain BY4741 (MATa his3∆1 leu2∆0 met15∆0 ura3∆0) and the deletion strains used in this study were purchased from Open Biosystems. For information on plasmids, strains, and additional methods, see SI Text. SC dropout media were prepared as described previously (50). Cells were transformed with Gal-inducible plasmids using the lithium acetate method and then pregrown in SC–Suc (2% wt/vol) dropout media to maintain the selection for plasmids. α-syn expression was induced in the same dropout media but with 1% Suc and 1% Gal or 2% (wt/vol) Gal replacing the Suc. Dropout media was purchased from Sigma-Aldrich and United States Biological, and unless otherwise noted, all other chemicals were purchased from Sigma-Aldrich. After ETA was added to liquid media, the pH was adjusted to the same level as that media without this additive. Yeast cells in liquid media were grown with shaking at 30 °C.
Growth Assays.
Yeast cells transformed with the indicated plasmids were pregrown in 3 mL SC–Ura Suc medium, diluted into 4 mL SC–Ura raffinose media (to OD600 = 0.2), and incubated for 6–8 h at 30 °C. The final cultures were normalized to the same OD, serially diluted in 10-fold increments, and the same number of cells were spotted (10 μL) onto solid plates and incubated at 30 °C. Some solid plates contained ETA (5 mM) or 5-FOA (0.06%, wt/vol). 5-FOA plates were incubated for 4 d; all other plates were incubated for 2 d. A complementary growth assay in liquid medium was also conducted. Growth was monitored by periodically removing aliquots and measuring the optical density at 600 nm. The doubling time [ln 2/k (h−1)] was determined by fitting the growth phase of the curves to y(t) = A⋅ekt. The goodness of fit parameter, R2, was typically 0.999 or larger. Curves were obtained from single colonies.
Western Blot Analysis.
Preparation of yeast cell lysates, SDS/PAGE, and Western blot analysis was carried out as described previously (31). Protein concentrations were determined using a bicinchoninic acid assay (Pierce). An aliquot of 50 μg total protein was loaded per well. The primary antibodies used were α-syn (2642; Cell Signaling Technology), phospho–Ser-129 αS (2014-1; Epitomics), and Pgk1 (459250, Invitrogen). Western blot band intensity was quantified as described in ref. 49; the plot of fold increase in α-syn is (Iα-syn/IPgk1)sample/(Iα-syn/IPgk1)control, where I is band intensity and control is wild-type cells expressing α-syn (–ETA).
β-Galactosidase ER Stress Assay.
Reporter plasmid pMCZ-Y was used to monitor ER stress. Cells were transformed with one of these plasmids and with pAG425 or pAG425–α-syn. Details of a similar assay where we monitored cell wall stress are described previously (31). Briefly, transformants were grown to OD600 = 1 in SC–Ura–Leu Suc medium at 30 °C. After washing, the cells were transferred into 5 mL SC–Ura–Leu mixed medium (OD600 = 0.2), incubated for 5 h at 30 °C, and then harvested and lysed. Aliquots of 50 µg of cell lysate were analyzed for β-galactosidase activity using the substrate o-nitrophenyl-β-d-galactoside; addition of 0.5 mL⋅1 M Na2CO3 terminated the reaction. The OD was measured at 420 nm. Specific activity is reported as nmol/min/mg protein.
Lipid Extraction, TLC, and Phospholipid Quantification.
Total phospholipids lipids were chemically extracted from yeast cells following the protocol of Folch et al. (51). TLC was used to separate phospholipids extracted from yeast cells (52). In some cases, bands from a developed plate were scraped off, and phosphate was analyzed by the malachite green method as described by Zhou and Arthur (52). In other cases, plates were scanned, and the resulting band intensities were quantified using Photoshop. These two methods gave similar results. For detailed methods, see SI Text.
Microscopy.
Fluorescent images of yeast cells were acquired using an Olympus AX70 microscope equipped with an Olympus UPlanFl 100×/1.35 NA objective and a CoolSNAP HQ CCD camera (Roper Scientific). For GFP detection, a Chroma 41001 filter was used (excitation, 480/40 nm; emission, 535/50 nm; Chroma Technology); for RFP detection, an Olympus MNG filter was used (excitation, 530–550 nm; emission, 590 nm). Images were acquired at room temperature. Yeast cells were cultured to midlog phase in mixed inducing media, fixed, and imaged using transmission electron microscopy as described by Flower et al. (53).
RNAi.
The psd-1 and vps-41 RNAi feeding clones and EV clone were purchased from Geneservice. Bacteria containing these plasmids were isolated and grown overnight in LB media with 100 μg/mL ampicillin. Nematode growth media plates containing 1 μM IPTG were seeded with RNAi feeding clones and allowed to dry. L4 staged hermaphrodites were transferred to corresponding RNAi plates and allowed to lay eggs overnight to synchronize the F1 progeny. The dopaminergic neurons in the F1 progeny of the RNAi-treated worms were analyzed for neurodegeneration at days 6 and 7. Two strains of C. elegans that provide cell-specific RNAi in dopaminergic neurons (35) were used in this study. Strain UA196 [sid-1(pk3321); Pdat-1::α-syn, Pdat-1::GFP; Pdat-1::sid-1, and Pmyo-2::mCherry] expresses α-syn, GFP, and SID-1 in the dopaminergic neurons and is susceptible to RNAi selectively in dopaminergic neurons. Strain UA202 [sid-1(pk3321); Pdat-1::GFP; Pdat-1::sid-1 and Pmyo-2::mCherry] acts as a control strain for UA196 and expresses GFP only (i.e., no α-syn).
Dopaminergic Neurodegeneration Analyses in C. elegans.
C. elegans dopaminergic neurons were analyzed for degeneration as previously described (33). The strain UA44 [baInl1; Pdat-1::α-syn and Pdat-1::GFP] expresses α-syn and GFP in the DA neurons and was used in ETA pulsed experiments. Strains UA196 and UA202 were treated with psd-1, vps-41, or EV dsRNA. Nematodes were synchronized, grown at 20 °C, and analyzed at days 6 and 7 of development for α-syn–induced dopaminergic neurodegeneration. On the day of analysis, the six anterior dopaminergic neurons were examined in 30 adult hermaphrodite worms, in triplicate. These worms were immobilized on glass coverslips using 3 mM levamisole and transferred onto 2% agarose pads on microscope slides. Analysis was carried out using a Nikon E800 with an Endow GFP filter cube (Chroma). Worms were considered normal when all six anterior neurons were present without any signs of degeneration, as previously reported (32, 33). In total, at least 90 adult worms were analyzed for each RNAi treatment (30 worms per trial, with a total of three trials). Statistical analyses were performed using one-way ANOVA and a Tukey’s post hoc analysis (P < 0.05) using GraphPad Prism (version 6).
Treatment of C. elegans with ETA.
ETA (Sigma-Aldrich) was dissolved in ethanol and then added to preautoclaved media, with the volume of compound solution taken into account. It was tested in C. elegans at a final concentration of 50 μM ETA and 0.35% ethanol in the media. An ethanol solvent control at the same concentration was also placed in the media and analyzed. All 35-mm worm plates were seeded with 300 μL concentrated HT115 Escherichia coli. Unless mentioned in Results, C. elegans were exposed to ETA from hatching through day 6 or 7 of adulthood and analyzed for DA neurodegeneration. For distinct temporal exposures, ETA was provided to C. elegans only for the times indicated.
Statistical Analyses.
P values were determined by one-way ANOVA with a Dunnett post hoc test when comparing more than two samples to a single control, one-way ANOVA with a Tukey post hoc test when comparing multiple samples of one treatment to each other, or two-way ANOVA with Sidak’s post hoc test for comparing multiple samples in different treatment conditions. Experimental values are means ± SD of typically 3–5 independent experiments. EXCEL and KaleidaGraph were used for the statistical tests.
Supplementary Material
Acknowledgments
We thank David Eide, David Levin, Zhengchang Liu, and Kelly Tatchell for plasmids. This work was supported in part by National Institutes of Neurological Disorders and Stroke Grants NS057656 (to S.N.W.) and NS075684 (to G.A.C.).
Footnotes
The authors declare no conflict of interest.
This article is a PNAS Direct Submission.
This article contains supporting information online at www.pnas.org/lookup/suppl/doi:10.1073/pnas.1411694111/-/DCSupplemental.
References
- 1.Dawson TM, Dawson VL. Molecular pathways of neurodegeneration in Parkinson’s disease. Science. 2003;302(5646):819–822. doi: 10.1126/science.1087753. [DOI] [PubMed] [Google Scholar]
- 2.Spillantini MG, et al. Alpha-synuclein in Lewy bodies. Nature. 1997;388(6645):839–840. doi: 10.1038/42166. [DOI] [PubMed] [Google Scholar]
- 3.Kara E, et al. α-Synuclein mutations cluster around a putative protein loop. Neurosci Lett. 2013;546:67–70. doi: 10.1016/j.neulet.2013.04.058. [DOI] [PMC free article] [PubMed] [Google Scholar]
- 4.Singleton AB, et al. Alpha-synuclein locus triplication causes Parkinson’s disease. Science. 2003;302(5646):841. doi: 10.1126/science.1090278. [DOI] [PubMed] [Google Scholar]
- 5.Burré J, et al. Alpha-synuclein promotes SNARE-complex assembly in vivo and in vitro. Science. 2010;329(5999):1663–1667. doi: 10.1126/science.1195227. [DOI] [PMC free article] [PubMed] [Google Scholar]
- 6.Fortin DL, et al. Lipid rafts mediate the synaptic localization of alpha-synuclein. J Neurosci. 2004;24(30):6715–6723. doi: 10.1523/JNEUROSCI.1594-04.2004. [DOI] [PMC free article] [PubMed] [Google Scholar]
- 7.Lingwood D, Simons K. Lipid rafts as a membrane-organizing principle. Science. 2010;327(5961):46–50. doi: 10.1126/science.1174621. [DOI] [PubMed] [Google Scholar]
- 8.Allen JA, Halverson-Tamboli RA, Rasenick MM. Lipid raft microdomains and neurotransmitter signalling. Nat Rev Neurosci. 2007;8(2):128–140. doi: 10.1038/nrn2059. [DOI] [PubMed] [Google Scholar]
- 9.Bagnat M, Keränen S, Shevchenko A, Shevchenko A, Simons K. Lipid rafts function in biosynthetic delivery of proteins to the cell surface in yeast. Proc Natl Acad Sci USA. 2000;97(7):3254–3259. doi: 10.1073/pnas.060034697. [DOI] [PMC free article] [PubMed] [Google Scholar]
- 10.Fujita M, Kinoshita T. GPI-anchor remodeling: Potential functions of GPI-anchors in intracellular trafficking and membrane dynamics. Biochim Biophys Acta. 2012;1821(8):1050–1058. doi: 10.1016/j.bbalip.2012.01.004. [DOI] [PubMed] [Google Scholar]
- 11.Dixon C, Mathias N, Zweig RM, Davis DA, Gross DS. Alpha-synuclein targets the plasma membrane via the secretory pathway and induces toxicity in yeast. Genetics. 2005;170(1):47–59. doi: 10.1534/genetics.104.035493. [DOI] [PMC free article] [PubMed] [Google Scholar]
- 12.Zabrocki P, et al. Phosphorylation, lipid raft interaction and traffic of alpha-synuclein in a yeast model for Parkinson. Biochim Biophys Acta. 2008;1783(10):1767–1780. doi: 10.1016/j.bbamcr.2008.06.010. [DOI] [PubMed] [Google Scholar]
- 13.Fujita M, Jigami Y. Lipid remodeling of GPI-anchored proteins and its function. Biochim Biophys Acta. 2008;1780(3):410–420. doi: 10.1016/j.bbagen.2007.08.009. [DOI] [PubMed] [Google Scholar]
- 14.Paulick MG, Bertozzi CR. The glycosylphosphatidylinositol anchor: A complex membrane-anchoring structure for proteins. Biochemistry. 2008;47(27):6991–7000. doi: 10.1021/bi8006324. [DOI] [PMC free article] [PubMed] [Google Scholar]
- 15.Menon AK, Eppinger M, Mayor S, Schwarz RT. Phosphatidylethanolamine is the donor of the terminal phosphoethanolamine group in trypanosome glycosylphosphatidylinositols. EMBO J. 1993;12(5):1907–1914. doi: 10.1002/j.1460-2075.1993.tb05839.x. [DOI] [PMC free article] [PubMed] [Google Scholar]
- 16.Birner R, Bürgermeister M, Schneiter R, Daum G. Roles of phosphatidylethanolamine and of its several biosynthetic pathways in Saccharomyces cerevisiae. Mol Biol Cell. 2001;12(4):997–1007. doi: 10.1091/mbc.12.4.997. [DOI] [PMC free article] [PubMed] [Google Scholar]
- 17.Schuiki I, Daum G. Phosphatidylserine decarboxylases, key enzymes of lipid metabolism. IUBMB Life. 2009;61(2):151–162. doi: 10.1002/iub.159. [DOI] [PubMed] [Google Scholar]
- 18.Kainu V, Hermansson M, Hänninen S, Hokynar K, Somerharju P. Import of phosphatidylserine to and export of phosphatidylethanolamine molecular species from mitochondria. Biochim Biophys Acta. 2013;1831(2):429–437. doi: 10.1016/j.bbalip.2012.11.003. [DOI] [PubMed] [Google Scholar]
- 19.Gibellini F, Smith TK. The Kennedy pathway—De novo synthesis of phosphatidylethanolamine and phosphatidylcholine. IUBMB Life. 2010;62(6):414–428. doi: 10.1002/iub.337. [DOI] [PubMed] [Google Scholar]
- 20.Storey MK, et al. Phosphatidylethanolamine has an essential role in Saccharomyces cerevisiae that is independent of its ability to form hexagonal phase structures. J Biol Chem. 2001;276(51):48539–48548. doi: 10.1074/jbc.M109043200. [DOI] [PubMed] [Google Scholar]
- 21.Joshi AS, Thompson MN, Fei N, Hüttemann M, Greenberg ML. Cardiolipin and mitochondrial phosphatidylethanolamine have overlapping functions in mitochondrial fusion in Saccharomyces cerevisiae. J Biol Chem. 2012;287(21):17589–17597. doi: 10.1074/jbc.M111.330167. [DOI] [PMC free article] [PubMed] [Google Scholar]
- 22.Chan EY, McQuibban GA. Phosphatidylserine decarboxylase 1 (Psd1) promotes mitochondrial fusion by regulating the biophysical properties of the mitochondrial membrane and alternative topogenesis of mitochondrial genome maintenance protein 1 (Mgm1) J Biol Chem. 2012;287(48):40131–40139. doi: 10.1074/jbc.M112.399428. [DOI] [PMC free article] [PubMed] [Google Scholar]
- 23.Ellis CD, et al. Zinc and the Msc2 zinc transporter protein are required for endoplasmic reticulum function. J Cell Biol. 2004;166(3):325–335. doi: 10.1083/jcb.200401157. [DOI] [PMC free article] [PubMed] [Google Scholar]
- 24.Willingham S, Outeiro TF, DeVit MJ, Lindquist SL, Muchowski PJ. Yeast genes that enhance the toxicity of a mutant huntingtin fragment or alpha-synuclein. Science. 2003;302(5651):1769–1772. doi: 10.1126/science.1090389. [DOI] [PubMed] [Google Scholar]
- 25.Okamoto M, Yoko-o T, Umemura M, Nakayama K, Jigami Y. Glycosylphosphatidylinositol-anchored proteins are required for the transport of detergent-resistant microdomain-associated membrane proteins Tat2p and Fur4p. J Biol Chem. 2006;281(7):4013–4023. doi: 10.1074/jbc.M504684200. [DOI] [PubMed] [Google Scholar]
- 26.Wittke S, Lewke N, Müller S, Johnsson N. Probing the molecular environment of membrane proteins in vivo. Mol Biol Cell. 1999;10(8):2519–2530. doi: 10.1091/mbc.10.8.2519. [DOI] [PMC free article] [PubMed] [Google Scholar]
- 27.Benachour A, et al. Deletion of GPI7, a yeast gene required for addition of a side chain to the glycosylphosphatidylinositol (GPI) core structure, affects GPI protein transport, remodeling, and cell wall integrity. J Biol Chem. 1999;274(21):15251–15261. doi: 10.1074/jbc.274.21.15251. [DOI] [PubMed] [Google Scholar]
- 28.Lee YJ, Wang S, Slone SR, Yacoubian TA, Witt SN. Defects in very long chain fatty acid synthesis enhance alpha-synuclein toxicity in a yeast model of Parkinson’s disease. PLoS ONE. 2011;6(1):e15946. doi: 10.1371/journal.pone.0015946. [DOI] [PMC free article] [PubMed] [Google Scholar]
- 29.Fujita M, Yoko-o T, Okamoto M, Jigami Y. GPI7 involved in glycosylphosphatidylinositol biosynthesis is essential for yeast cell separation. J Biol Chem. 2004;279(50):51869–51879. doi: 10.1074/jbc.M405232200. [DOI] [PubMed] [Google Scholar]
- 30.Jung US, Sobering AK, Romeo MJ, Levin DE. Regulation of the yeast Rlm1 transcription factor by the Mpk1 cell wall integrity MAP kinase. Mol Microbiol. 2002;46(3):781–789. doi: 10.1046/j.1365-2958.2002.03198.x. [DOI] [PubMed] [Google Scholar]
- 31.Wang S, et al. α-synuclein disrupts stress signaling by inhibiting polo-like kinase Cdc5/Plk2. Proc Natl Acad Sci USA. 2012;109(40):16119–16124. doi: 10.1073/pnas.1206286109. [DOI] [PMC free article] [PubMed] [Google Scholar]
- 32.Cao S, Gelwix CC, Caldwell KA, Caldwell GA. Torsin-mediated protection from cellular stress in the dopaminergic neurons of Caenorhabditis elegans. J Neurosci. 2005;25(15):3801–3812. doi: 10.1523/JNEUROSCI.5157-04.2005. [DOI] [PMC free article] [PubMed] [Google Scholar]
- 33.Hamamichi S, et al. Hypothesis-based RNAi screening identifies neuroprotective genes in a Parkinson’s disease model. Proc Natl Acad Sci USA. 2008;105(2):728–733. doi: 10.1073/pnas.0711018105. [DOI] [PMC free article] [PubMed] [Google Scholar]
- 34.Calixto A, Chelur D, Topalidou I, Chen X, Chalfie M. Enhanced neuronal RNAi in C. elegans using SID-1. Nat Methods. 2010;7(7):554–559. doi: 10.1038/nmeth.1463. [DOI] [PMC free article] [PubMed] [Google Scholar]
- 35.Harrington AJ, Yacoubian TA, Slone SR, Caldwell KA, Caldwell GA. Functional analysis of VPS41-mediated neuroprotection in Caenorhabditis elegans and mammalian models of Parkinson’s disease. J Neurosci. 2012;32(6):2142–2153. doi: 10.1523/JNEUROSCI.2606-11.2012. [DOI] [PMC free article] [PubMed] [Google Scholar]
- 36.Usenovic M, et al. Identification of novel ATP13A2 interactors and their role in α-synuclein misfolding and toxicity. Hum Mol Genet. 2012;21(17):3785–3794. doi: 10.1093/hmg/dds206. [DOI] [PMC free article] [PubMed] [Google Scholar]
- 37.Andriamampandry C, Freysz L, Kanfer JN, Dreyfus H, Massarelli R. Conversion of ethanolamine, monomethylethanolamine and dimethylethanolamine to choline-containing compounds by neurons in culture and by the rat brain. Biochem J. 1989;264(2):555–562. doi: 10.1042/bj2640555. [DOI] [PMC free article] [PubMed] [Google Scholar]
- 38.Kano-Sueoka T, et al. Phosphoethanolamine as a growth factor of a mammary carcinoma cell line of rat. Proc Natl Acad Sci USA. 1979;76(11):5741–5744. doi: 10.1073/pnas.76.11.5741. [DOI] [PMC free article] [PubMed] [Google Scholar]
- 39.Murakami H, et al. Growth of hybridoma cells in serum-free medium: Ethanolamine is an essential component. Proc Natl Acad Sci USA. 1982;79(4):1158–1162. doi: 10.1073/pnas.79.4.1158. [DOI] [PMC free article] [PubMed] [Google Scholar]
- 40.Sasaki H, Kume H, Nemoto A, Narisawa S, Takahashi N. Ethanolamine modulates the rate of rat hepatocyte proliferation in vitro and in vivo. Proc Natl Acad Sci USA. 1997;94(14):7320–7325. doi: 10.1073/pnas.94.14.7320. [DOI] [PMC free article] [PubMed] [Google Scholar]
- 41.Cooper AA, et al. Alpha-synuclein blocks ER-Golgi traffic and Rab1 rescues neuron loss in Parkinson’s models. Science. 2006;313(5785):324–328. doi: 10.1126/science.1129462. [DOI] [PMC free article] [PubMed] [Google Scholar]
- 42.Menon AK, Stevens VL. Phosphatidylethanolamine is the donor of the ethanolamine residue linking a glycosylphosphatidylinositol anchor to protein. J Biol Chem. 1992;267(22):15277–15280. [PubMed] [Google Scholar]
- 43.Valastyan JS, Termine DJ, Lindquist S. Splice isoform and pharmacological studies reveal that sterol depletion relocalizes α-synuclein and enhances its toxicity. Proc Natl Acad Sci USA. 2014;111(8):3014–3019. doi: 10.1073/pnas.1324209111. [DOI] [PMC free article] [PubMed] [Google Scholar]
- 44.Rappley I, et al. Lipidomic profiling in mouse brain reveals differences between ages and genders, with smaller changes associated with alpha-synuclein genotype. J Neurochem. 2009;111(1):15–25. doi: 10.1111/j.1471-4159.2009.06290.x. [DOI] [PMC free article] [PubMed] [Google Scholar]
- 45.Vance JE, Tasseva G. Formation and function of phosphatidylserine and phosphatidylethanolamine in mammalian cells. Biochim Biophys Acta. 2013;1831(3):543–554. doi: 10.1016/j.bbalip.2012.08.016. [DOI] [PubMed] [Google Scholar]
- 46.Riekkinen P, Rinne UK, Pelliniemi TT, Sonninen V. Interaction between dopamine and phospholipids. Studies of the substantia nigra in Parkinson disease patients. Arch Neurol. 1975;32(1):25–27. doi: 10.1001/archneur.1975.00490430047006. [DOI] [PubMed] [Google Scholar]
- 47.Hattingen E, et al. Phosphorus and proton magnetic resonance spectroscopy demonstrates mitochondrial dysfunction in early and advanced Parkinson’s disease. Brain. 2009;132(Pt 12):3285–3297. doi: 10.1093/brain/awp293. [DOI] [PubMed] [Google Scholar]
- 48.Manyam BV, Ferraro TN, Hare TA. Cerebrospinal fluid amino compounds in Parkinson’s disease. Alterations due to carbidopa/levodopa. Arch Neurol. 1988;45(1):48–50. doi: 10.1001/archneur.1988.00520250054021. [DOI] [PubMed] [Google Scholar]
- 49.Ross BM, Mamalias N, Moszczynska A, Rajput AH, Kish SJ. Elevated activity of phospholipid biosynthetic enzymes in substantia nigra of patients with Parkinson’s disease. Neuroscience. 2001;102(4):899–904. doi: 10.1016/s0306-4522(00)00501-7. [DOI] [PubMed] [Google Scholar]
- 50.Burke D, Dawson D, Stearns T. Methods in Yeast Genetics. Cold Spring Harbor, NY: Cold Spring Harbor Lab Press; 2000. pp. 103–174. [Google Scholar]
- 51.Folch J, Lees M, Sloane Stanley GH. A simple method for the isolation and purification of total lipides from animal tissues. J Biol Chem. 1957;226(1):497–509. [PubMed] [Google Scholar]
- 52.Zhou X, Arthur G. Improved procedures for the determination of lipid phosphorus by malachite green. J Lipid Res. 1992;33(8):1233–1236. [PubMed] [Google Scholar]
- 53.Flower TR, et al. YGR198w (YPP1) targets A30P alpha-synuclein to the vacuole for degradation. J Cell Biol. 2007;177(6):1091–1104. doi: 10.1083/jcb.200610071. [DOI] [PMC free article] [PubMed] [Google Scholar]
Associated Data
This section collects any data citations, data availability statements, or supplementary materials included in this article.