Abstract
Cell membrane-anchored biochemical sensors that allow real-time monitoring of the interactions of cells with their microenvironment would be powerful tools for studying the mechanisms underlying various biological processes, such as cell metabolism and signaling. Despite the significance of these techniques, unfortunately, their development has lagged far behind due to the lack of a desirable membrane engineering method. Here, we propose a simple, efficient, biocompatible, and universal strategy for one-step self-construction of cell-surface sensors using diacyllipid-DNA conjugates as the building and sensing elements. The sensors exploit the high membrane-insertion capacity of a diacyllipid tail and good sensing performance of the DNA probes. Based on this strategy, we have engineered specific DNAzymes on the cell membrane for metal ion assay in the extracellular microspace. The immobilized DNAzyme showed excellent performance for reporting and semiquantifying both exogenous and cell-extruded target metal ions in real time. This membrane-anchored sensor could also be used for multiple target detection by having different DNA probes inserted, providing potentially useful tools for versatile applications in cell biology, biomedical research, drug discovery, and tissue engineering.
The cellular microenvironment is, by definition, the local surroundings with which cells communicate by processing various biological signals, and by contributing their own impacts to this environment. It plays an essential role in regulating cellular activities, including metabolism, proliferation, apoptosis, and cell-to-cell communication and even determines the cell fate.1,2 Our understanding and manipulation of biological systems would be substantially improved with the ability to monitor the interaction of cells with their membrane-surrounding environment in real time.3,4 Currently, many excellent technologies and methodologies have been developed for analyzing the cellular events inside the cell5 and on the cell membrane;6 however, biotechniques to monitor what is happening surrounding the cell surface are rare and not easy to perform. The main roadblock is ascribed to the challenge in probing dynamic molecules and ions in the extracellular microspace with high spatial and temporal resolution. Most common techniques. such as fluorescence spectrometry, and mass spectrometry, despite being sensitive and accurate for molecule or ion assay, are aimed at the bulk medium and require tedious pretreatment, involving, for example, separation, purification, and concentration, making them inappropriate for real-time detection. In fact, given their rapid fluctuation, the concentration of molecules and ions in the cellular microenvironment is often difficult to distinguish. Moreover, released molecules and ions from cells into the bulk medium may be rapidly diluted to levels below the detection limit of conventional methods, making important cellular activities unobservable. To overcome this challenge, biosensing elements have been incorporated into the cell-surface membrane and have shown their ability to elucidate cell functions with high spatiotemporal resolution.4,7−9 Although these sensors have achieved impressive results, none of them can be easily anchored onto the cell surface, and the fabrication processes requires either toxic chemical reactions,8,9 complicated genetic manipulations,10 or specific affinity sites,11 which limit the effective usage and application scope of the surface sensors. A universal strategy that allows facile and efficient engineering of sensing elements onto the cell membrane without affecting cell physiology, while maintaining the sensor’s performance, would be desirable and highly useful.
The diacyllipid, which was first synthesized in our lab, consists of two C18 hydrocarbon tails and can be directly incorporated at the 5′ terminus of the DNA sequence in an automated DNA synthesizer.12,13 It was demonstrated that the diacyllipid-DNA conjugates could efficiently self-assemble onto the cell membrane based on the hydrophobic interaction between the lipophilic tail and the cellular phospholipid layer.14,15 In addition to excellent efficiency, this diacyllipid-based membrane modification process is noninvasive, simple, and convenient, and it can be used for any cell type, making it an ideal strategy for cell-surface decoration. Meanwhile, by using an in vitro process known as SELEX (Systematic Evolution of Ligands by Exponential Enrichment), various functional DNA probes, primarily aptamers16 and DNAzymes,17 have been screened from a large DNA library. With the advent of aptamers and DNAzymes, the bioanalytical application of DNA probes has been widely extended from gene assay to the analysis of metal ions, small molecules, pH, proteins, and even whole cells and bacteria.18 Furthermore, DNA probes have the additional advantages of flexible design, good stability, easy synthesis, good batch-to-batch consistency, and convenient modification with various functional groups and materials, making them popular tools in both fundamental research and clinical applications.
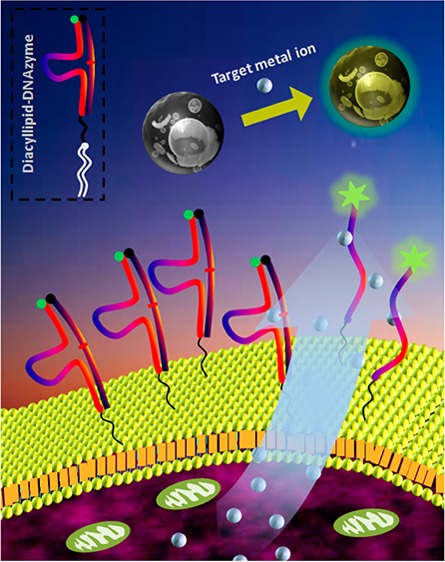
In this work, using the diacyllipid-DNA conjugate-based strategy, we decorated specific DNAzymes on the cell surface to monitor target metal ions in the cellular microenvironment. Metal ions are key participants in nearly all cell functions; thus, the investigation of their release pattern under specific conditions (e.g., hormone stimuli) would be an attractive subject and also a good way to test the practicality of this cell membrane-anchored biosensor.19 Specifically, a diacyllipid-DNAzyme probe hybridized with the substrate was anchored on the cell surface through spontaneous insertion of lipophilic tails into the plasma membrane (Scheme 1). This diacyllipid-DNAzyme probe has three sections. The 3′-end region is the DNAzyme sequence, and the 5′-end region contains a diacyllipid tail, while a PEG linker is located between the two regions. For signal transduction, the DNAzyme and the substrate stand are labeled with a fluorophore and a quencher, respectively. In the absence of the target metal ion, fluorescence is quenched because of the close proximity between the fluorophore and the quencher. However, after binding with the target metal ion, the DNAzyme can cleave the substrate into two fragments. The cleaved substrate then dissociates from the DNAzyme strand as a result of reduced hybridization stability, separating the quencher from the fluorophore and causing, in turn, the restoration of fluorescence on the cell membrane. Based on the intrinsic advantages of DNAzymes, including rapid kinetics, high sensitivity, and high selectivity, this fluorescent membrane-anchored sensor should be able to monitor target metal ions in the cellular microenvironment with spatiotemporal resolution. Furthermore, based on the universality of this membrane modification strategy, as well as the variety of DNAzyme probes screened from the SELEX process, this sensing system shows the potential for multiple metal ion detection.
Scheme 1. Schematic Illustration of the Cell Membrane-Anchored DNAzyme for Real-Time Monitoring of Metal Ions in the Cellular Microenvironment.
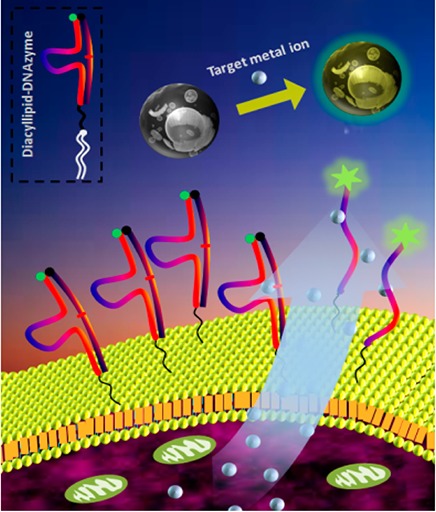
The diacyllipid-DNAzyme can self-assemble on the cell surface through the insertion of the diacyllipid tail into the cell membrane. On binding with the secreted target metal ion, the DNAzyme cleaves the substrate into two segments and then releases the shortened fragments. Thus, the quencher on the substrate strand is forced away from the fluorophore on the DNAzyme strand, leading to fluorescence restoration. The fluorescence enhancement can be used for metal ion quantification.
To fabricate a good-performance cell-surface sensor, we first evaluated and optimized the insertion ability of the diacyllipid-DNA conjugate into the live cell membrane. CCRF-CEM, a T lymphoblast-like cell line, was used as the model cell. After incubation with the diacyllipid-DNA probe labeled with a 3′-end fluorescein (FITC) at room temperature (RT) for different lengths of time, the cells were washed and then analyzed by flow cytometry. As shown in Figure 1A, a significant shift of the FITC signal could be observed after incubation for 15 min. Upon extending the incubation time, the signal increment slowed down, revealing the rapid insertion of the diacyllipid tails. The surface density of the lipid-DNA probe was quantified using fluorescence spectrometry (see details in the Supporting Information (SI)). The results show that ∼1.65 × 10⁶ probes were decorated on each cell after incubation for 30 min, which is over 25 times higher than that of the reported covalent chemistry method8 (Table S2). With high surface coverage (1.65%) and time-efficiency advantage, an optimized incubation time of 30 min was used in the subsequent studies.
Figure 1.
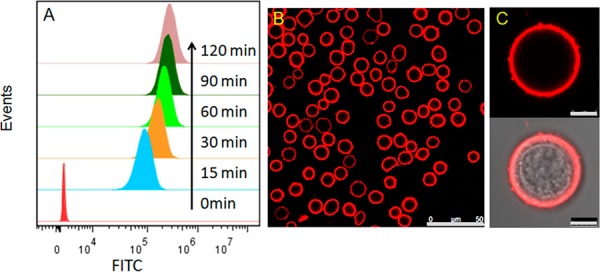
Modification of cell membranes with diacyllipid-DNA probes. (A) Flow cytometry assay of CEM cells incubated with 1 μM diacyllipid-DNA-FITC at RT for different time spans. (B, C) CLSM images of CEM cells incubated with 1 μM diacyllipid-DNA-TAMRA at RT for 30 min. Scale bars represent 50 μm (B) and 5 μm (C).
The cellular location of the diacyllipid-DNA probe was verified via live-cell confocal laser scanning microscopy (CLSM). To avoid deflection resulting from the intracellular low pH-quenched nature of the FITC, a rhodamine dye (TAMRA) was used in this experiment. As shown in Figure 1B and 1C, the TAMRA signal was mostly localized on the cell membrane, while only negligible fluorescence was observed inside the cells during the 2-h monitoring process (Figure S1). Further study showed that the DNA probes were predominantly located on the outer leaflet of the cell membrane (see details in Figure S2). Since cellular internalization of the diacyllipid-DNA probe will affect the sensor’s performance, the internalization issue was further investigated by holding the probe-modified cells at 37 °C, a temperature where cells show high internalization activity, for different time spans, followed by CLSM imaging (Figure S3). After processing with NIH ImageJ software, the data showed that 85% of the diacyllipid-DNA probe remained on the cell membrane, even after incubation at 37 °C for 2 h, indicating the desirable stability and reliability of this cell-surface sensor.
The PEG linker between the diacyllipid tail and the DNAzyme plays a key role in this sensing system. It can reduce nonspecific interaction between the cell membrane and the oligonucleotide, thus enabling the DNAzyme to protrude from the cell surface and maintain its functional conformation. Although incorporating a PEG spacer tends to reduce membrane insertion efficiency, it has also been shown to inhibit internalization of the lipid probe.15 Therefore, to improve the performance of this sensor, the length of the PEG linker was optimized. Taking both membrane insertion and signal transduction efficiencies into account (Figure S4), the probe inserted with 4 PEG molecules was used throughout, unless otherwise stated.
Having demonstrated the feasibility and reliability of this membrane decoration strategy, we proceeded to use it to engineer the cell surface with a specific DNAzyme for metal ion analysis. As a proof-of-concept, we first analyzed Mg2+ by decorating the cell surface with the Mg2+-specific DNAzyme (termed Mg-DNAzyme, Table S1). The specific response of Mg-DNAzyme to Mg2+ was initially confirmed in a buffer system with fluorescence spectroscopy, and the details are presented in the SI (Figure S5). We then evaluated the ability of the membrane-anchored DNAzyme to monitor Mg2+. After modification with the Mg-DNAzyme, the CEM cells were resuspended in buffer solutions containing different concentrations of Mg2+. Subsequently, the fluorescence signal of the cells was recorded by flow cytometry at given time points. To avoid interference from the cellular efflux of Mg2+, this experiment was performed at RT to ensure relatively slow cellular activity. With the addition of Mg2+, the fluorescence increased significantly, and the signal enhancement showed a dose-dependent pattern in the Mg2+ concentration range from 0 to 20 mM (Figure 2A and 2B). In contrast, only negligible fluorescence in response to Mg2+ was observed when the RNA nucleotide (rA) in the substrate was replaced with a DNA nucleotide (A), verifying that the response signal originated from the Mg2+-dependent cleavage reaction (Figure S6). By curve fitting, the Mg2+-dependent Kd was 2.0 ± 0.2 mM (R2 = 0.968) and the Kobs for 2 mM Mg2+ was 0.06 min–1 (R2 = 0.970). Both of these values are comparable to those in the buffer system, indicating that the immobilized Mg-DNAzyme retains its ability to sense Mg2+. Considering that the normal cellular Mg2+ concentration is 17–20 mM and the extrusion of 10–20% intracellular Mg2+ takes about 10 min,21 this cell-surface Mg-DNAzyme will be effective for analyzing Mg2+ efflux events.
Figure 2.
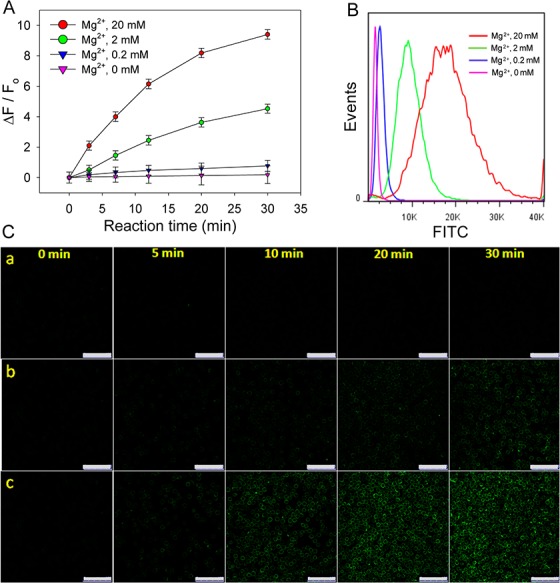
Performance of the cell-surface sensor for externally added Mg2+. (A) Kinetics assay by flow cytometry of CEM cells modified with Mg-DNAzyme and then treated with Mg2+ of different concentrations. Error bars represent the standard deviation of three independent experiments. (B) Flow cytometry assay of CEM cells modified with Mg-DNAzyme and then treated with Mg2+ of different concentrations at RT for 30 min. (C) CLSM images of the modified cells treated with 0 mM (a), 2 mM (b), or 20 mM Mg2+ (c) at RT for different time spans.
To challenge our membrane-anchored Mg-DNAzyme for monitoring the cellular Mg2+ extrusion process, α1-adrenoceptor, a hormone, was used to stimulate the efflux of Mg2+ from the cell. The fluorescence signal of the cells was collected at different time points by flow cytometry. As shown in Figure 3, the fluorescence signal increased rapidly with hormonal stimuli, and the increment slowed down after ∼12 min while that of the sample without hormone treatment changed rather slowly. Concurrent with this experiment, we demonstrated that α1-adrenoceptor itself affected neither the fluorescence intensity nor the cleavage activity of Mg-DNAzyme (Figure S7). Thus, the rapid increase of fluorescence signal should be attributed to hormone-induced extrusion and the high local concentration of Mg2+ in the cellular microenvironment. Since the released Mg2+ rapidly diffused into the bulk medium, the fluorescence did not continue to increase over time. Given that the DNAzyme reaction is not a constraint, the cellular efflux of Mg2+ stimulated by hormone is over a span of minutes, which is consistent with the reported value.21 Assuming that the fluorescence activation rate of this membrane-anchored sensor at a specific moment during Mg2+ transport out of the cells equals the initial rate of fluorescence activation in the case when the sensor was incubated with externally added Mg2+, the concentration of Mg2+ released by the cells in the extracellular microspace with stimulation of 20 μM and 0.2 μM α1-adrenoceptor at the time point of 3 min were about 6.0 and 0.79 mM, respectively (see details in Figure S8). To obtain vivid live-cell imaging data, CLSM measurements were also conducted, and the results were consistent with those of flow cytometry assay. Upon hormone stimulation, the cell membrane decorated with Mg-DNAzymes was rapidly illuminated, while that without hormone treatment displayed a much weaker signal throughout the entire monitoring process (Figure S9), demonstrating that this cell membrane-anchored DNAzyme is powerful for analyzing the cellular efflux process of the target metal ion.
Figure 3.
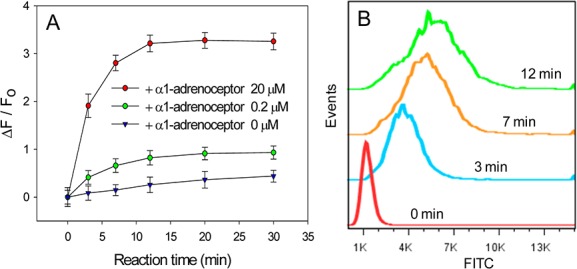
Analysis capability of the cell-surface Mg-DNAzyme for monitoring the cellular extrusion of Mg2+. (A) Kinetics assay by flow cytometry of CEM cells modified with Mg-DNAzyme and then treated with α1-adrenoceptor of different concentrations at 37 °C. Error bars represent the standard deviation of three independent experiments. (B) Flow cytometry assay of CEM cells modified with Mg-DNAzyme and then treated with 20 μM α1-adrenoceptor at 37 °C for different time spans.
The reliability and universality of this sensing system was further confirmed by replacing the Mg-DNAzyme sequence with a DNAzyme specific for Pb2+ (termed Pb-DNAzyme). According to the flow cytometry and CLSM results, this cell-surface Pb-DNAzyme could selectively signal the presence of Pb2+ with high sensitivity (LOD of 0.3 μM), rapidly suggesting a promising platform for monitoring lead contamination in the cellular microenvironment (Figure S10). Being attracted by the biomedical importance of Zn2+, a neurotransmitter in the nervous system,23 we also modified the cell surface with a Zn-DNAzyme and tested its response to Zn2+ added into the cell solution. As shown in Figure S9, this sensor could quantitatively signal Zn2+ at concentrations ranging from 0 to 1000 μM within seconds. Since the concentration of Zn2+ in synaptic vesicles is in the micro- to millimolar range and a considerable amount is conveyed to neighboring cells on excitation, the neuron-surface Zn-DNAzyme has the potential for studying the Zn2+signaling pathway.25
To verify the multiplexing potential of this scheme, the cells were modified with two different DNAzymes. The one labeled with an FITC dye was specific for Pb2+; the other labeled with a TAMRA dye was specific for Mg2+. As shown in Figure 4, the addition of Pb2+ initiated only the cleavage reaction of Pb-DNAzyme, while Mg2+ showed a preference for activating the Mg-DNAzyme. Only in the presence of both Pb2+ and Mg2+ could FITC and TAMRA fluorescence be observed together on the cell membrane, indicating an excellent capability for multiple metal ion detection.
Figure 4.
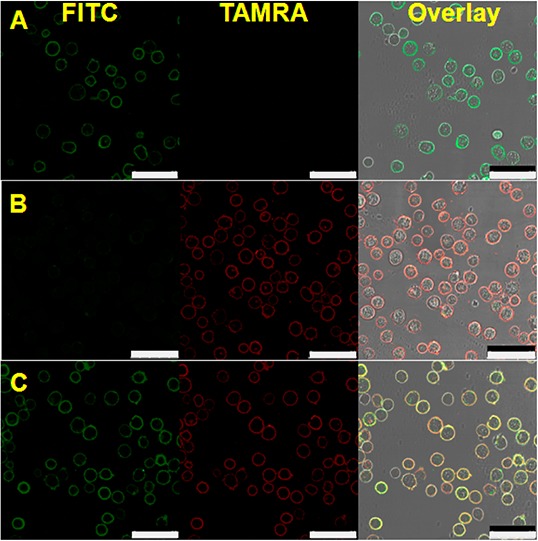
Multiplexing potential of this sensing system. CLSM images of CEM cells modified with Pb-DNAzyme-FITC and Mg-DNAzyme-TAMRA, and treated with 20 μM Pb2+(A), 2 mM Mg2+ (B), and 20 μM Pb2+ plus 2 mM Mg2+(C) at RT for 15 min. Scale bar represents 50 μm.
In summary, we have, for the first time, used a simple, universal method to decorate DNAzymes on the cell membrane for extracellular metal ion analysis. This membrane-anchored DNAzyme was able to monitor the cellular efflux of a target metal ion in real time and semiquantify its instantaneous concentration at specific moments. In addition, with the advantages of high efficiency, desirable reliability, low toxicity, and convenient operation, this diacyllipid-DNA conjugate-based cell-membrane modification strategy can be extended to engineer different DNA sensors on the cell surface for real-time analysis of various targets, such as ions, metabolites, proteins, and extracellular vesicles, in the cellular microenvironment, providing potentially powerful tools for biological and biomedical research. On the other hand, this membrane-anchored sensor works in an irreversible fashion; hence, the absolute fluorescence intensity represents an accumulative signal rather than an instantaneous response. Besides, the fluorescence signal is not only dependent on the release and diffusion of Mg2+ but also the reaction kinetics of the DNAzyme, making the determination of the total amount of the Mg2+complicated. We may solve this challenge by mathematical modeling. To set up rational mathematical models, further efforts are needed on the basic research of each reaction step.
Acknowledgments
This work is supported by grants awarded by the National Key Scientific Program of China (2011CB911000), NSFC Grants (21025521, 21221003, and 21327009), and China National Instrumentation Program 2011YQ03012412. This work is also supported by the National Institutes of Health (GM079359 and CA133086). C.W. acknowledges the ACS Division of Analytical Chemistry Fellowship.
Supporting Information Available
Detailed experimental procedures, DNA sequences, and supplementary data. This material is available free of charge via the Internet at http://pubs.acs.org.
The authors declare no competing financial interest.
Funding Statement
National Institutes of Health, United States
Supplementary Material
References
- Joyce J. A.; Pollard J. W. Nat. Rev. Cancer 2009, 9, 239. [DOI] [PMC free article] [PubMed] [Google Scholar]
- Wang L. D.; Wagers A. J. Nat. Rev. Mol. Cell Biol. 2011, 12, 643. [DOI] [PMC free article] [PubMed] [Google Scholar]
- Elbrink J.; Bihler I. Science 1975, 188, 1177. [DOI] [PubMed] [Google Scholar]
- Ali M. M.; Kang D. K.; Tsang K.; Fu M.; Karp J. M.; Zhao W. Wiley Interdiscip Rev. 2012, 4, 547. [DOI] [PMC free article] [PubMed] [Google Scholar]
- Tyagi S. Nat. Methods 2009, 6, 331. [DOI] [PubMed] [Google Scholar]
- McMahon H. T.; Gallop J. L. Nature 2005, 438, 590. [DOI] [PubMed] [Google Scholar]
- Tanaka M.; Sackmann E. Nature 2005, 437, 656. [DOI] [PubMed] [Google Scholar]
- Zhao W.; Schafer S.; Choi J.; Yamanaka Y. J.; Lombardi M. L.; Bose S.; Carlson A. L.; Phillips J. A.; Teo W.; Droujinine I. A. Nat. Nanotechnol. 2011, 6, 524. [DOI] [PMC free article] [PubMed] [Google Scholar]
- Tokunaga T.; Namiki S.; Yamada K.; Imaishi T.; Nonaka H.; Hirose K.; Sando S. J. Am. Chem. Soc. 2012, 134, 9561. [DOI] [PubMed] [Google Scholar]
- Giepmans B. N.; Adams S. R.; Ellisman M. H.; Tsien R. Y. Science 2006, 312, 217. [DOI] [PubMed] [Google Scholar]
- Beigi R.; Kobatake E.; Aizawa M.; Dubyak G. R. Am. J. Physiol. 1999, 276, C267. [DOI] [PubMed] [Google Scholar]
- Liu H.; Zhu Z.; Kang H.; Wu Y.; Sefan K.; Tan W. Chem.—Eur. J. 2010, 16, 3791. [DOI] [PMC free article] [PubMed] [Google Scholar]
- Wu C.; Chen T.; Han D.; You M.; Peng L.; Cansiz S.; Zhu G.; Li C.; Xiong X.; Jimenez E. ACS Nano 2013, 7, 5724. [DOI] [PMC free article] [PubMed] [Google Scholar]; Wang R.; Zhu G.; Mei L.; Xie Y.; Ma H.; Ye M.; Qing F.; Tan W. J. Am. Chem. Soc. 2014, 136, 2731–2734. [DOI] [PMC free article] [PubMed] [Google Scholar]
- Xiong X.; Liu H.; Zhao Z.; Altman M. B.; Lopez D.; Yang C. J.; Chang L. J.; Liu C.; Tan W. Angew. Chem., Int. Ed. 2013, 52, 1472. [DOI] [PMC free article] [PubMed] [Google Scholar]
- Liu H.; Kwong B.; Irvine D. J. Angew. Chem., Int. Ed. 2011, 123, 7190. [DOI] [PMC free article] [PubMed] [Google Scholar]
- Zhao Z.; Fan H.; Zhou G.; Bai H.; Liang H.; Zhang X.; Tan W. J. Am. Chem. Soc. 2014, 136, 11220. [DOI] [PubMed] [Google Scholar]
- Willner I.; Shlyahovsky B.; Zayats M.; Willner B. Chem. Soc. Rev. 2008, 37, 1153. [DOI] [PubMed] [Google Scholar]; Hu R.; Zhang X.; Zhao Z.; Zhu G.; Chen T.; Fu T.; Tan W. Angew. Chem., Int. Ed. 2014, 53, 5821–5826. [DOI] [PubMed] [Google Scholar]
- Krishnan Y.; Simmel F. C. Angew. Chem., Int. Ed. 2011, 50, 3124. [DOI] [PubMed] [Google Scholar]
- Bodenmiller B.; Zunder E. R.; Finck R.; Chen T. J.; Savig E. S.; Bruggner R. V.; Simonds E. F.; Bendall S. C.; Sachs K.; Krutzik P. O. Nat. Nanotechnol. 2012, 30, 858. [DOI] [PMC free article] [PubMed] [Google Scholar]
- Romani A. M. Am. J. Physiol. 2011, 512, 1. [Google Scholar]
- Sensi S. L.; Paoletti P.; Koh J. Y.; Aizenman E.; Bush A. I.; Hershfinkel M. J. Neurosci. 2011, 31, 16076. [DOI] [PMC free article] [PubMed] [Google Scholar]
- Colvin R. A.; Fontaine C. P.; Laskowski M.; Thomas D. Eur. J. Pharmacol. 2003, 479, 171. [DOI] [PubMed] [Google Scholar]
Associated Data
This section collects any data citations, data availability statements, or supplementary materials included in this article.


