Abstract
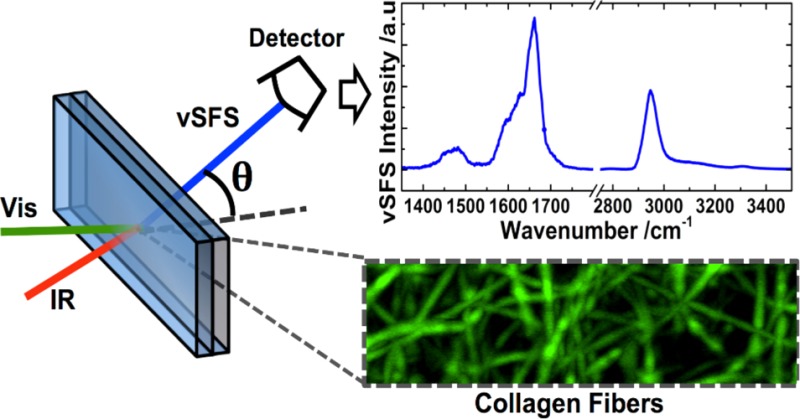
Protein fibers play a crucial role in many disease related phenomena and biological systems. A structural analysis of fibrous proteins often requires labeling approaches or disruptive sample preparation while it lacks chemical specificity. Here we demonstrate that the technique of vibrational sum-frequency scattering (SFS) provides a label-free pathway for the chemical and structural analysis of protein fibers in solution. By examining collagen, the most abundant protein in mammals, we demonstrate that the SFS signal of fibers can be detected in the NH, CH stretching and bending, and amide I regions. SFS spectra were found to depend on the scattering angle, which implies the possibility to selectively probe various features of the fibers. The fitting of the data and maximum entropy method analysis revealed a different phase for side-chains and carbonyl contributions, which helps to identify these otherwise overlapping spectral peaks and provides the possibility to perform orientational analysis. Our findings suggest that SFS allows for the greater understanding of protein fibers in solution, which is important when, for example, designing scaffolds in tissue engineering or developing cures for diseases associated with protein fibers.
Protein fibers are a common motif in nature and are often essential for the structural integrity of living entities. Collagen fibers, for example, are major components in the extracellular matrix of connective tissue, while actin filaments are important in the intracellular cytoskeleton. Amyloid fibers are associated with several severe diseases, such as Alzheimer’s disease1 and diabetes mellitus;2 hence, it is important to perform detailed analyses of protein fibers, especially in aqueous environments and with chemical and structural specificity. Electron microcopy3,4 and atomic force microscopy5,6 have been used for studies of collagen fiber morphology. X-ray crystallography7,8 and nuclear magnetic resonance (NMR)9 have been used for chemical and structural investigations of collagen-like fibers; however, these techniques typically demand extensive sample preparation and high sample purity, while the analysis can get complicated and requires additional computational efforts.
Optical imaging techniques, such as those based on second harmonic generation (SHG) (Figure 1), are useful tools to visualize fibers in various environments;10 however, they lack chemical specificity. Optical spectroscopic techniques, for example, Fourier transform infrared (FTIR) and Raman spectroscopy, do have chemical specificity but cannot differentiate between chemical species in the surrounding media and those within or on the fibers, so only purified samples can be analyzed. Vibrational sum-frequency generation (SFG) spectroscopy, in reflection or transmission geometries, previously was used on collagen fibers,11,12 but it requires the fibrils to be attached to a substrate in an aligned fashion to produce a signal. To overcome all of these constraints, we suggest the use of sum-frequency scattering (SFS) to study protein fibers in solution. This technique is based on the same principles as is SFG, but the scattering process allows the study of ordered structures in solution. SFS was first demonstrated by Roke et al.13 and has since been used in, for example, surface molecular orientation analyses on spherical particles14,15 or the spectroscopic detection of liposomes.16
Figure 1.
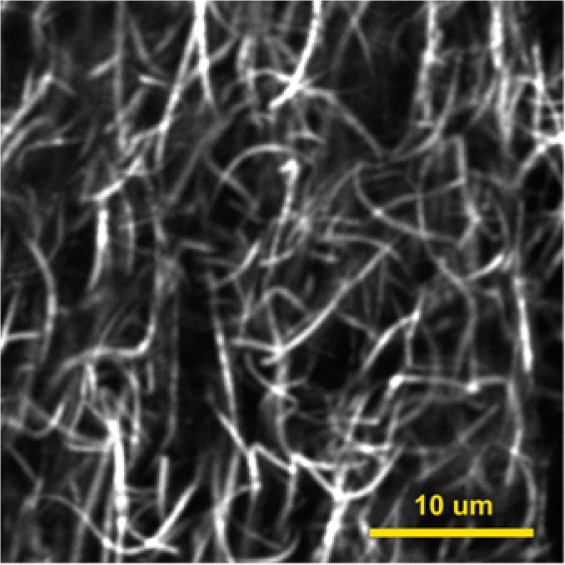
SHG image of collagen fibers recorded in backscattering mode using a confocal upright microscope (Olympus FV1000 MPE BX61 Multiphoton Microscope) pumped at 860 nm (Spectra-Physics, Mai Tai). The fibers exhibited intrinsic ordering that resulted in high contrast images and were evenly distributed throughout the sample. A Z-stack is available in the Supporting Information that shows the three-dimensional (3D)-structure.
In our study, we used SFS to study collagen type I (PureCol, Advanced Biomatrix Inc.) fibers. The collagen self-assembled in phosphate buffered saline (150 mM NaCl, 10 mM phosphate) at pH 7.5 into gel-like fibrillar networks (Figure 1). The sample preparation was described elsewhere.17,18 After fibrillation, the buffer was exchanged with D2O to avoid extensive infrared (IR) absorption from H2O in the SFS experiments. A fs-pulsed laser system (Quantronix, Integra HE with ∼110 fs pulses and Palitra-FS) was used with less than 10 μJ per pulse at the sample stage for the IR and (etalon-shaped) visible beams. The incidence angle between the IR and visible beams was 25°. The IR beam was focused on the sample with a lens of 50 mm focal length to a 50–100 μm beam diameter, which depended on the wavelength. The visible beam was focused about 1 cm beyond the sample cell with a lens of 150 mm focal length, which gave a beam diameter of about 500 μm at the sample. The sample cell consisted of a quartz plate (Hellma, 106 QS with a 200 μm spacer) and a CaF2 detachable window (CeNing Optics Co.) that faced the incoming IR and visible beams (see experimental setup in Figure 2a). The SFS signal was collected with a lens of 25 mm focal length and detected with a spectrograph and intensified charge-coupled device camera (Princeton Instruments, SpectraPro 2300i and Pi-Max 4). Each spectrum was a sum of the accumulations with a 50 cm–1 IR step size, where each accumulation was normalized to the respective IR intensity, accumulation time, and IR profile. The latter was recovered from the third harmonic signal (difference frequency generation between two visible and one IR photon) from the CaF2 window. No further data treatment was performed.
Figure 2.
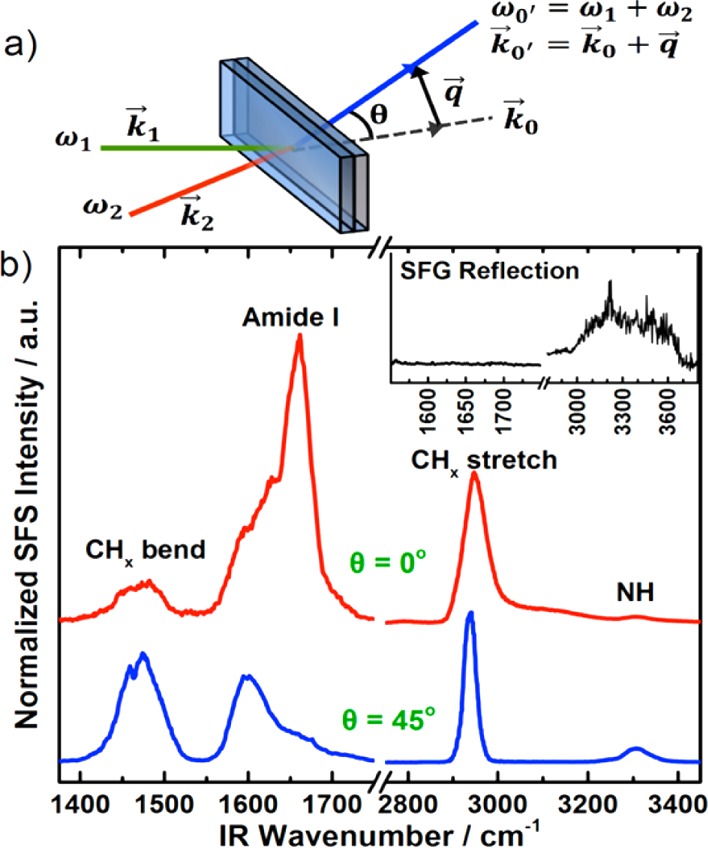
(a) The experimental setup. (b) Wide SFSssp spectra of collagen type I fibers in D2O collected at 0° (top/red) and 45° (bottom/blue). Inset is an SFGppp spectra in the reflection mode of a similar sample.
The scattering angle is
defined as the angle between the wave vector
in the forward direction,  , and the SFS wave vector,
  , which is determined by the scattering
vector q⃗ (Figure 2a). We recorded SFS spectra for collagen fibers by placing the collecting
lens at scattering angles of θ = 0° and θ = 45°.
The polarization combination in the experiment was ssp (SFS, s-polarized; Vis, s-polarized;
and IR, p-polarized), where p denotes
the polarization in the incidence plane for the IR and Vis beams,
while s denotes the polarization perpendicular to
this plane. The spectra can be divided into four main regions: 1400–1600
cm–1, with mainly C–H bends from side-chains;
1600–1700 cm–1, with the amide vibrations
that typically reveal the protein secondary structure; 2800–3000
cm–1 with C–H stretches; and 3200–3400
cm–1, with N–H stretches. The spectra at
the various scattering angles exhibit some major differences (Figure 2b). The amide signal at about 1650 cm–1 is much stronger at 0°, while the N–H features at about
3300 cm–1 are more clear at 45°. Also, the
side-chain features from 1400–1600 cm–1 are
more pronounced, and the C–H stretch signals from 2800–3000
cm–1 are narrower at 45°. Previous discussions
for nonlinear scattering from spherical particles revealed that SFS
signals at θ = 0° are related to bulk contributions, while
signals at higher scattering angles originate from the surface of
the particles.19 A similar mathematical
framework for fibers will help us to identify the relationship between
scattering angles and the regions probed within fibers in future studies.
Another issue to consider is that chiral features may have a scattering
maximum in the forward direction, while achiral ones might be emphasized
at a certain scattering angle.20
The control SFGppp spectra were measured using a CaF2 prism solid/liquid interface with a ps-pulsed laser system (EKSPLA, Nd:YAG and OPA/OPG/DFG) and incident angles of 60° and 62° relative to the surface normal for the IR and visible beams, respectively. The ppp polarization combination was used to provide the strongest possible signal in reflection. Unexpectedly, the spectra did not show any features from collagen, only O–H contributions from water at 3000–3700 cm–1. The CaF2 surface is probably unable to induce ordering at the interface to the collagen fibers that are entangled in a large network and remain isotropic. This confirms that the spectra in Figure 2, panel b really are SFS signals and not SFG contributions from the sample cell interface.
The SFS theory was sorted out for spherical particles20−23 and to some extent for other shapes.24 As was previously done for SFS spectra from spherical paricles,13,16 we use familiar expressions for SFG25 to qualitatively analyze the data from the collagen fibers. The SFS signal intensity is then described by
| 1 |
where EωVis and EωIR are the electric fields of the Vis and IR beams, respectively, and Γ(2) is the effective susceptibility for the material under study. Γ(2) is a material property that can be divided into a potential nonresonant part and a sum of the resonant parts:
| 2 |
where ωIR and ωk are the wavenumbers of the IR and the kth vibrational mode, respectively. γk is a damping factor, and Ak is the amplitude for the kth IR and Raman active vibration.
The primary structure of fibrillar collagen is Gly–X–Y, where X often is a proline (Pro) and Y is commonly a hydroxyproline (Hyp). The high abundance of Pro and Hyp in the structure makes the peptide chains fold into left-handed alpha-helices. Three such helices twine together to form a 300 nm long right-handed triple-helix called tropocollagen, which is the building block for larger fibers.26,27 The tight packing at the center of the three helices is realized by the smallest amino acid glycine (Gly) in every third residue in the primary structure. IR spectroscopy studies of synthesized collagen-related peptides (poly glycine, poly proline, and poly tripeptides)28 and combined FTIR and molecular dynamic simulations29 have shown that the high abundance of Gly, Pro, and Hyp in collagen makes it possible to divide the amide I region into three contributions. This was also done in previous SFG studies, and we utilize this scenario in our analysis of the spectra from 1400–1775 cm–1, which were fitted with eq 2. We split up the amide I region into three different peaks at 1623 cm–1, 1654 cm–1, and 1667 cm–1, assigned to Pro, Gly, and Hyp, respectively.11,28,29 The side-chain peaks were found from 1454–1490 cm–1 and at 1595 cm –1. Figure 3 shows the fits and peak amplitudes in the amide I region for the two spectra. Gly has the strongest contribution to the amide I signal for both spectra, which is reasonable since it is the main residue in collagen, and it agrees with earlier IR spectroscopy studies.28,29 The overall peak amplitudes for the amide I vibrations are lower at 45°, and Pro constitutes the major difference. The less significant signal decrease for Gly and Hyp may be related to the fact that Gly is buried inside the triple-helical tropocollagen, and Hyp can H-bond with the surrounding environment with its extra hydroxyl group, which makes these residues potentially more stable in their conformation throughout the collagen fiber structure.
Figure 3.
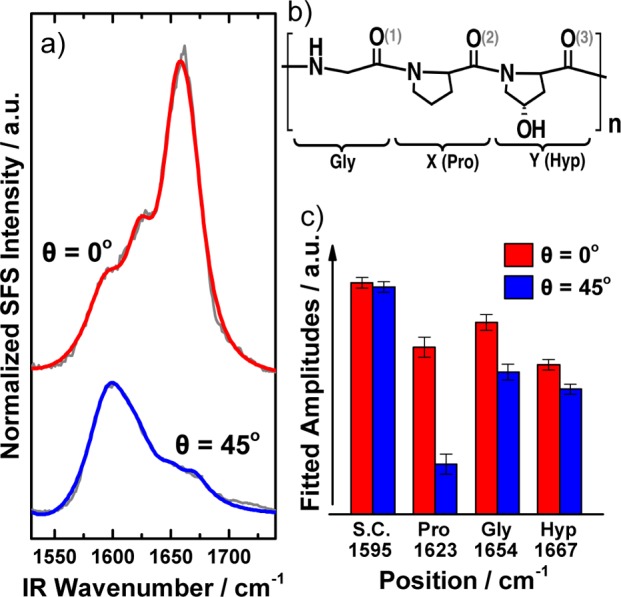
(a) Fits from eq 2 of the spectra at 0° (top/red) and 45° (bottom/blue). The gray lines are the raw spectra. (b) A simplified overview of the Gly–X–Y primary structure of collagen type I, where X is often a Pro, and Y is often a Hyp. (c) Bar plot of the positions, amplitudes, and assignments for the peaks in the amide I region. Gly, the main residue in collagen, is the strongest contributor.
We further analyzed the data using the maximum entropy method (MEM), which allows us to derive real and imaginary parts of Γ(2) from an intensity spectrum.30 The MEM analysis is based on the performance of a FT of the spectra to the time domain, which gives the autocorrelation function, R(t). The limited spectral resolution in the frequency spectra gives an R(t) only up to a certain time. If R(t) is expanded beyond this time, while the resonances are kept exponentially decaying and no new information is added to the original spectra (and thus the spectral entropy is kept at maximum), it becomes possible to calculate a complex Γ(2) value for the spectra. The only parameter left is an error phase, which is typically adjusted to accommodate reasonable spectral features. While there may be some flexibility in this procedure, it is important that the error phase itself does not alter the phase relationship between the individual spectral contributions. Therefore, the MEM-derived imaginary parts, even without error phase adjustments, allow us to identify phase relations between the peaks.31 For our data, the MEM algorithm provides a complex solution for Γ(2) with opposing signs in the imaginary part for the side-chain peaks and the amide I peaks (Figure 4a). In fact, we also realized this phase relation while the spectra was fitted, since we could only retrieve reasonable fits with opposing phases for the two spectral regions. Since the orientation and phases are closely related to each other, we can take advantage of such an analysis in order to (i) differentiate overlapping spectral contributions and (ii) provide orientational relationships between different chemical groups identified in the SFS spectra.
Figure 4.
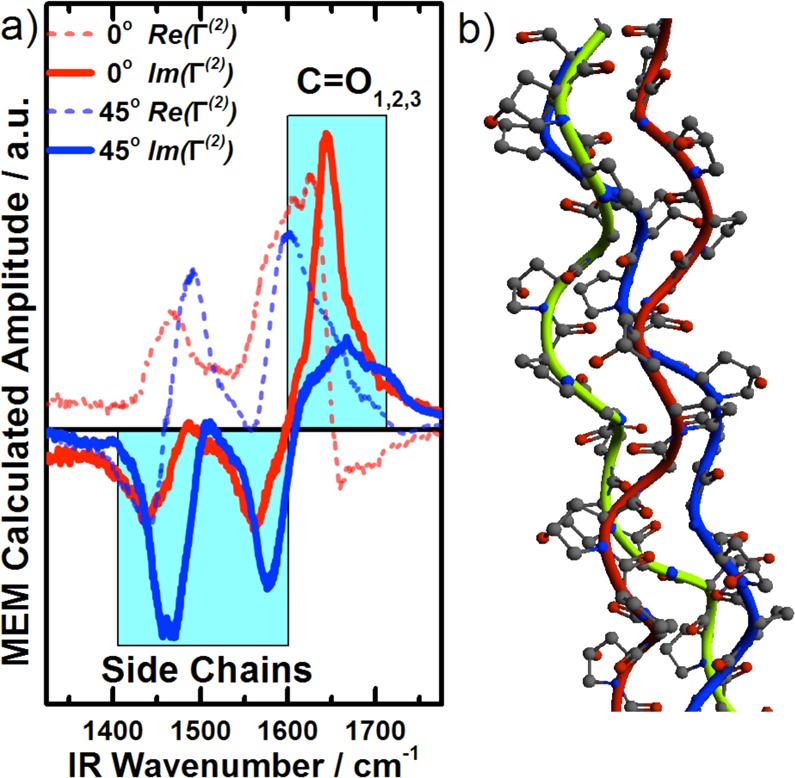
(a) MEM analyses of the spectra at 0° and 45°, which shows that the imaginary parts for the side-chains and the carbonyls differ in sign. (b) Collagen triple helix structure, extracted from the RCSB Protein Data Bank, based on X-ray crystallography studies from Berman et al.8
Previous X-ray crystallography7,8 and NMR9 studies suggest that the carbonyls are oriented away from the fiber axis (Figure 4b) and stabilize the triple helix by forming hydrogen bridge bonds to neighboring strands. In such a scenario, both the carbonyl and the side-chains would have orientations in the same direction. If the sign of hyperpolarizability were equal for both vibrational features, it would lead to a similar phase. Since our results suggest a different sign of the phases for both contributions, an opposing sign in the hyperpolarizability for the carbonyls and side-chains seems likely. When such relationships between various vibrations are theoretically available, SFS will become a powerful tool to evaluate the relative orientations of molecular species in protein fibers.
To summarize, we have for the first time recorded SFS spectra of protein fibers. In the case of collagen, there are major distinctions between the spectra collected at 0° and 45° scattering angles. The fitting of the spectra shows that it is possible to split up the amide I region into contributions from Gly, Pro, and Hyp, while a MEM analysis revealed that the side-chains and carbonyls have opposing phases. Hypotheses that explain these qualitative results were provided. We believe that SFS studies of protein fibers will become valuable assets for applications such as tissue engineering and amyloid disease prevention.
Acknowledgments
The authors thank Olle Inganäs for the financial support via the Knut and Alice Wallenberg Foundation, Niclas Solin for the valuable discussions, Ron Seifert for the SHG instrument time and supervision, as well as Sylvie Roke for the helpful discussions regarding the SFS scattering setup. This research was supported by NSF Grant No. CBET-1125791 and NIH Grant No. EB-002027 to the National ESCA and Surface Analysis Center for Biomedical Problems.
Supporting Information Available
Animated 3D-stack of the collagen fiber network. This material is available free of charge via the Internet at http://pubs.acs.org.
The authors declare no competing financial interest.
Funding Statement
National Institutes of Health, United States
Supplementary Material
References
- Hardy J.; Selkoe D. J. Science 2002, 297, 353–356. [DOI] [PubMed] [Google Scholar]
- Kahn S. E.; Andrikopoulos S.; Verchere B. C. Diabetes 1999, 48, 241–253. [DOI] [PubMed] [Google Scholar]
- Provenanzo P. P.; Vanderby V. Jr. Matrix Biol. 2006, 25, 71–84. [DOI] [PubMed] [Google Scholar]
- Harris J. R.; Reiber A. Micron 2007, 38, 513–521. [DOI] [PubMed] [Google Scholar]
- Chernoff E. A. G.; Chernoff D. A. J. Vac. Sci. Technol., A 1992, 104596–599. [Google Scholar]
- Bozec L.; Horton M. Biophys. J. 2005, 88, 4223–4231. [DOI] [PMC free article] [PubMed] [Google Scholar]
- Orgel J. P. R. O.; Irving T. C.; Miller A.; Wess T. J. Proc. Natl. Acad. Sci. U. S. A. 2006, 103249001–9005. [DOI] [PMC free article] [PubMed] [Google Scholar]
- Bella J.; Eaton M.; Brodsky B.; Berman H. M. Science 1994, 266518275–81. [DOI] [PubMed] [Google Scholar]
- Li M.-H.; Fan P.; Brodsky B.; Baum J. Biochemistry 1993, 32297377–7387. [DOI] [PubMed] [Google Scholar]
- Chen X.; Nadiarynkh O.; Plotnikov S.; Campagnola P. J. Nat. Protoc. 2012, 74654–669. [DOI] [PMC free article] [PubMed] [Google Scholar]
- Reiser K. M.; McCourt A. B.; Yankelevich D. R.; Knoesen A. Biophys. J. 2012, 103, 2177–2186. [DOI] [PMC free article] [PubMed] [Google Scholar]
- Rocha-Mendoza I.; Yankelevich D. R.; Wang M.; Reiser K. M.; Frank C. W.; Knoesen A. Biophys. J. 2007, 93, 4433–4444. [DOI] [PMC free article] [PubMed] [Google Scholar]
- Roke S.; Roeterdink W. G.; Wijnhoven J. E. G. J.; Petukhov A. V.; Kleyn A. W.; Bonn M. Phys. Rev. Lett. 2003, 91251–4. [DOI] [PubMed] [Google Scholar]
- Roke S.; Gonella G. Annu. Rev. Phys. Chem. 2012, 63, 353–378. [DOI] [PubMed] [Google Scholar]
- de Beer A. G. F.; Roke S. J. Chem. Phys. 2010, 132231–7. [DOI] [PubMed] [Google Scholar]
- Strader M. L.; de Aguiar H. B.; de Beer A. G. F.; Roke S. Soft Matter 2011, 7, 4959–4963. [Google Scholar]
- Williams B. R.; Gelman R. A.; Poppke D. C.; Piez K. A. J. Biol. Chem. 1978, 253186578–6585. [PubMed] [Google Scholar]
- Chu G. H.Process for Preparing Malleable Collagen and the Product Thereof. U.S. Patent 4,557,764, September 5, 1984.
- de Beer A. G. F.; de Aguiar H. B.; Niijsen J. F. W.; Roke S. Phys. Rev. Lett. 2009, 10291–4. [DOI] [PubMed] [Google Scholar]
- de Beer A. G. F.; Roke S. Phys. Rev. B 2007, 75241–8. [Google Scholar]
- de Beer A. G. F.; Campen R. K.; Roke S. Phys. Rev. B 2010, 82231–9. [Google Scholar]
- Roke S.; Bonn M.; Petukhov A. V. Phys. Rev. B 2004, 70111–10. [Google Scholar]
- de Aguiar H. B.; Scheu R.; Jena K. C.; de Beer A. G. F.; Roke S. Phys. Chem. Chem. Phys. 2012, 14, 6826–6832. [DOI] [PubMed] [Google Scholar]
- de Beer A. G. F.; Roke S.; Dadap J. I. J. Opt. Soc. Am. 2011, 2861374–1384. [Google Scholar]
- Vidal F.; Tadjeddine A. Rep. Prog. Phys. 2005, 68, 1095–1127. [Google Scholar]
- Piez K. A.; Miller A. J. Supramol. Struct. 1974, 2, 121–137. [DOI] [PubMed] [Google Scholar]
- Kadler K. E.; Holmes D. F.; Trotter J. A.; Chapman J. A. Biochem. J. 1996, 316, 1–11. [DOI] [PMC free article] [PubMed] [Google Scholar]
- Lazarev Y. A.; Grishkovsky B. A.; Khromova T. B. Biopolymers 1985, 24, 1449–1478. [DOI] [PubMed] [Google Scholar]
- Bryan M. A.; Brauner J. W.; Anderle G.; Flach C. R.; Brodsky B.; Mendelsohn R. J. Am. Chem. Soc. 2007, 129, 7877–7884. [DOI] [PMC free article] [PubMed] [Google Scholar]
- de Beer A. G. F.; Samson J.-S.; Hua W.; Huang Z.; Chen X.; Allen H. C.; Roke S. J. Chem. Phys. 2011, 135221–9. [DOI] [PubMed] [Google Scholar]
- Vácha R.; Rick S. W.; Jungwirth P.; de Beer A. G. F.; Aguiar H. B.; Samson J.-S.; Roke S. J. Am. Chem. Soc. 2011, 1332610204–10210. [DOI] [PubMed] [Google Scholar]
Associated Data
This section collects any data citations, data availability statements, or supplementary materials included in this article.


