Abstract
Objective
To use evoked (M-wave) and voluntary (during maximal voluntary contraction (MVC)) EMG recordings to estimate the voluntary activation level in chronic stroke.
Methods
Nine chronic hemiparetic stroke subjects participated in the experiment. M-wave (EMGM-wave) and MVC (EMGMVC) EMG values of the biceps brachii muscles were recorded.
Results
Peak torque was significantly smaller on the impaired than non-impaired side. EMGM-wave was also significantly smaller on the impaired than non-impaired side. However, the normalized EMGM-wave/TorqueMVC ratio was not significantly different between two sides. In contrast, both absolute EMGMVC and normalized EMGMVC/TorqueMVC were smaller on the impaired than non-impaired side. The voluntary activation level, EMGMVC/M-wave, was also smaller on the impaired than non-impaired side. The voluntary activation level on the impaired side was highly correlated with weakness (R=0.72), but very low (R=0.32) on the non-impaired side.
Conclusion
Collectively, our findings suggest that both peripheral and central factors contribute to post-stroke weakness, but activation deficit correlates most closely with weakness as estimated from maximum voluntary torque generation.
Keywords: stroke, weakness, voluntary activation, EMG, M-wave
Introduction
Weakness after stroke is widely observed clinically, and is reported to be the primary contributor to impaired voluntary force control (Chang et al. , 2013) and to functional impairments in chronic stroke (Kamper et al. , 2006). Weakness is highly correlated with the severity of initial damage to the corticospinal tracts in the acute phase (Small et al. , 2013). In the course of recovery, both central and peripheral mechanisms contribute to weakness as a result of neural plasticity, adaptation, exercises and therapies. Peripheral factors such as muscle fiber loss, fat infiltration, altered contractile properties have also been reported (reviewed in (Gracies, 2005)). Muscle size estimated by MRI or ultrasound (Klein et al. , 2010, Klein et al., 2013, Knarr et al., in press, Triandafilou and Kamper, 2012) shows small to minimal changes on the impaired side. Furthermore, these estimates do not reflect altered contractile properties of the impaired muscle. As such, these observed changes are not sufficient to account for weakness on the impaired side. For example, the force generating ability of the paretic plantar flexors is overestimated using the muscle volume obtained from MRI (Knarr et al. in press). Thus, these findings suggest an important role for central factors.
The primary central factor is an inability to fully activate the muscles (i.e., voluntary activation deficit) on the impaired side (Miller et al. , 2009). Voluntary activation level is commonly examined non-invasively using the interpolated twitch technique (ITT) (Allen et al., 1998, Shield and Zhou, 2004, Yue et al., 2000), in which supra-maximal electrical stimulation is applied to the muscle during maximal voluntary contraction (MVC) of the target muscle. The ratio of MVC to the superimposed evoked force provides an estimate of the degree of muscle activation. However, there are methodological concerns linked to the fact that a conventional linear model is used in ITT, while voluntary activation level usually displays a non-linear relationship with voluntary force (Herda et al. , 2011, Huang et al. , 2010, Shield and Zhou, 2004). Therefore, voluntary activation level may not be accurately estimated using ITT (de Haan et al. , 2009). Bu the ITT techniques are still extremely useful to compare activation deficit between groups or in the same people over time.
To address these limitations, we used M-wave EMG recordings to reflect peripheral neuromuscular capabilities, and EMG recordings during MVC of the target muscle to reveal maximal voluntary activation. The ratio of MVC EMG and M-wave EMG provided an estimate of voluntary activation level. Accordingly, our specific aims were 1) to compare peripheral neuromuscular capabilities (M-wave EMG), maximal voluntary activation (MVC EMG), and voluntary activation level (the ratio) of the biceps brachii muscle between impaired and non-impaired side in hemispheric stroke survivors, 2) to correlate voluntary activation level with weakness.
Methods
Nine chronic hemiparetic stroke subjects (6 male, 3 female; mean: 62.7 years of age; months after stroke: 45.3, ranging from 28 to 93; Modified Ashworth Scale (MAS) 0, 1, and 1+) participated in the experiment. Inclusion criteria were: 1) hemiplegia secondary to an ischemic or hemorrhage stroke; 2) at least 6 months post-stroke; 3) spastic hypertonia in elbow flexors of the impaired side, rated as MAS less than 3, such that subjects could be comfortably positioned in the described configuration; 4) able to produce voluntary elbow flexion on the impaired side; and 5) able to give informed consent. Exclusion criteria included: 1) a history of multiple strokes or bilateral involvement; 2) presence of contracture that would limit full elbow range of motion on the impaired side; 3) visual impairment including neglect. All subjects gave written informed consent prior to their participation. This study was approved by the Committee for the Protection of Human Subjects at the University of Texas Health Science Center at Houston and TIRR Memorial Hermann Hospital.
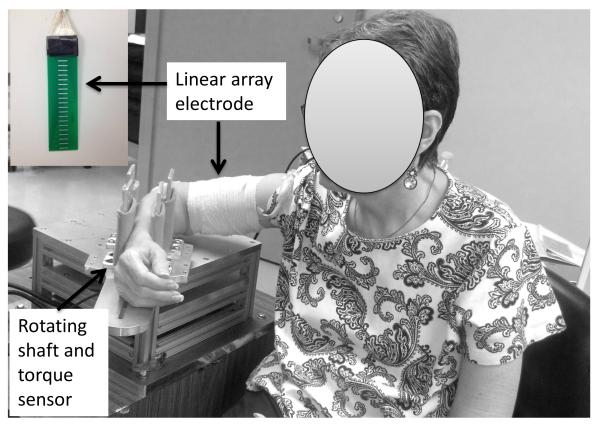
Subjects were seated comfortably on a height-adjustable chair. The arm to be tested was secured firmly on a customized apparatus with the elbow joint at approximately 90° of flexion and the shoulder at approximately 45° of abduction and 30° of flexion. Subjects were instructed to naturally rest the wrist joint (Figure 1). Two pairs of vertical plates at proximal and distal forearm were used for stabilization as in our previous study (Chang et al. 2013). After skin preparation, a custom-made linear electrode array was placed from the proximal to distal tendon junction of biceps brachii muscle. The array has 20 bars (1mm width, 10mm length) arranged in linear manner with 5mm distance between each bar. The reference electrode was attached to the lateral condyle of the humerus of the test arm. The surface EMG signals were recorded using the Porti EMG system (TMS International, The Netherlands, sampling frequency 2000Hz/channel, bandwidth: 10-500 Hz).
Figure 1.
Experimental settings
The following two conditions were tested in a randomized order on each side: 1) the MVC condition: subjects were asked to perform maximum voluntary contraction (MVC) of elbow flexion against the vertical plates 3 times. Each trial lasted 10 seconds. Subjects received strong verbal encouragement during MVC attempts. At least 20 seconds, or longer if requested, were required for rest after each trial. Torque during MVC tasks was recorded via a torque sensor (Model TRS 500, Transducers Techniques, CA). The trial with the greatest torque value (TorqueMVC) was selected; 2) The M-wave condition: electrical stimulation was delivered to the musculocutaneous nerve at the intensity that generated a maximum response using an electrical stimulator (D7SA, Digitimer Ltd, Hertfordshire, England). Electrical stimulation was triggered manually. The placement of surface stimulator electrodes in the proximal upper arm (Calder et al., 2005) was confirmed when elbow flexion and forearm supination was visible but with no finger/wrist flexion at low to moderate intensity of electrical stimulation. The maximum response (M-wave) was reached when there was no further increase in the on-line EMG response at a higher intensity of electrical stimulation. The same experimental configuration was assured during two conditions.
EMG signals were saved for offline analysis using a customized MATLAB (The MathWorks Inc.) program. For both conditions, 19 bipolar signals were constructed from the 20 monopolar signals recorded from the linear electrode array. In the M-wave condition, compound muscle action potentials (CMAPs) were contaminated by stimulus artifacts. We used a method combining a Savitzky-Golay filter, Otsu’s thresholding and smoothing algorithms to remove stimulus artifacts (Liu et al., in press). The channel with the highest peak-to-peak value in the M-wave condition was selected (EMGM-wave). The highest peak-to-peak value on the same channel in the MVC condition (EMGMVC) was then measured. By selecting the same channel on the linear array electrode, the possible effect of electrode placement on EMG measurement was thus minimized. This effect has been reported recently (Herda et al., 2013).
The following variables were recorded: EMGM-wave, EMGMVC, peak torque (TorqueMVC), on each side as above described. The ratio EMGMVC/M-wave was then computed to estimate the level of voluntary activation on each side. As mentioned in the Introduction, we did not intend to compare mechanical outputs (force or torque) of the biceps muscles between MVC and M-wave conditions because of the non-linearity. Further, we noticed increased elbow flexion and wrist/finger flexion responses during electrical stimulation at the intensity much higher than the M-wave intensity. This is likely due to volume conduction of electrical stimulation to adjacent muscles and nerves. Other muscles (wrist and finger flexors) may also contribute to the evoked elbow flexion torque secondary to possible volume stimulation during the M-wave condition. However, TorqueMVC was used to estimate relative strength between two sides and to normalize individual absolute values. Therefore, the ratios of EMGM-wave/TorqueMVC and EMGMVC/TorqueMVC were computed. Weakness was defined as the ratio of TorqueMVC on the impaired side to the non-impaired side.
Paired t-tests were used to compare EMGM-wave, EMGMVC, TorqueMVC, EMGMVC/M-wave between two sides. Linear regression analysis between EMGMVC/M-wave and Weakness was performed for each side. The level of significance was set at p<0.05.
Results
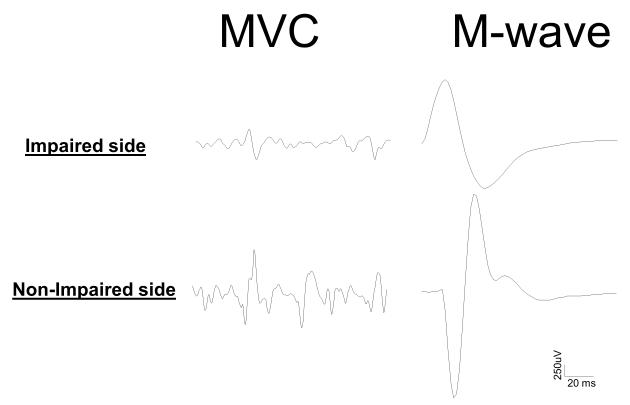
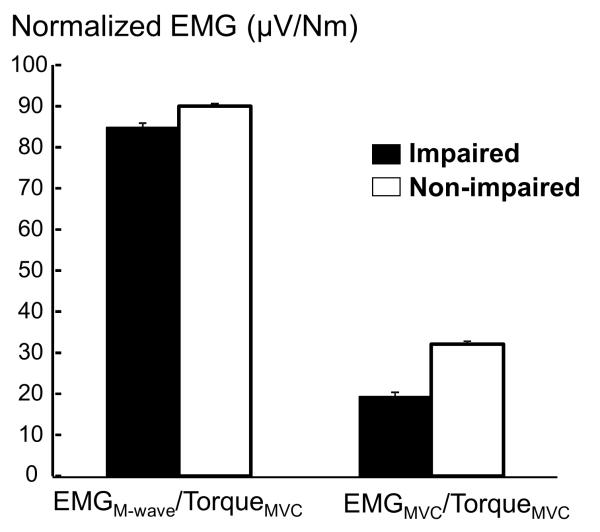
Peak torque (TorqueMVC) of voluntary elbow flexion, as expected, was significantly smaller on the impaired side than on the non-impaired side (27.9 Nm vs. 44.5Nm, p=0.04). Surface EMG signals using a linear array electrode were recorded from the biceps muscle on each side during both M-wave and MVC conditions. As shown in Figure 2, stimulus artifacts have been successfully removed. Peak-to-Peak EMG values (EMGM-wave and EMGMVC) during two conditions revealed different patterns. Both absolute EMGM-wave and EMGMVC were significantly smaller on the impaired side than on the non-impaired side (EMGM-wave: 1743.7 uV vs. 3269.2 uV, p<0.0002; EMGMVC: 588.0 uV vs. 1410.9 uV, p=0.01). However, the normalized EMGM-wave (EMGM-wave/TorqueMVC) was not significantly different between two sides (85.2 vs. 90.0 uV/Nm, p=0.81). In contrast, the normalized EMGMVC (EMGMVC/TorqueMVC) was significantly smaller on the impaired side than non-impaired side (19.6 vs. 32.1 uV/Nm, p=0.04) (Figure 3). The voluntary activation level, estimated by EMGMVC/M-wave, was smaller, but not statistically significant, on the impaired side than on non-impaired side (0.27 vs. 0.40, p=0.08).
Figure 2.
Example recordings from impaired and non-impaired sides of a stroke subject during both MVC and M-wave conditions. Note that stimulus artifacts have been successfully removed.
Figure 3.
Peak-to-peak EMG values normalized by MVC torques during MVC (EMGMVC/TorqueMVC) and M-wave (EMGM-wave/TorqueMVC) conditions for both impaired and non-impaired sides. Mean and standard errors are presented.
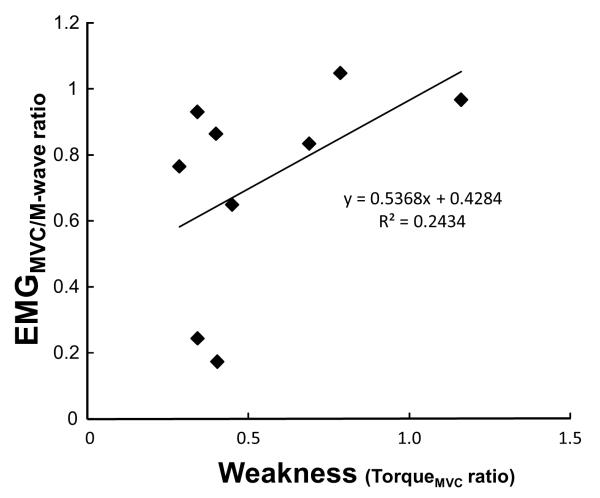
Using linear regression analysis, the voluntary activation level (EMGMVC/M-wave) was significantly correlated with weakness (R=0.72, p<0.05) on the impaired side, but very low (R=0.32) on non-impaired side. The relative voluntary activation level (EMGMVC/M-wave ratio between the impaired and non-impaired side), however, showed a moderate level of correlation with weakness (R=0.49, p<0.05) (Figure 4).
Figure 4.
Linear regression analysis between the relative level of voluntary activation (ratio of EMGMVC/M-wave) and weakness (ratio of TorqueMVC) between the impaired and non-impaired sides.
Discussion
In the present study, we examined possible central and peripheral mechanisms for post-stroke weakness by comparing M-wave and MVC EMG recordings from both impaired and non-impaired sides in chronic stroke subjects. The M-wave EMG findings (lower absolute EMGM-wave, but similar normalized EMGM-wave on the impaired side) suggested that peripheral neuromuscular capability was significantly decreased on the impaired side, but the change was proportional to force generating capabilities. In contrast, the MVC EMG data (smaller absolute and normalized EMGMVC and its correlation with weakness on the impaired side) suggested maximal voluntary activation was significantly decreased on the impaired side and correlated with force generating capabilities. Taken together, these findings provide evidence that voluntary activation deficit further decreases voluntary force generating capabilities on the impaired side, in addition to diminished peripheral neuromuscular capabilities, such as atrophy and altered contractile properties. The result of a moderate correlation between the relative voluntary activation and weakness (Figure 4) further support the important role of voluntary activation deficit in weakness. This is consistent with an earlier report that the force generating ability of the paretic plantar flexors is overestimated by the size of the paretic muscle (Knarr et al., in press). Overall, these findings using M-wave and MVC EMG comparisons in this study are consistent with previous findings obtained from other techniques (MRI, ultrasound, ITT as mentioned in the Introduction section). All suggest the important role of voluntary activation deficit in post-stroke weakness.
M-wave recordings have been shown to be reliable and consistent across trials and subjects (Calder et al., 2005). It is commonly used as a reference value to reflect peripheral neuromuscular capabilities in both healthy subjects and stroke patients (Fimland et al. , 2011, Klein et al., 2010). The present study is the first report to compare M-wave and MVC EMG recordings for evaluation of voluntary activation. This method primarily compares the EMG values of the same muscle when it is voluntarily activated or externally triggered by an electrical stimulator. Thus it is able to avoid the possible limitations by the commonly used interpolated twitch technique (ITT). These limitations include 1) volume stimulation to agonist nerve/muscles, e.g., voluntary activation of brachioradialis that contributes to elbow flexion torque during assessment of maximal voluntary activation of biceps brachii muscle (Allen et al., 1998); 2) volume stimulation to antagonist muscles (Awiszus et al. , 1997) that could decrease the torque output of the agonist; 3) the non-linear relationship between activation levels and the muscle force (Huang et al., 2010). On the other hand, imaging techniques, such as MRI and ultrasound, can accurately estimate peripheral structural changes of the paretic muscle, but not its contractile properties. This leads to an inability to accurately estimate muscle strength from structural changes (Knarr et al., in press). The M-wave and MVC EMG comparison method compares, at least indirectly, structural and contractile properties of the muscles. However, this method avoids comparisons of mechanical outputs (elbow flexion torque), thus ignoring possible influence on elbow flexion torque from synergist and antagonist muscles. In a study that examined pathophysiology of post-stroke fatigue, the authors reported significant reduction in M-wave and twitch peak torque after fatiguing exercises. The authors attributed the M-wave reduction to peripheral fatigue (Knorr et al. , 2011). Therefore, the M-wave and MVC EMG comparison method provide a useful tool to examine voluntary activation. It provides an alternative physiological method when ITT or other methods involving mechanical measurement are not available or appropriate.
This method has limitations as well. Since supramax level of electrical stimulation is often used in the M-wave condition, EMGM-wave may collect EMG from adjacent muscles and overestimate the true value. The method does not quantify contributions of central and peripheral mechanisms. It is not able to provide the origin of central activation deficit either. EMGM-wave is usually comparable between two sides in stroke subjects (Knorr et al., 2011). Smaller EMGM-wave in this study may be attributed to disuse atrophy and/or motor units reorganization in stroke subjects with severe weakness (Lukacs, 2005, Lukacs et al., 2008, 2009). Imaging studies (such as MRI or ultrasound) for peripheral structural change could provide further helpful information. Therefore, the combined use of EMG and ITT techniques is able to provide complementary mechanical and physiological approaches to augment each other for best understanding of muscle activation deficit.
These findings also support the potential benefit from high-intensity exercises to enhance central activation for facilitation of motor recovery. There is growing evidence that patients after stroke receive more neuromechanical and functional gains after high-intensity training (Patten et al., 2013) or even maximal strengthening (Hill et al., 2012) of the impaired side in chronic stroke survivors. In a recent study (Dragert and Zehr, 2013), it is also reported that unilateral dorsiflexor high-intensity resistance training in the non-impaired side of chronic stroke survivors results in significant increase in voluntary strength of bilateral dorsiflexors. Significant gain of voluntary muscle strength on the untrained, impaired side is, however, considered to be mediated by increased central activation through clinical application of the cross-education effect (Dragert and Zehr, 2013).
Conclusion
Collectively, by comparing M-wave and MVC EMG values, our findings suggest both peripheral and central factors contribute to post-stroke weakness, but activation deficit correlates most closely with weakness. These findings also provide further evidence to highlight the potential benefit from high-intensity exercises to enhance central activation for facilitation of motor recovery.
Highlights.
A novel method using evoked (M-wave) and voluntary (MVC) EMG recordings was used to estimate the voluntary activation level in chronic stroke;
Decreased M-wave values were proportional between impaired and non-impaired biceps, but MVC EMG values were further decreased on the impaired side and highly correlated with weakness;
Both peripheral and central factors contribute to post-stroke weakness, but activation deficit correlates most closely with weakness as estimated from maximum voluntary torque generation
Significance.
These findings serve to highlight the potential benefit from high-intensity exercises to enhance central activation for facilitation of motor recovery.
Acknowledgement
We thank anonymous reviewers for their constructive comments and suggestions. This study was supported in part by NIH grants (R01NS060774 and R24 HD050821-08 under subcontract with Rehabilitation Institute of Chicago)
Footnotes
Publisher's Disclaimer: This is a PDF file of an unedited manuscript that has been accepted for publication. As a service to our customers we are providing this early version of the manuscript. The manuscript will undergo copyediting, typesetting, and review of the resulting proof before it is published in its final citable form. Please note that during the production process errors may be discovered which could affect the content, and all legal disclaimers that apply to the journal pertain.
REFERENCES
- Allen GM, McKenzie DK, Gandevia SC. Twitch interpolation of the elbow flexor muscles at high forces. Muscle Nerve. 1998;21:318–28. doi: 10.1002/(sici)1097-4598(199803)21:3<318::aid-mus5>3.0.co;2-d. [DOI] [PubMed] [Google Scholar]
- Awiszus F, Wahl B, Meinecke I. Influence of stimulus cross talk on results of the twitch-interpolation technique at the biceps brachii muscle. Muscle Nerve. 1997;20:1187–90. doi: 10.1002/(sici)1097-4598(199709)20:9<1187::aid-mus17>3.0.co;2-q. [DOI] [PubMed] [Google Scholar]
- Calder KM, Hall LA, Lester SM, Inglis JG, Gabriel DA. Reliability of the biceps brachii M-wave. J Neuroeng Rehab. 2005;2:1. doi: 10.1186/1743-0003-2-33. [DOI] [PMC free article] [PubMed] [Google Scholar]
- Chang SH, Francisco GE, Zhou P, Rymer WZ, Li S. Spasticity, weakness, force variability, and sustained spontaneous motor unit discharges of resting spastic-paretic biceps brachii muscles in chronic stroke. Muscle Nerve. 2013;48:85–92. doi: 10.1002/mus.23699. [DOI] [PMC free article] [PubMed] [Google Scholar]
- de Haan A, Gerrits KH, de Ruiter CJ. Counterpoint: the interpolated twitch does not provide a valid measure of the voluntary activation of muscle. J applphysiol. 2009;107:355–7. doi: 10.1152/japplphysiol.91220.2008a. [DOI] [PubMed] [Google Scholar]
- Dragert K, Zehr EP. High-intensity unilateral dorsiflexor resistance training results in bilateral neuromuscular plasticity after stroke. Exp Brain Res. 2013;225:93–104. doi: 10.1007/s00221-012-3351-x. [DOI] [PubMed] [Google Scholar]
- Fimland MS, Moen PMR, Hill T, Gjellesvik TI, Tørhaug T, Helgerud J, et al. Neuromuscular performance of paretic versus non-paretic plantar flexors after stroke. Eu J ApplPhysiol. 2011;111:3041–9. doi: 10.1007/s00421-011-1934-z. [DOI] [PMC free article] [PubMed] [Google Scholar]
- Gracies JM. Pathophysiology of spastic paresis. I: Paresis and soft tissue changes. Muscle Nerve. 2005;31:535–51. doi: 10.1002/mus.20284. [DOI] [PubMed] [Google Scholar]
- Herda TJ, Walter AA, Costa PB, Ryan ED, Hoge KM, Stout JR, et al. Percent voluntary inactivation and peak force predictions with the interpolated twitch technique in individuals with high ability of voluntary activation. Physiol Meas. 2011;32:1591–603. doi: 10.1088/0967-3334/32/10/007. [DOI] [PubMed] [Google Scholar]
- Herda TJ, Zuniga JM, Ryan ED, Camic CL, Bergstrom HC, Smith DB, et al. Quantifying the effects of electrode distance from the innervation zone on the electromyographic amplitude versus torque relationships. Physiol Meas. 2013;34:315–24. doi: 10.1088/0967-3334/34/3/315. [DOI] [PubMed] [Google Scholar]
- Hill TR, Gjellesvik TI, Moen PM, Tørhaug T, Fimland MS, Helgerud J, et al. Maximal strength training enhances strength and functional performance in chronic stroke survivors. Am J Phy Med Rehab. 2012;91:393–400. doi: 10.1097/PHM.0b013e31824ad5b8. [DOI] [PubMed] [Google Scholar]
- Huang YM, Hsu MJ, Lin CH, Wei SH, Chang YJ. The non-linear relationship between muscle voluntary activation level and voluntary force measured by the interpolated twitch technique. Sensors. 2010;10:796–807. doi: 10.3390/s100100796. [DOI] [PMC free article] [PubMed] [Google Scholar]
- Kamper DG, Fischer HC, Cruz EG, Rymer WZ. Weakness Is the Primary Contributor to Finger Impairment in Chronic Stroke. Arch Phy MedRehab. 2006;87:1262. doi: 10.1016/j.apmr.2006.05.013. [DOI] [PubMed] [Google Scholar]
- Klein CS, Brooks D, Richardson D, McIlroy WE, Bayley MT. Voluntary activation failure contributes more to plantar flexor weakness than antagonist coactivation and muscle atrophy in chronic stroke survivors. J ApplPhysiol. 2010;109:1337–46. doi: 10.1152/japplphysiol.00804.2009. [DOI] [PubMed] [Google Scholar]
- Klein CS, Power GA, Brooks D, Rice CL. Neural and muscular determinants of dorsiflexor weakness in chronic stroke survivors. Motor Control. 2013;17:283–97. doi: 10.1123/mcj.17.3.283. [DOI] [PubMed] [Google Scholar]
- Knarr BA, Ramsay JW, Buchanan TS, Higginson JS, Binder-Macleod SA. Muscle volume as a predictor of maximum force generating ability in the plantar flexors post-stroke. Muscle Nerve. doi: 10.1002/mus.23835. in press. DOI: 10.1002/mus.23835. [DOI] [PMC free article] [PubMed] [Google Scholar]
- Knorr S, Ivanova TD, Doherty TJ, Campbell JA, Garland SJ. The origins of neuromuscular fatigue post-stroke. Exp Brain Res. 2011;214:303–15. doi: 10.1007/s00221-011-2826-5. [DOI] [PubMed] [Google Scholar]
- Liu J, Li S, Li X, Klein C, Rymer WZ, Zhou P. Suppression of stimulus artifact contaminating electrically evoked electromyography. Neurorehabilitation. doi: 10.3233/NRE-131045. in press. DOI: 10.3233/NRE-131045. [DOI] [PMC free article] [PubMed] [Google Scholar]
- Lukacs M. Electrophysiological signs of changes in motor units after ischaemic stroke. Clin Neurophysiol. 2005;116:1566–70. doi: 10.1016/j.clinph.2005.04.005. [DOI] [PubMed] [Google Scholar]
- Lukacs M, Vecsei L, Beniczky S. Large motor units are selectively affected following a stroke. Clin Neurophysiol. 2008;119:2555–8. doi: 10.1016/j.clinph.2008.08.005. [DOI] [PubMed] [Google Scholar]
- Lukacs M, Vecsei L, Beniczky S. Changes in muscle fiber density following a stroke. Clin Neurophysiol. 2009;120:1539–42. doi: 10.1016/j.clinph.2009.06.001. [DOI] [PubMed] [Google Scholar]
- Miller M, Flansbjer UB, Lexell J. Voluntary activation of the knee extensors in chronic poststroke subjects. Am J Phy MedRehab. 2009;88:286–91. doi: 10.1097/PHM.0b013e318198b569. [DOI] [PubMed] [Google Scholar]
- Patten C, Condliffe EG, Dairaghi CA, Lum PS. Concurrent neuromechanical and functional gains following upper-extremity power training post-stroke. J NeuroengRehab. 2013;10:1. doi: 10.1186/1743-0003-10-1. [DOI] [PMC free article] [PubMed] [Google Scholar]
- Shield A, Zhou S. Assessing voluntary muscle activation with the twitch interpolation technique. Sports Med. 2004;34:253–67. doi: 10.2165/00007256-200434040-00005. [DOI] [PubMed] [Google Scholar]
- Small SL, Buccino G, Solodkin A. Brain repair after stroke - A novel neurological model. Nat Rev Neurol. 2013;9:698–707. doi: 10.1038/nrneurol.2013.222. [DOI] [PMC free article] [PubMed] [Google Scholar]
- Triandafilou KM, Kamper DG. Investigation of hand muscle atrophy in stroke survivors. Clin Biomech. 2012;27:268–72. doi: 10.1016/j.clinbiomech.2011.10.002. [DOI] [PMC free article] [PubMed] [Google Scholar]
- Yue GH, Ranganathan VK, Siemionow V, Liu JZ, Sahgal V. Evidence of inability to fully activate human limb muscle. Muscle Nerve. 2000;23:376–84. doi: 10.1002/(sici)1097-4598(200003)23:3<376::aid-mus9>3.0.co;2-2. [DOI] [PubMed] [Google Scholar]


