

Abstract
A NMR protocol is introduced that permits accurate measurement of minute, remote chemical shift perturbations (CSPs), caused by a mutation-induced change in the electric field. Using protein GB3 as a model system, 1HN CSPs in K19A and K19E mutants can be fitted to small changes in the electric field at distal sites in the protein using the Buckingham equation, yielding an apparent dielectric constant εa of 8.6 ± 0.8 at 298 K. These CSPs, and their derived εa value, scale strongly with temperature. For example, CSPs at 313 K are about ∼30% smaller than those at 278 K, corresponding to an effective εa value of about 7.3 at 278 K and 10.5 at 313 K. Molecular dynamics simulations in explicit solvent indicate that solvent water makes a significant contribution to εa.
A wide range of parameters have previously been used to study electrostatics in proteins in solution, including pKa shifts of ionizable residues,1−5 redox potential shifts,6 IR vibrational Stark effects,5,7−10 and NMR chemical shifts of 19F,11−13 as well as amide 1H and 15N.13,14 To probe the electrostatics, the net charge of a residue is typically changed (either by mutagenesis or pH titration) and the perturbation of the measurement is recorded.1−4,10,13,14 However, the mutation or pH change often will also perturb the protein structure, thereby impacting the measurement. The effect of the structural perturbation, which is difficult to quantify, needs to be eliminated to allow accurate determination of the electrostatic contribution.
Here we focus on the NMR chemical shift perturbation (CSP) caused by a change in the electric field,13,14 and specifically on that of the amide proton (δHN). The strong correlation between δHN and the through-hydrogen-bond J-coupling constant, 3hJNC,15 as well as their temperature coefficients16,17 suggests that δHN is a good indicator for H-bond strength18,19 and highly sensitive to perturbation by the external electric field of the electron polarization, which is approximately along the N–H bond vector.20−22 The effect of the electric field on chemical shielding can be written as a Taylor expansion of the electric field, E.20,23,24 In solution NMR, the isotropic chemical shift is observed,13,23
| 1 |
where δHN (E) is the chemical shift in the presence of the electric field, and δHN (0) in the absence of the field; A is composed of three coefficients, derived from the dipole shielding polarizability; B and C each consist of nine coefficients, representing the dipole shielding hyperpolarizability and the quadrupole shielding polarizability, respectively; EFG is the electric field gradient. Higher order terms are neglected in eq 1.
In this work, a protocol is presented to extract the electric field information from distant CSPs. Prior studies have focused primarily on the effect of a charge change on relatively proximate nuclei, where the electric field perturbation is largest, but the effect of structural perturbation impacting the CSP then invariably is a concern too. Here, we concentrate on the much smaller CSP effects on nuclei remote from the site where the charge is changed, that is, where structural perturbation is negligible. As an added benefit, there are many more remote than proximate nuclei to probe the E field perturbation.
The third immunoglobulin binding domain of protein G, or GB3, a domain of 56 residues that has been extensively characterized by high-resolution X-ray crystallography25 and NMR,26−28 is used as the model system. To probe the electrostatic effect on chemical shifts, we focus on mutation of residue 19, which is ideally suited for our purpose. This residue is Lys in GB3, but Glu in the highly homologous GB1 domain, whose backbone coordinates appear unperturbed by the E19K side chain charge reversal when comparing the two high resolution X-ray structures.25,29 GB3 has a prolate shape with length of ∼27 Å and an aspect ratio of ca 1.7. K19 is located close to the end of its long axis, meaning that many amide groups in GB3 are spatially remote from the mutation site and structurally unperturbed. Even though the K19 amino group is exposed to solvent, this residue is located at the end of strand β2, and also makes direct contact with the well structured part of the protein, thereby reducing the effect of dielectric shielding by solvent water compared to side chains of solvent-embedded loop residues.
The minute magnitude of the E field perturbation on chemical shifts of remote nuclei requires special care to eliminate other potential effects that can impact chemical shifts, including solvent conditions and temperature. For this purpose, measurements are carried out simultaneously on a single mixed sample, containing both wild type (WT) and mutant protein, with the signals of the two proteins subsequently separated by NMR filtering methods, as described below.
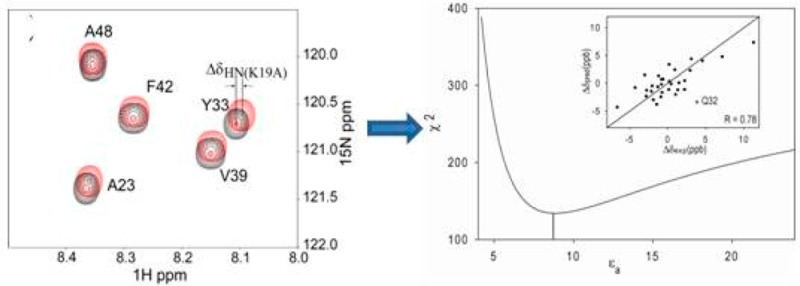
WT GB3 was uniformly enriched in 15N and 13C, whereas the two mutants, K19A and K19E, were only enriched in 15N. After mixing WT and mutant protein in buffer (20 mM sodium phosphate, 50 mM NaCl, pH 6.5), a constant-time 15N–1H HSQC experiment that includes a 13C filter was designed to separate the WT and mutant NMR signals (Supporting Information (SI) Figure S1, Figure 1A). The 1HN chemical shift differences (δK19A= δK19(15N/13C) – δA19(15N)) can be obtained from the spectra. Another measurement was carried out for a mixed sample of 15N/13C- and 15N-labeled WT GB3, from which the 13C/12C isotope effect on 1HN chemical shifts (δiso = δK19(15N/13C) – δK19(15N)) is extracted. The 1HN CSPs (ΔδK19A = δK19A – δiso) and isotope shifts (<2 ppb for most residues) are listed in SI Table S1. The random errors in the experimental CSPs are very small, ca 0.3 ppb, based on duplicate measurements. This uncertainty is very much smaller than that observed in pH titrations,13,14 which allows us to detect the minute CSPs caused by electric field changes for more and remote 1HN nuclei. When considering all residues, the correlation between 1HN ΔδK19E and ΔδK19A values is poor, in particular for residues that show large CSP effects, all of them close to the site of mutation. This observation suggests that small structure perturbations dominate these Δδ values. Instead, if we limit the comparison of ΔδK19E and ΔδK19A values to residues whose amide N atom is at a distance >12 Å from K19–Cγ (based on PDB entry 2OED(27)), and after removal of five outliers (V6, A23, E24, Y31, and F52) which at <15 Å fall close to the boundary region, a strong positive correlation is seen between 1H ΔδK19E and ΔδK19A for the remaining 32 residues (Figure 1B). The slope of 1.8 agrees well with the net charge changes (2e for K19E versus 1e for K19A), consistent with the 1H CSPs being the result of a change in the local electric field. The close-to-zero intercept indicates that the contribution from E2 is negligible (eq 1).
Figure 1.
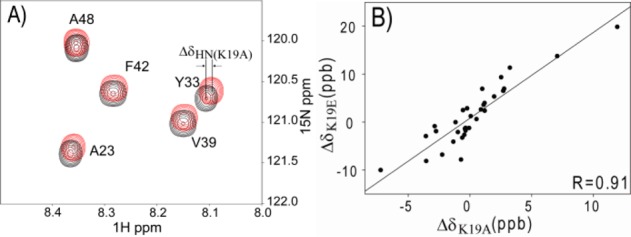
Chemical shift changes in GB3 K19A mutant. (A) Overlay of 1H–15N HSQC spectra of the mixed sample of 15N-labeled K19A (red) and 15N/13C-labeled WT GB3 (black). The spectra were recorded in an interleaved manner to eliminate any effects from possible temperature or solvent differences. The change in peak positions corresponds to the CSP caused by the mutation plus the 13C/12C isotope shift. (B) Correlation between 1H CSP values, ΔδK19E = δK19E – δiso and ΔδK19A = δK19A – δiso. The linear correlation with a slope of 1.8 and intercept of 0.7 ppb confirms that the CSP results from the E field change results from the K19 mutation. The plot includes values for 32 amides with a backbone 15N at a distance of ≥12 Å from K19–Cγ (see text).
Since the CSPs were measured in a buffered solution, the salt effect on Δδ is expected to play an important role and needs to be evaluated. We find that the ΔδK19E values measured at different sodium phosphate or sodium chloride concentrations are strongly correlated (Figure 2A). As expected from Debye–Huckel theory, the higher salt concentrations yield smaller ΔδK19E. Sodium phosphate appears to screen electrostatics similarly as sodium chloride (Figure 2B). An empirical relation, somewhat analogous to the Debye electrostatic screening factor,30 is found for the scaling, s, of the CSP effect by the ionic solution (Figure 2B):
| 2 |
where I is the ionic strength (in mM), and a and b are two fitting parameters. The ΔδK19E and ΔδK19As(I) values fall within the measurement uncertainty, and therefore are averaged when fitting eq 2 to these values. The best-fitted values for a and b are 0.076 and 0.38.
Figure 2.
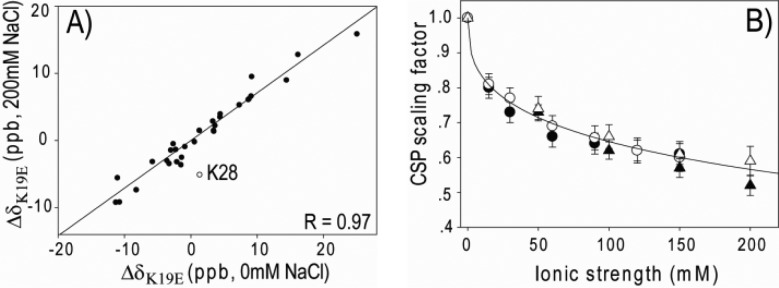
Effect of salt on the K19E CSP. (A) Correlation between ΔδK19E at high (200 mM) and low (0 mM) NaCl concentrations. The best fitted line is y = 0.71x. The slope is the CSP scaling factor due to the salt screening effect (eq 2). (B) CSP scaling factor versus ionic strength of sodium phosphate (filled (empty) circles for ΔδK19E (ΔδK19A)) and sodium chloride (filled (empty) triangles for ΔδK19E (ΔδK19A)). The curve shown is the best fit to eq 2, yielding a = 0.076 and b = 0.38. Error bars correspond to the fitting uncertainty of CSPs at different salt concentrations.
As mentioned above, our data indicate that the quadratic term in eq 1 is negligible. By also neglecting the contribution from the E field gradient at large distances from the source of the perturbation, eq 1 can be rewritten as
| 3 |
where Δδpred is the predicted chemical shift change, |A| and |E| are magnitudes of the shielding polarizability and electric field, respectively, and β is the angle between vectors A and E. Quantum mechanical MP2 calculations of the model compound N-methylacetamide (NMA) show that for an amide 1H, the A vector lies in the peptide plane at a tilt angle of 19° from the N–H bond (Scheme 1), and has an amplitude of 21 ppm-Å2/e (SI Table S2), comparable to computed values for NMA22,31 and 1H of C–H bonds of small molecules.32,33 The effect of basis sets on the results is small, and DFT calculations yield values comparable to MP2. Using the RDC-refined NMR structure of GB3 (PDB entry 2OED),27 the E field along vector A for each amide N–H pair (31 residues, excluding outlier Q32) is calculated using Coulomb’s law with partial charges for the side chain atoms of K19 and assuming a uniform dielectric constant for the system (below referred to as the apparent dielectric constant, εa). Using eq 3, Δδpred is then predicted, while systematically stepping εa, until optimal agreement with the experimental ΔδK19E and ΔδK19A1HN chemical shift changes is obtained (see SI for details). A χ2 minimum is reached for εa = 8.6 ± 0.8, corresponding to a Pearson’s correlation coefficient RP = 0.76 between experimental and predicted Δδ values (Figure 3). This εa is considerably higher than the estimated protein gas phase dielectric constant, εp, of ∼2–4.34−37 This large difference between εa and εp is not surprising considering that εa includes both the redistribution of protein charges and dipoles (εp) as well as the reorganization of solvent water caused by the K19A change in charge.
Scheme 1. Definition of the coordinate System for the Model Compound NMA.
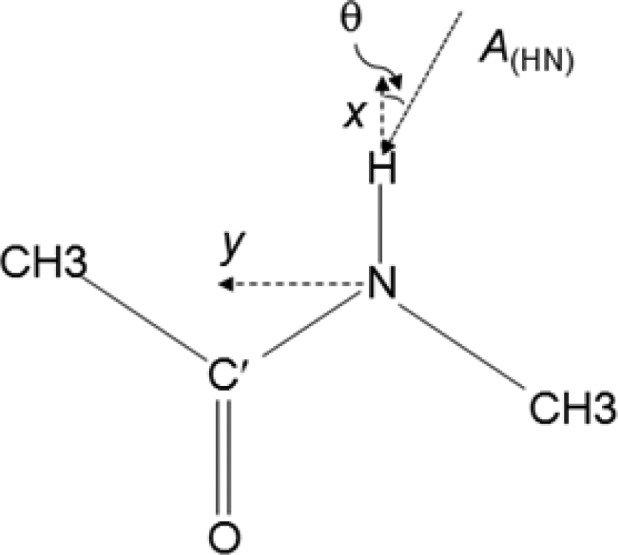
The origin is set at the N atom; N, C′, and H fall in the xy plane and the x-axis corresponds to the N–H bond vector. The θ angle is defined by the angles between vector A and the N–H bond.
Figure 3.

χ2 fitting error of CSPs as a function of εa, with χ2 = Σ(Δδpred – Δδexp)2, excluding the outlier Q32, at 298 K. The minimum χ2 is obtained for εa = 8.6.
Assuming the protein itself has an εp of ∼2–4, the electric field screening by water reorganization, εa/εp, falls in the 2.2–4.3 range. Experimental measurement of the effect of water reorganization on εa is a notoriously difficult problem. Instead, we here resort to molecular dynamics (MD) simulations in explicit solvent to estimate this effect. A 0.5-μs MD trajectory using the TIP3P water model38 was carried out for WT (K19), as well as K19A and K19E mutants. The electric field difference along the A direction of the 31 CSP sites, used for the dielectric constant fitting, was calculated for WT (K19) and K19A mutant proteins from the MD trajectories, showing a negative correlation with the total E-field generated by the water molecules at each of these 31 sites (Figure 4A), confirming that the water reaction field opposes and thereby attenuates the direct effect of the charge mutation. The fitted slope of −0.76 indicates that the reaction field is quite large for the present case, corresponding to a factor of 1/(1 – 0.76) = 4.2. When comparing the water reaction fields in the MD trajectories of K19A and K19E, a very similar screening factor of 3.7 is obtained (Figure 4B). This result confirms that water plays a key role in the protein intramolecular electrostatic interactions, especially for a protein as small as GB3, with the effect of water being amplified by the charge change being on the protein surface. The εa value is likely to vary substantially at sites with different water accessibilities, however. The value of εa will also be impacted by the sourroundings of the mutated site where the clustering of polar or charged residues tends to screen the E field more effectively than the protein bulk. A recent study by Kukic et al.14 reports εa values ranging from 3 to 17, reflecting the impact of variations in local environment on E field screening.
Figure 4.
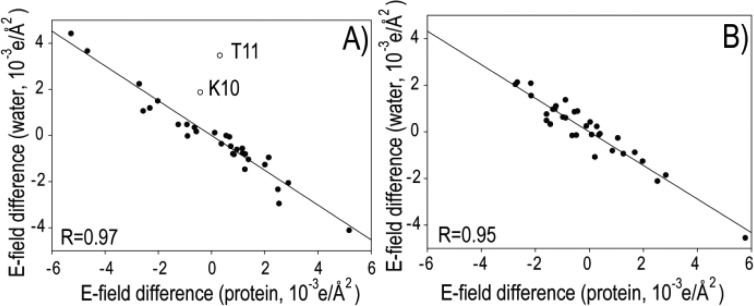
Effect of solvent water on electric field screening from MD simulations. Correlation between the calculated E field differences along the A vector at the 31 CSP sites, obtained from 0.5-μs MD simulations. The x-axis is the E field difference for (A) E(WT) – E(K19A), or (B) E(K19E) – E(K19A), whereas the y-axis is the difference created by the solvent water molecules. The best fitted lines are (A) y = −0.76x and (B) y = −0.73x.
ΔδK19E and ΔδK19A values were also measured as a function of temperature. We find that CSPs are generally smaller at higher temperature (Figure 5 and SI, Figure S2). For example, CSPs at 313 K are ∼32% smaller than at 278 K, indicating that the net E field decreases with temperature, corresponding to an εa increase from 7.3 at 278 K to 10.5 at 313 K. This increase in εa likely is dominated by better solvation of the mutated side chain, resulting in stronger electrostatic screening. In other words, at higher temperature the mutated side chain becomes more dynamic and better hydrated. Therefore, even though the dielectric constant of water decreases somewhat with increasing temperature, the large difference between εp and εsolvent then renders the net screening more effective. Meanwhile, the Kirkwood–Fröhlich formalism predicts that increased fluctuations in the local protein dipole moments, associated with higher temperature, will also increase εp.39 Although the exact mechanism for the εa temperature dependence remains subject to debate, the experimental observation itself is quite unambiguous. It is also worth noting that even though the value extracted for εa depends strongly on the computationally derived dipole shielding polarizability, A, our conclusions regarding the effects of salt and temperature on εa are independent of A.
Figure 5.

Effect of temperature, T, on measured ΔδK19E. (A) Correlation between ΔδK19E at high (313 K) and low (278 K) temperatures. Excluding three outliers (K28, Q32, and D46), the best fitted line is y = 0.67x. The slope corresponds to the CSP ratio, which is shown as a function of T (B). The slope decreases as T increases, indicating that the CSPs decrease with increasing T, i.e., the electric field is screened more efficiently at high T.
Our study has shown that, perhaps counterintuitively, E field effects on chemical shifts are best studied at sites remote from where the electric charge change is made. Apparently the effect of structural perturbation induced by the charge drops off faster with distance than the change in E-field it causes. We have shown that even very small CSPs can be accurately measured with the newly introduced isotope labeling and filtering schemes, and even higher accuracy of the experimental CSP values should be attainable if perdeuteration of the protein is used. Our approach therefore opens a new way for the systematic study of protein electrostatics in a wide range of systems.
Acknowledgments
This work was supported in part by the 100 Talent Project of Chinese Academy of Sciences, National Nature Science Foundation of China (Grant No. 21173247 and 31270785 to L.Y.) and the Foundation for Outstanding Young Scientist in Shandong Province (Grant No. JQ201104 to L.Y. and ZR2011BQ008 to Y.W.). A.B. is supported by the Intramural Research Program of the NIDDK, National Institutes of Health (NIH).
Supporting Information Available
Experimental prodedures and additional data. This material is available free of charge via the Internet at http://pubs.acs.org.
The authors declare no competing financial interest.
Funding Statement
National Institutes of Health, United States
Supplementary Material
References
- Isom D. G.; Castaneda C. A.; Velu P. D.; Garcia-Moreno B. Proc. Natl. Acad. Sci. U.S.A. 2010, 107, 16096. [DOI] [PMC free article] [PubMed] [Google Scholar]
- Isom D. G.; Castaneda C. A.; Cannon B. R.; Garcia-Moreno B. E. Proc. Natl. Acad. Sci. U.S.A. 2011, 108, 5260. [DOI] [PMC free article] [PubMed] [Google Scholar]
- Lee K. K.; Fitch C. A.; Garcia-Moreno B. Protein Sci. 2002, 11, 1004. [DOI] [PMC free article] [PubMed] [Google Scholar]
- Baran K. L.; Chimenti M. S.; Schlessman J. L.; Fitch C. A.; Herbst K. J.; Garcia-Moreno B. E. J. Mol. Biol. 2008, 379, 1045. [DOI] [PubMed] [Google Scholar]
- Suydam I. T.; Snow C. D.; Pande V. S.; Boxer S. G. Science 2006, 313, 200. [DOI] [PubMed] [Google Scholar]
- Mao J. J.; Hauser K.; Gunner M. R. Biochemistry 2003, 42, 9829. [DOI] [PubMed] [Google Scholar]
- Suydam I. T.; Boxer S. G. Biochemistry 2003, 42, 12050. [DOI] [PubMed] [Google Scholar]
- Fafarman A. T.; Webb L. J.; Chuang J. I.; Boxer S. G. J. Am. Chem. Soc. 2006, 128, 13356. [DOI] [PMC free article] [PubMed] [Google Scholar]
- Sigala P. A.; Fafarman A. T.; Bogard P. E.; Boxer S. G.; Herschlag D. J. Am. Chem. Soc. 2007, 129, 12104. [DOI] [PMC free article] [PubMed] [Google Scholar]
- Fafarman A. T.; Sigala P. A.; Schwans J. P.; Fenn T. D.; Herschlag D.; Boxer S. G. Proc. Natl. Acad. Sci. U.S.A. 2012, 109, E299. [DOI] [PMC free article] [PubMed] [Google Scholar]
- Chambers S. E.; Lau E. Y.; Gerig J. T. J. Am. Chem. Soc. 1994, 116, 3603. [Google Scholar]
- Pearson J. G.; Oldfield E.; Lee F. S.; Warshel A. J. Am. Chem. Soc. 1993, 115, 6851. [Google Scholar]
- Hass M. A. S.; Jensen M. R.; Led J. J. Proteins 2008, 72, 333. [DOI] [PubMed] [Google Scholar]
- Kukic P.; Farrell D.; McIntosh L. P.; Garcia-Moreno E. B.; Jensen K. S.; Toleikis Z.; Teilum K.; Nielsen J. E. J. Am. Chem. Soc. 2013, 135, 16968. [DOI] [PMC free article] [PubMed] [Google Scholar]
- Cordier F.; Grzesiek S. J. Am. Chem. Soc. 1999, 121, 1601. [Google Scholar]
- Cordier F.; Grzesiek S. J. Mol. Biol. 2002, 317, 739. [DOI] [PubMed] [Google Scholar]
- Hong J. B.; Jing Q. Q.; Yao L. S. J. Biomol. NMR 2013, 55, 71. [DOI] [PubMed] [Google Scholar]
- Wagner G.; Pardi A.; Wuthrich K. J. Am. Chem. Soc. 1983, 105, 5948. [Google Scholar]
- Kuntz I. D.; Kosen P. A.; Craig E. C. J. Am. Chem. Soc. 1991, 113, 1406. [Google Scholar]
- Buckingham A. D.; Lawley K. P. Mol. Phys. 1960, 3, 219. [Google Scholar]
- Sitkoff D.; Case D. A. J. Am. Chem. Soc. 1997, 119, 12262. [Google Scholar]
- Boyd J.; Domene C.; Redfield C.; Ferraro M. B.; Lazzeretti P. J. Am. Chem. Soc. 2003, 125, 9556. [DOI] [PubMed] [Google Scholar]
- Buckingham A. D. Can. J. Chem. 1960, 38, 300. [Google Scholar]
- Batchelor J. G. J. Am. Chem. Soc. 1975, 97, 3410. [Google Scholar]
- Derrick J. P.; Wigley D. B. J. Mol. Biol. 1994, 243, 906. [DOI] [PubMed] [Google Scholar]
- Clore G. M.; Schwieters C. D. J. Mol. Biol. 2006, 355, 879. [DOI] [PubMed] [Google Scholar]
- Ulmer T. S.; Ramirez B. E.; Delaglio F.; Bax A. J. Am. Chem. Soc. 2003, 125, 9179. [DOI] [PubMed] [Google Scholar]
- Yao L. S.; Bax A. J. Am. Chem. Soc. 2007, 129, 11326. [DOI] [PubMed] [Google Scholar]
- Gallagher T.; Alexander P.; Bryan P.; Gilliland G. L. Biochemistry 1994, 33, 4721. [PubMed] [Google Scholar]
- Debye P. J. W.The Collected Papers of Peter J. W. Debye.; Interscience Publishers, Inc.: New York, 1954. [Google Scholar]
- Sitkoff D.; Case D. A. Prog. NMR Spectrosc. 1998, 32, 165. [Google Scholar]
- Coriani S.; Rizzo A.; Ruud K.; Helgaker T. Mol. Phys. 1996, 88, 931. [Google Scholar]
- Grayson M.; Raynes W. T. Magn. Reson. Chem. 1995, 33, 138. [Google Scholar]
- Takashim S.; Schwan H. P. J. Phys. Chem. 1965, 69, 4176. [DOI] [PubMed] [Google Scholar]
- Gascoyne P. R. C.; Pethig R. J. Chem. Soc. Faraday Trans. 1 1981, 77, 1733. [Google Scholar]
- Harvey S. C.; Hoekstra P. J. Phys. Chem. 1972, 76, 2987. [DOI] [PubMed] [Google Scholar]
- Bone S.; Pethig R. J. Mol. Biol. 1982, 157, 571. [DOI] [PubMed] [Google Scholar]
- Jorgensen W. L.; Chandrasekhar J.; Madura J. D.; Impey R. W.; Klein M. L. J. Chem. Phys. 1983, 79, 926. [Google Scholar]
- Kirkwood J. G. J. Chem. Phys. 1939, 7, 911. [Google Scholar]
Associated Data
This section collects any data citations, data availability statements, or supplementary materials included in this article.