

Background: SATB1 is a multidomain protein that acts as a global gene organizer.
Results: The newly identified CUTL domain contributes to the DNA binding ability of SATB1.
Conclusion: The DNA binding ability of SATB1 requires the contribution of the CUTL domain and the other DNA-binding domains.
Significance: These findings reveal a multiple-domain-coordinated mechanism whereby SATB1 recognizes DNA targets.
Keywords: Chromatin Regulation, Crystal Structure, DNA-binding Protein, Gene Regulation, Scaffold Protein, CUTL Domain, DNA Binding, SATB1, Coordination Mechanism, Global Gene Regulation
Abstract
SATB1 is essential for T-cell development and growth and metastasis of multitype tumors and acts as a global chromatin organizer and gene expression regulator. The DNA binding ability of SATB1 plays vital roles in its various biological functions. We report the crystal structure of the N-terminal module of SATB1. Interestingly, this module contains a ubiquitin-like domain (ULD) and a CUT repeat-like (CUTL) domain (ULD-CUTL tandem). Detailed biochemical experiments indicate that the N terminus of SATB1 (residues 1–248, SATB1(1–248)), including the extreme 70 N-terminal amino acids, and the ULD-CUTL tandem bind specifically to DNA targets. Our results show that the DNA binding ability of full-length SATB1 requires the contribution of the CUTL domain, as well as the CUT1-CUT2 tandem domain and the homeodomain. These findings may reveal a multiple-domain-coordinated mechanism whereby SATB1 recognizes DNA targets.
Introduction
Global gene regulation and epigenetic reprogramming are essential for cell fates and many important processes. The eukaryotic nucleus possesses varied architecture and spatial compartmentalization that is related to the cell type and the stage of differentiation (1, 2). Interphase heterochromatin forms functional domains and networks with the help of various transcriptional factors and can undergo macromolecular crowding (1, 3, 4). SATB1 (special AT-rich binding protein 1), which was first discovered in the thymus (5) and is important for T-cell development (6–8), is an important protein that contributes to the nuclear architecture (9). Nuclear matrix attachment regions (MARs),4 also referred to as base-unpairing regions, have a physical unwinding property and affinity for the nuclear matrix/scaffold (10). In a cell type-specific manner, SATB1 exhibits a cage-like network and organizes higher order chromatin loops into distinct domains via anchoring MARs to the nuclear matrix (9, 11–14). By recruiting various co-factors and chromatin remodeling/modifying complexes to regulatory elements, SATB1 coordinately modulates sets of gene expression by working as a global gene organizer (7, 8, 11, 14, 15) and influences promoter activity by mediating long range interactions (16, 17). Several recent reports showed that ectopically expressed SATB1 reprograms the chromatin organization and transcription profiles of multitype cancer cells, thus facilitating tumor growth and metastasis (18–20). In addition, post-translational modifications of SATB1, including phosphorylation, acetylation, and sumoylation, modulate the transcription activity of SATB1 (14, 21–24).
SATB1 is a cell type-specific MAR DNA-binding protein that is predominately expressed in the thymus (5) and multitype tumors (18–20). SATB1 consists of ULD and CUTL domains at the N terminus, a homeodomain (HD) at the C terminus, and a CUT1-CUT2 tandem in the center (25) (see Fig. 1A). In several previous studies, the CUT1-CUT2 tandem domains were thought to recognize the core unwinding elements in MARs, whereas the isolated HD bound poorly and with low specificity to DNA (26–28). The CUT1-CUT2 tandem and HD allows SATB1 to recognize the core unwinding elements in MARs with higher specificity and affinity (27). SATB1 forms a tetramer through the N-terminal ULD, which is required for high affinity DNA binding (28–30). During the early period of apoptosis, SATB1 is cleaved by caspase-3 and caspase-6 at a VEMD motif downstream of the CUTL domain, resulting in its dissociation from chromatin (29, 31, 32). Currently, little is known about the DNA binding ability of the N-terminal CUTL domain.
FIGURE 1.

Structure of the ULD-CUTL. A, schematic representation of the domain organization of mouse SATB1. The ULD boundary is located from Gly71 to Ser172, and the CUTL domain is located from His186 to Lys248. The two mutants used in this study, SQ-2A and Q402A, were created by substituting the Ser212-Gln213 motif and Gln402 with AA cassettes and alanine, respectively. B, the overall structure of the ULD-CUTL tandem in one asymmetric unit cell. The structure contains four molecules, a, b, c, and d, which are colored red, yellow, blue, and green, respectively. C, c(s) distributions from the sedimentation velocity runs for ∼1 mg/ml SATB1(71–248). The calculated molecular mass for the peak is at the top. D, cartoon representation of the overall crystal structure of ULD-CUTL. The N and C termini of the protein are labeled. The ULD and CUTL domains are colored green and red, respectively, and a loop-helix linker is colored yellow. E, stereo view of a portion of the electron density map for the ULD-CUTL domain. F and G, the superposition of ULD and CUTL of the ULD-CUTL tandem onto the isolated ULD (Protein Data Bank code 3TUO) (F) and CUT1 (Protein Data Bank code 2O49) (G).
In this study, we determined the crystal structure of a SATB1 N-terminal fragment containing the ULD and CUTL domains (ULD-CUTL tandem). We proved that the ULD-CUTL tandem, together with the extremely 70 N-terminal amino acids, has the ability to bind DNA and that this binding depends on the CUTL domain. Moreover, we found that the N-terminal CUTL domain is essential for the DNA binding activity of full-length SATB1, which provides insight into the molecular basis of its coordination of gene expression.
EXPERIMENTAL PROCEDURES
Expression and Purification of Various N-terminal Fragments and Full-length SATB1
The N-terminal fragment (residues 71–248, ULD-CUTL) of the mouse SATB1 gene was PCR-amplified from a mouse thymus cDNA library, cloned into an in-house-modified version of the pET32a (Novagen) vector and confirmed by DNA sequencing. The resulting protein contained a His6 tag at its N terminus. The recombined protein was expressed in BL21 (DE3) Escherichia coli cells at 16 °C for 16–18 h, and the cells were collected by centrifugation and lysed with an AH-1500 high pressure homogenizer (ATS Engineering Limited).
The recombinant ULD-CUTL tandem protein was purified by nickel-nitrilotriacetic acid (Qiagen) affinity chromatography followed by size exclusion chromatography on a HiLoad 26/60 Superdex 200 (GE Healthcare) in 50 mm Tris, pH 8.0, and 100 mm NaCl. After digestion with PreScission Protease to remove the N-terminal His6 tag, the protein was purified using a Mono Q 10/100 GL anion exchange column (GE Healthcare) followed by size exclusion chromatography on a HiLoad 26/60 Superdex 200 column in 20 mm HEPES, pH 8.0, 100 mm NaCl, 1 mm EDTA, and 1 mm DTT.
We used similar expression and purification processes to prepare recombinant proteins of various N-terminal fragments of the wild type and mutant SATB1 (see Fig. 2A), including residues 1–248 (referred to as SATB1(1–248), similar nomenclature hereafter), SATB1(1–172), and SATB1(179–248). The full-length SATB1 and the mutants were expressed and purified as previously described (25). All point mutations of SATB1 that are described here were created using the standard, PCR-based mutagenesis method and confirmed by DNA sequencing.
FIGURE 2.

DNA binding of the N terminus of SATB1. A, schematic representation of various N-terminal truncations of wild type SATB1 and the SATB1(1–248) mutants. The two mutants used in this study, SQ-2A(1–248) and KK-2A(1–248), were created by substituting the Ser212-Gln213 and Lys51-Lys58 motifs with a AA cassette, respectively, and the KWN-3A(1–248) mutant was created by substituting the Lys136-Trp137-Asn138 motif with a AAA cassette. B, nucleotide sequence of the wild type and mutated IL-2 promoter region that spans base pairs −447 to −441 from the transcription site. The mutated base pairs are colored red and highlighted by a rectangle. The 5′-6-FAM fluorescence-labeled, single-stranded DNAs were annealed with reverse oligonucleotides and used as EMSA probes in this study. C, EMSAs. The EMSAs were performed using various protein concentrations. Right panel, bar graph of the DNA binding affinity from the protein dose-dependent EMSAs. The fluorescence intensities of the protein-bound DNA bands were calculated using Adobe Photoshop CS4 and normalized to that of the free DNA probe. The error bars indicate the standard error mean (n = 3 separate experiments). *, p < 0.05; **, p < 0.01; ***, p < 0.005. D–G, ITC assays. The dissociation constant (Kd) values for various SATB1 N-terminal fragments shown in A with IL-2_37mer shown in B were measured using ITC.
Crystallization and Data Collection
The wild type protein was crystallized using the sitting drop vapor diffusion method equilibrated against a reservoir solution of 10% polyethylene glycol 3350, 0.1 m sodium malonate, pH 7.0, and 0.2 m glycine. The crystals grew at 20 °C and were frozen in a cryoprotectant solution consisting of the reservoir solution supplemented with 15% glycerol. The crystal belonged to the space group C121, and it diffracted to 2.6 Å, with unit cell dimensions as follows: a = 128.98, b = 91.97, c = 100.24, α = γ = 90°, and β = 128.97°. Diffraction data of the ULD-CUTL tandem was collected at a wavelength of 0.9791 Å on station BL17U1 at the Shanghai Synchrotron Radiation Facility and was processed using the HKL2000 software (33).
Structure Determination and Refinement
The initial phases of the structure factors for the ULD-CUTL tandem were obtained by molecular replacement using the PHASER program (34). The ULD (Protein Data Bank code 3TUO) and SATB1(179–248) (Protein Data Bank code 3NZL) structures were used as search models. Four molecules of ULD and two molecules of SATB1(179–248) in one asymmetric unit were successfully found by the software. Additional residues were manually built into the electron density using the Coot program (35). The final tetramer model was refined iteratively using the PHENIX (36) and Coot (35) programs. The orientations of the amino acid side chains and bound water molecules were modeled based on sigma-weighted 2Fobs − Fcalc and Fobs − Fcalc Fourier electron density maps. The final structure had an Rcryst value of 22.8% and an Rfree value of 27.1%. The Ramachandran plot, which was calculated using the PROCHECK program (37), showed that 87.2% of the residues were in their most favored regions, 11.5% of the residues were in additionally allowed regions, 1.3% of the residues were in generously allowed regions, and no residues were in disallowed regions. The residues in generously allowed regions include residues 70 and 172 in chain a, residue 95 in chain c, and residues 222, 224, and 226 in chain d, which do not primarily appear in the CUTL domain. The detailed data collection and refinement statistics are summarized in Table 1, and the B-factors for the ULD and CUTL domain are listed in Table 2.
TABLE 1.
Data collection and refinement statistics for ULD-CUTL structure
| Crystal name | ULD-CUTL |
|---|---|
| Space group | C 1 2 1 |
| Unit cell (Å) | a = 128.98, b = 91.97, c = 100.24 |
| α = γ = 90°, β = 128.97° | |
| Wavelength (Å) | 0.9791 |
| Resolution range (Å) | 42.5-2.60 (2.69-2.60)a |
| No. of unique reflections | 27,709 |
| Redundancy | 3.7 (3.4)a |
| Rsym (%)b | 7.7 (58.0)a |
| I/σ | 16.1 (1.9)a |
| Completeness (%) | 99.2 (94.8)a |
| Refinement | |
| Rcrystal (%)c | 22.8 |
| Rfree (%)d | 27.1 |
| RMSD bond (Å)e | 0.009 |
| RMSD angle (°) | 1.3 |
| Number of protein atoms | 4,025 |
| Number of ligand atoms | 0 |
| Number of solvent atoms | 13 |
| Residues (%) | |
| Most favored | 87.2 |
| Additional allowed | 11.5 |
| Generously allowed | 1.3 |
| Disallowed | 0 |
| Average B factor (Å2) | |
| Chain a | 66.2 |
| Chain b | 61.3 |
| Chain c | 68.6 |
| Chain d | 71.4 |
| Solvent | 67.1 |
a The highest resolution shell.
b Rsym = Σj|<I> − Ij|/Σ<I>.
c Rcryst = Σhkl|Fobs − Fcalc|/ΣhklFobs.
d Rfree, calculated the same as Rcrystal but from a test set containing 5% of data excluded from the refinement calculation.
e RMSD, root mean square deviation.
TABLE 2.
B-factors of the ULD and CUTL domains
| Chain name | B-factor | |
|---|---|---|
| a | ULD (71–172) | 62.664 |
| CUTL (186–244) | 69.785 | |
| b | ULD (71–172) | 61.658 |
| CUTL (186–244) | ||
| c | ULD (71–172) | 68.394 |
| CUTL (186–244) | ||
| d | ULD (71–172) | 71.849 |
| CUTL (186–244) | 71.174 | |
Electrophoretic Mobility Shift Assay
5′ 6-FAM-labeled forward oligonucleotides were synthetized by Sangon Biotech (Shanghai) Co., Ltd., and the forward and reverse oligonucleotides for a particular set were mixed together. To anneal the labeled oligonucleotides, the mixtures were heated to 95 °C for 10 min and allowed to cool slowly to room temperature. Binding reactions were performed in a 10-μl total volume containing 10 mm HEPES, pH 8.0, 1 mm DTT, 50 mm KCl, 5 mm MgCl2, 2.5% glycerol, 0.05% Nonidet P-40, and the appropriate amount of annealed oligonucleotides and recombinant proteins. Samples were incubated on ice for 1 h and separated by electrophoresis on a 5% native polyacrylamide gel. The fluorescence polyacrylamide gels were exposed in a VersaDoc MP System (Bio-Rad), and the intensities of protein-bound DNA probes were calculated using Adobe Photoshop CS4 and normalized to that of the free DNA probe. As a correction, the background caused by misannealing probes was eliminated from the shifted bands.
Analytical Gel Filtration
Size exclusion chromatography was performed on an AKTA FPLC system using a Superdex 200 10/300 column (GE Healthcare). The protein samples were dissolved in buffer containing 50 mm Tris, pH 8.0, 100 mm NaCl, 1 mm EDTA, and 1 mm DTT. The column was calibrated with a gel filtration standard from GE Healthcare.
Analytical Ultracentrifugation
Sedimentation velocity experiments were performed in a Beckman/Coulter XL-I analytical ultracentrifuge using double-sector and sapphire windows. An additional protein purification step on a HiLoad 26/60 Superdex 200 gel filtration column in 50 mm Tris, pH 8.0, 100 mm NaCl, 1 mm EDTA, and 1 mm DTT was performed before the experiments. Sedimentation velocity experiments were conducted at 42,000 rpm and 4 °C using interference detection, and double-sector cells were loaded with ∼1 mg/ml samples. The buffer composition (density and viscosity) and protein partial specific volume (V-bar) were obtained using the SEDNTERP program. The data were analyzed using the SEDFIT program (38, 39).
Circular Dichroism
CD spectra of various proteins were collected using a MOS450 spectropolarimeter (BioLogic) at room temperature. The protein samples (∼1 mg/ml) were dissolved in 50 mm Tris, pH 8.0, 100 mm NaCl, 1 mm EDTA, and 1 mm DTT.
Isothermal Titration Calorimetry
Isothermal titration calorimetry (ITC) measurements were performed using a MicroCalTM isothermal titration calorimeter iTC200 (GE Healthcare). Before the experiments were performed, various recombinant SATB1 proteins were buffer exchanged into 20 mm HEPES, pH 8.0, 100 mm KCl, and 1 mm MgCl2 through size exclusion chromatography using a HiLoad 26/60 Superdex 200 column. For various recombinant SATB1 N-terminal fragments, except KK-2A(1–248), ∼50 μm of a DNA probe was titrated into ∼20 μm of the protein. For KK-2A(1–248), ∼150 μm of a DNA probe was titrated into ∼60 μm of the protein. For the full-length SATB1, ∼240 μm of a DNA probe was titrated into ∼24 μm of the protein. All concentration indicated here was the concentration of protein dimer or DNA double strand. The titration included an initial injection of 0.4 μl followed by 19 injections of 2 μl every 120 s at 16 °C for various recombinant N-terminal protein fragments and 25 injections of 1.5 μl for the full-length SATB1. To define the baseline, the DNA probe was titrated into the same buffer without protein under the same conditions. The titration data and binding plots after the baseline were subtracted were analyzed using MicroCal Origin software with the one-site binding model for various SATB1 N-terminal fragments and the full-length SATB1 mutants, or the two-site-binding model for the full-length SATB1 wild type. After initial data refinements, the stoichiometry was fixed for each site to achieve the best overall fit to the two-site and one-site binding models for the full-length SATB1 wild type and mutants, respectively, whereas the stoichiometry of DNA binding of various SATB1 N-terminal fragments was not reported here.
RESULTS
Overall Structure of the ULD-CUTL Tandem of SATB1
The crystal structure of the N-terminal module of SATB1 (residues 71–248) (Fig. 1A) was solved using molecular replacement at a resolution of 2.6 Å. Overall, one asymmetric unit cell consists of four molecules (Fig. 1B). The N-terminal domains of the four molecules are nearly defined, except for residues 83–91, 83–92, 83–93, and 85–93 in molecules a, b, c, and d, respectively, whereas a lack of electron density prevents modeling of the entire C-terminal domain of molecules b and c (Fig. 1B). Our crystal structure contains four molecules that seem to form a tightly packed tetramer in one asymmetric unit (Fig. 1B). Consistent with this observation, analytical ultracentrifugation confirmed that the N-terminal module of SATB1 assembles into a tetramer with a molecular mass of ∼82.9 kDa (Fig. 1C). We refer only to molecule a in the following discussion.
In the entire structure of the N-terminal module of SATB1, the structure of residues 71–172 comprises four antiparallel β-sheets that are flanked by four α-helices (Fig. 1, A and D), which is similar to the previously determined structure of the isolated ULD (Fig. 1F) (25). Interestingly, the structure of residues 186–248 resembles the CUT1 domain of SATB1, and this region was named a CUT repeat-like (CUTL) domain (Fig. 1, A, E, and G). Thus, the N-terminal module of SATB1 consists of a ULD (colored green) and a CUTL domain (colored red) that are connected by a loop and a linker-helix (colored yellow) (hereafter referred to as ULD-CUTL) (Fig. 1D).
The N Terminus of SATB1 (SATB1(1–248)) Specifically Binds to DNA Targets
It was noted that the CUT1 domain is involved in the DNA binding of SATB1 (28). To test whether the CUTL domain has DNA binding ability, we performed EMSAs of several truncations of the N terminus of SATB1 (Fig. 2A). A 37-bp DNA fragment (IL-2_37mer) from the human IL-2 promoter was chosen as the probe for the EMSAs (15) (Fig. 2B). To our surprise, no obvious protein-DNA complexes were found for SATB1(179–248), which contains the isolated CUTL domain, or SATB1(71–248), which included the ULD-CUTL tandem (Fig. 2C). Interestingly, clear DNA binding for SATB1(1–248), which contains the extreme 70 N-terminal amino acids and the ULD-CUTL tandem, was detected (Fig. 2C). Additionally, no shifted bands were observed in the lane added with SATB1(1–172) (Fig. 2C), excluding the DNA binding by the ULD or the extreme 70 N-terminal amino acids. We also quantitatively studied the DNA binding affinities of various SATB1 N-terminal truncations using the IL-2_37mer and ITC assays (Fig. 2, D–G). These ITC results indicate that SATB1(1–248) binds DNA with a Kd value of ∼0.24 μm (Fig. 2D), which is ∼8-fold stronger than between SATB1(71–248) and the same DNA molecules (Kd value of ∼1.82 μm; Fig. 2E). The data indicate no protein-DNA complexes for SATB1(71–248), in contrast to SATB1(1–248) using the same EMSA (Fig. 2C). Notably, both SATB1(1–172) and SATB1(179–248) showed no binding to the same DNA molecule (Fig. 2, F and G). These ITC results are consistent with the EMSAs.
Next, we wanted to study the role of the extreme 70 N-terminal amino acids in SATB1(1–248) in DNA binding. Notably, the SATB1(1–70) amino acids are highly conserved among multiple species (Fig. 3A). We mutated two conserved, positively charged residues, Lys51 and Lys58 from this extreme N-terminal region to glutamic acids in SATB1(1–248) (referred to as KK-2E(1–248)) (Fig. 2A) and measured its binding affinity for the same DNA molecule using an ITC assay. The ITC data show that the KK-2E(1–248) mutant bound the DNA with a Kd value of ∼16.58 μm (Fig. 4A), which is ∼69-fold weaker than between SATB1(1–248) wild type and the same DNA molecule, which indicates that the extreme 70 N-terminal residues in SATB1 contribute to high affinity DNA binding of SATB1(1–248).
FIGURE 3.
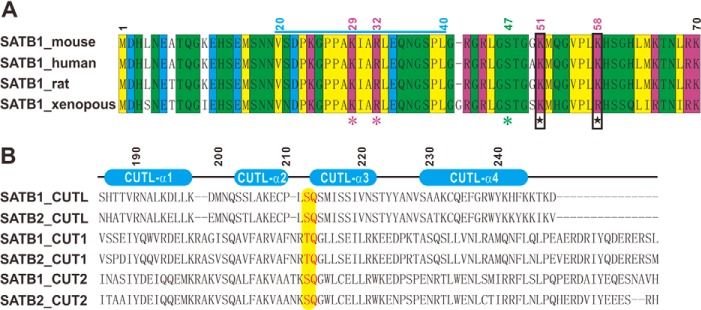
Sequence alignments of the extreme 70 N-terminal amino acids and the CUT domains in the SATB family. A, sequence alignment of the extreme N-terminal 70 amino acids of SATB1 in various species. The conserved hydrophobic residues are in yellow; the conserved hydrophilic residues are in green; the conserved negatively charged resides are in cyan; and the conserved positively charged residues are in purple. The nuclear localization signal, consisting of residues 20–40, is marked with a blue line at the top. Purple asterisks indicate the key residues in the nuclear localization signal, and a green asterisk indicates residue Ser47, which can be phosphorylated by Akt. The two positively charged residues that were mutated to glutamic acids in the KK-2E(1–248) construct are indicated with black boxes and stars. B, structure-based sequence alignment of the six CUT domains from mouse SATB1 and human SATB2. The secondary structures of CUTL are indicated at the top. The Ser212-Gln213 motif is marked with a yellow background. The amino acid residue numbers of mouse SATB1 CUTL is also indicated in the figure.
FIGURE 4.

DNA binding affinity for the N-terminal mutant of SATB1. A, C, E, and F, ITC assays. The IL-2_37mer DNA fragments were titrated into various N-terminal mutants of SATB1 (A, C, and E). The Mut-IL-2_37mer DNA fragments were titrated into the wild type SATB1(1–248) (F). The Kd values calculated for each titration are shown in the corresponding insets. B, size exclusion chromatography of the SATB1(1–248) wild type and mutants was performed on a Superdex 200 10/300 column. The elution volumes of the protein markers used to calibrate the gel filtration column are labeled at the top. D, superposed CD spectra for SATB1(1–248), SQ-2A(1–248), and KWN-3A(1–248).
Together, these results indicate that the CUTL domain, together with the extreme 70 N-terminal amino acids and ULD, are important for SATB1(1–248) binding to DNA targets. In the following study, we explore the mechanism of SATB1(1–248)-mediated DNA binding.
ULD-mediated Oligomerization Is Required for DNA Binding of SATB1(1–248)
SATB1 has been shown to form a stable tetramer through the ULD, and by mutating the Lys136-Trp137-Asn138 motif in ULD to force the protein into a dimeric state (25), we investigated the roles of ULD-mediated oligomerization in the DNA binding activity of SATB1(1–248). Accordingly, we replaced the Lys136-Trp137-Asn138 motif with an “AAA” cassette and refer to this mutant as KWN-3A(1–248) hereafter (Fig. 2A). The purified wild type SATB1(1–248) and mutant KWN-3A(1–248) eluted as a single peak from an analytical gel filtration column with a molecular mass corresponding to that of a tetramer and a dimer, respectively (Fig. 4B). We assessed the ability of wild type SATB1(1–248) and the KWN-3A(1–248) mutant to bind the IL-2_37mer via ITC. The ITC results show that the KWN-3A(1–248) mutant binds DNA with a Kd value of ∼1.61 μm, which is ∼7-fold weaker than between SATB1(1–248) wild type and the same DNA molecule (Fig. 4C). We used CD to confirm similar behavior between SATB1(1–248) wild type and the KWN-3A(1–248) mutant, which ensured that any loss in DNA binding activity was not due to disruption of the tertiary structure (Fig. 4D). Thus, our data indicate that ULD-mediated oligomerization of SATB1(1–248) is required for its target DNA binding.
The DNA Binding Specificity of the CUTL Domain
A prior study has proposed that residues Thr401 and Gln402 in the CUT1 domain are important for the DNA binding activity of SATB1 (28), and sequence alignment shows that these two residues are highly conserved in all CUT1 and CUT2 domains, as well as in CUTL domains from SATB1 and SATB2 (Fig. 3B). To test the roles of the corresponding residues, Ser212 and Gln213, of CUTL in SATB1(1–248) DNA binding, we replaced these two residues with an “AA” cassette (referred to as SQ-2A(1–248)) (Fig. 2A). In an ITC assay, the SQ-2A(1–248) mutant completely lost its DNA binding ability to the IL-2_37mer (Fig. 4E). When compared with wild type SATB1(1–248), the SQ-2A(1–248) mutant also assembled into a tetramer (red line in Fig. 4B) and exhibited a CD spectrum similar to wild type SATB1(1–248) (cyan line in Fig. 4D). Thus, these data suggest that the CUTL domain is essential for SATB1(1–248)-coordinated DNA binding.
SATB1 prefers to bind palindromic AT-rich motifs containing MARs through ULD-mediated oligomerization of its C-terminal CUT1-CUT2 tandem and HD domains (25, 30). Notably, the IL-2_37mer DNA probe used for SATB1(1–248) binding is such a MAR, and specific mutations that diminish the unwinding property of MARs reduce the binding affinity of SATB1 (5). According to these observations, we wanted to test whether the CUTL domain in SATB1(1–248) recognizes DNA by a similar mode as the CUT1-CUT2 tandem and HD domains in SATB1. To accomplish this, we synthesized the mutant probe Mut-IL-2_37mer (Fig. 2B), which binds the SATB1 weakly (15, 30). Data from an ITC assay show that SATB1(1–248) binds to the mutant DNA with a Kd value of ∼1.64 μm, which is ∼7-fold weaker than binding between SATB1(1–248) and the wild type IL-2_37mer (Fig. 4F). These results suggest that the CUTL domain has DNA binding specificity similar to that of the CUT1-CUT2 tandem and HD domains in SATB1.
The CUTL Domain Is Required for the DNA Binding Ability of Full-length SATB1
The data in Fig. 4E data show that the Ser212-Gln213 motif in the CUTL domain is important for the contact between DNA and SATB1(1–248). We next investigated whether the CUTL domain contributes to the DNA binding ability of full-length SATB1. Accordingly, we replaced the Ser212-Gln213 motif with an AA cassette and converted Gln402, which is important for DNA binding of the CUT1 domain (28), to alanine in the full-length SATB1 (referred to as SQ-2A and Q402A, respectively, herein) (Fig. 1A). The purified, wild type SATB1 and the SQ-2A and Q402A mutants had similar tetrameric conformations in an analytical gel filtration column (Fig. 5A). As expected, the DNA binding affinity of the Q402A mutant to the IL-2_37mer (Fig. 5B) was obviously decreased when compared with the wild type SATB1, which is consistent with the conclusion from another study (28). Interestingly, the same EMSAs showed that the DNA binding affinity of the SQ-2A mutant was also lower than the wild type SATB1 (Fig. 5B).
FIGURE 5.

DNA binding of the SATB1 wild type and mutants, as measured by EMSA and ITC. A, size exclusion chromatography of the SATB1 wild type and mutants was performed on a Superdex 200 10/300 column. The elution volumes of the protein markers used to calibrate the gel filtration column are labeled at the top. B, EMSAs. The binding of various SATB1 wild type and mutants to the IL-2_37mer DNA probes is shown. The EMSAs were performed using various protein concentrations. Right panel, bar graph of the DNA binding affinity from the protein dose-dependent EMSAs. The fluorescence intensities of the protein-bound DNA bands were calculated using Adobe Photoshop CS4 and normalized to that of the free DNA probe. The error bars indicate the standard error mean (n = 3 separate experiments). *, p < 0.05; **, p < 0.01; ***, p < 0.005. C–E, the Kd values of the wild type SATB1 (C), SQ-2A mutant (D), and Q402A mutant (E) with IL-2_37mer were measured using ITC. The Kd values of the two sites for the SATB1 wild type are ∼0.32 and ∼3.03 μm, respectively, whereas the stoichiometry for each site is ∼0.91. The Kd values for the SQ-2A and Q402A mutants are ∼4.17 and ∼5.38 μm, respectively, whereas the stoichiometry for DNA binding of the SQ-2A and Q402A mutants is ∼0.65 and ∼0.63, respectively.
We previously found that the SATB1 tetramer binds the IL-2_37mer through an allosteric two-site interactions with Kd values of ∼0.36 and ∼1.99 μm (25). We used ITC to quantitatively study the binding between both the SQ-2A and Q402 mutants and the DNA targets. We repeated the ITC experiment to test the interaction between the SATB1 wild type and the IL-2_37mer. As expected, the SATB1 tetramer could bind to two IL-2_37mer simultaneously; the Kd values for the two sites were ∼0.32 and ∼3.03 μm, respectively (Fig. 5C). The binding between the SQ-2A and Q402A mutants and the IL-2_37mer was consistent with a one-site binding model; the Kd values were ∼4.17 and ∼5.38 μm, respectively, which suggests that the two binding sites in the SQ-2A and Q402A mutants are equivalent (Fig. 5, D and E). These ITC results show that the SQ-2A and Q402A mutants have comparable DNA binding affinities that are weaker than the wild type SATB1. Together, our data indicate that the N-terminal CUTL domain plays an important role in the DNA binding affinity of full-length SATB1.
DISCUSSION
The DNA binding affinity and specificity of SATB1 are of great importance for its physiological function. Based on the structure of the ULD-CUTL tandem that was determined in this work, we found that SATB1(1–248), which includes the ULD-CUTL tandem and the extreme 70 N-terminal amino acids, can bind to a specific DNA sequence and contributes to the DNA binding ability of full-length SATB1. Combined with previous studies, we propose a model for how SATB1 specifically binds to DNA targets (Fig. 6). Tetrameric SATB1 binds one or two DNA fragments via coordination of the CUTL domain, the CUT1-CUT2 tandem, and HD domains to act as a global chromatin organizer and gene expression regulator.
FIGURE 6.
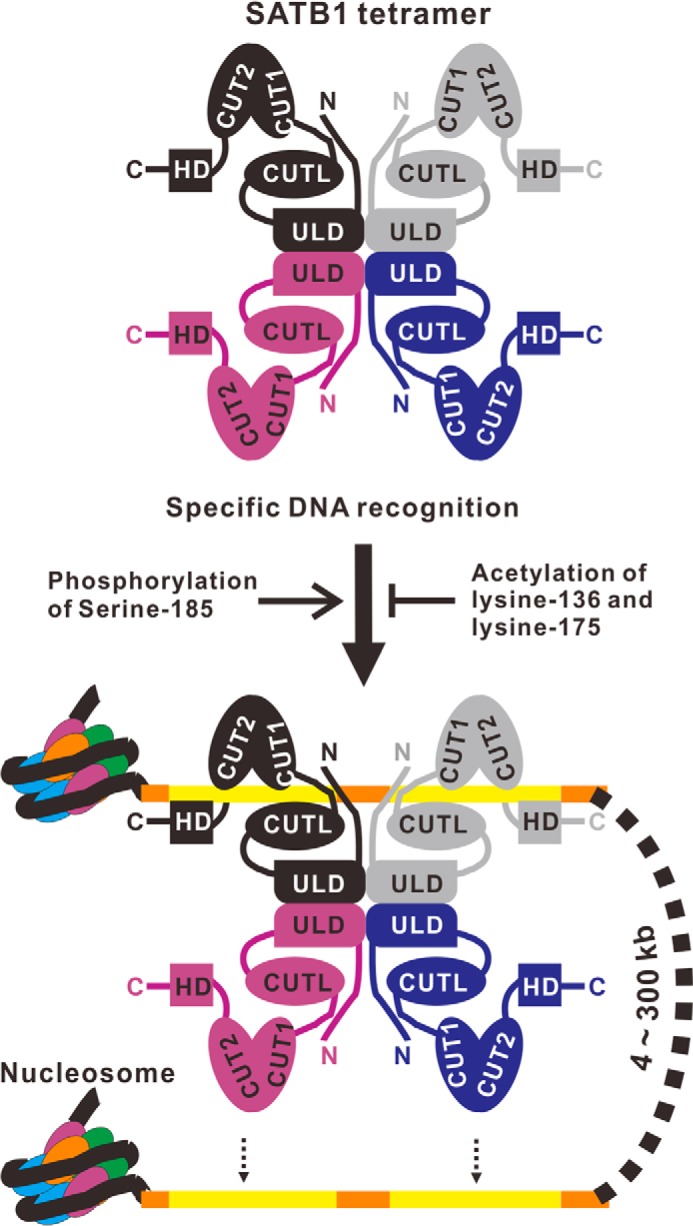
Schematic representation of a hypothetic model for coordinating DNA binding of SATB1. SATB1 assembles into a tetramer by oligomerization of the N-terminal ULD. The SATB1 tetramer can bind one or two palindromic AT-rich motif-containing DNA fragments by coordination of the CUTL, CUT1-CUT2 tandem, and HD domains. ULD-mediated tetramerization is required, and the extreme N-terminal 70 amino acids also participate in the DNA binding of SATB1. Some postmodifications, including phosphorylation of Ser185 and acetylation of Lys136 and Lys175, influence DNA binding of SATB1 and thereby regulate gene expression.
Previous biochemical studies have shown that SATB1 binds DNA motifs that consist of an AT-rich context with limited G or C bases through the CUT1-CUT2 tandem and HD domains and that substitution of A/T to G/C in this motif disrupts the DNA binding of SATB1 (5, 30). In this work, we show that the newly identified CUTL domain has DNA binding specificity similar to that of the CUT1-CUT2 tandem and HD domains (Figs. 2 and 4). We note that the stoichiometry in binding between SATB1(71–248) or the SATB1(1–248) wild type and mutants and the IL-2_37mer is aberrant during data fitting in ITC experiments (Figs. 2 and 4). It is possible that the IL-2_37mer is an unsuitable DNA probe for SATB1(1–248) and SATB1(71–248), because this probe was initially identified for the full-length SATB1 (15). Nevertheless, the Kd values, together with the EMSA results, are able to compare the DNA binding affinities of various N-terminal fragments of SATB1. More, we show that a full-length SATB1 protein harboring mutations of the Ser212-Gln213 motif within the CUTL domain disrupts the DNA binding of SATB1 (Fig. 5D). Taken together, we speculate that the specific DNA recognition of SATB1 requires the coordination of the CUTL, CUT1-CUT2 tandem, and HD domains (Fig. 6). Such a cooperative binding mode also exists in DNA interaction of the POU domain of Oct-1 (40).
The tetrameric N terminus is essential for local and long range gene organization by SATB1 (25). SATB1 is cleaved at its VEMD motif, which is located downstream of the CUTL domain, during early apoptosis, which disrupts the oligomerization of SATB1 and the coordination of the N and C termini for its DNA binding, resulting in the dissociation of SATB1 from chromatin (29, 31, 32). Moreover, some postmodifications also influence the DNA binding of SATB1 (Fig. 6). Acetylation of Lys136 has been reported to impair the DNA affinity of SATB1 (21). Some other modifications in the loop between the ULD and CUTL domains, such as phosphorylation of Ser185 (21) and acetylation of Lys175 (24), also affect the DNA binding affinity of SATB1. It would be interesting to explore the detailed mechanism of SATB1-mediated gene expression by way of these postmodifications in future studies.
Acknowledgments
We are grateful to the staff at Beamline BL17U1 of the Shanghai Synchrotron Radiation Facility and the staff at Beamline NW3A at Photon Factory (Tsukuba, Japan) for excellent technical assistance during data collection.
This work was supported by 973 Program Grants 2014CB910201 (to J. L.) and 2012CB917201 (to Y. S.) and National Natural Science Foundation of China Grants 31270815 (to J. L.) and 31100527 (to H. Z.).
The atomic coordinates and structure factors (code 4Q2J) have been deposited in the Protein Data Bank (http://wwpdb.org/).
- MAR
- matrix attachment region
- ULD
- ubiquitin-like domain
- CUTL
- CUT repeat-like
- HD
- homeodomain
- ITC
- isothermal titration calorimetry.
REFERENCES
- 1. Razin S. V., Gavrilov A. A., Ioudinkova E. S., Iarovaia O. V. (2013) Communication of genome regulatory elements in a folded chromosome. FEBS Lett. 587, 1840–1847 [DOI] [PubMed] [Google Scholar]
- 2. Serrano L., Vazquez B. N., Tischfield J. (2013) Chromatin structure, pluripotency and differentiation. Exp. Biol. Med. (Maywood) 238, 259–270 [DOI] [PubMed] [Google Scholar]
- 3. Suvà M. L., Riggi N., Bernstein B. E. (2013) Epigenetic reprogramming in cancer. Science 339, 1567–1570 [DOI] [PMC free article] [PubMed] [Google Scholar]
- 4. Kleinjan D. A., van Heyningen V. (2005) Long-range control of gene expression: emerging mechanisms and disruption in disease. Am. J. Hum. Genet. 76, 8–32 [DOI] [PMC free article] [PubMed] [Google Scholar]
- 5. Dickinson L. A., Joh T., Kohwi Y., Kohwi-Shigematsu T. (1992) A tissue-specific MAR/SAR DNA-binding protein with unusual binding site recognition. Cell 70, 631–645 [DOI] [PubMed] [Google Scholar]
- 6. Alvarez J. D., Yasui D. H., Niida H., Joh T., Loh D. Y., Kohwi-Shigematsu T. (2000) The MAR-binding protein SATB1 orchestrates temporal and spatial expression of multiple genes during T-cell development. Genes Dev. 14, 521–535 [PMC free article] [PubMed] [Google Scholar]
- 7. Notani D., Gottimukkala K. P., Jayani R. S., Limaye A. S., Damle M. V., Mehta S., Purbey P. K., Joseph J., Galande S. (2010) Global regulator SATB1 recruits β-catenin and regulates T(H)2 differentiation in Wnt-dependent manner. PLoS Biol. 8, e1000296. [DOI] [PMC free article] [PubMed] [Google Scholar]
- 8. Ahlfors H., Limaye A., Elo L. L., Tuomela S., Burute M., Gottimukkala K. V., Notani D., Rasool O., Galande S., Lahesmaa R. (2010) SATB1 dictates expression of multiple genes including IL-5 involved in human T helper cell differentiation. Blood 116, 1443–1453 [DOI] [PMC free article] [PubMed] [Google Scholar]
- 9. Cai S., Han H. J., Kohwi-Shigematsu T. (2003) Tissue-specific nuclear architecture and gene expression regulated by SATB1. Nat. Genet. 34, 42–51 [DOI] [PubMed] [Google Scholar]
- 10. Bode J., Kohwi Y., Dickinson L., Joh T., Klehr D., Mielke C., Kohwi-Shigematsu T. (1992) Biological significance of unwinding capability of nuclear matrix-associating DNAs. Science 255, 195–197 [DOI] [PubMed] [Google Scholar]
- 11. Yasui D., Miyano M., Cai S., Varga-Weisz P., Kohwi-Shigematsu T. (2002) SATB1 targets chromatin remodelling to regulate genes over long distances. Nature 419, 641–645 [DOI] [PubMed] [Google Scholar]
- 12. Cai S., Lee C. C., Kohwi-Shigematsu T. (2006) SATB1 packages densely looped, transcriptionally active chromatin for coordinated expression of cytokine genes. Nat. Genet. 38, 1278–1288 [DOI] [PubMed] [Google Scholar]
- 13. Kumar P. P., Bischof O., Purbey P. K., Notani D., Urlaub H., Dejean A., Galande S. (2007) Functional interaction between PML and SATB1 regulates chromatin-loop architecture and transcription of the MHC class I locus. Nat. Cell Biol. 9, 45–56 [DOI] [PubMed] [Google Scholar]
- 14. Purbey P. K., Singh S., Notani D., Kumar P. P., Limaye A. S., Galande S. (2009) Acetylation-dependent interaction of SATB1 and CtBP1 mediates transcriptional repression by SATB1. Mol. Cell Biol. 29, 1321–1337 [DOI] [PMC free article] [PubMed] [Google Scholar]
- 15. Kumar P. P., Purbey P. K., Ravi D. S., Mitra D., Galande S. (2005) Displacement of SATB1-bound histone deacetylase 1 corepressor by the human immunodeficiency virus type 1 transactivator induces expression of interleukin-2 and its receptor in T cells. Mol. Cell Biol. 25, 1620–1633 [DOI] [PMC free article] [PubMed] [Google Scholar]
- 16. Gong F., Sun L., Wang Z., Shi J., Li W., Wang S., Han X., Sun Y. (2011) The BCL2 gene is regulated by a special AT-rich sequence binding protein 1-mediated long range chromosomal interaction between the promoter and the distal element located within the 3′-UTR. Nucleic Acids Res. 39, 4640–4652 [DOI] [PMC free article] [PubMed] [Google Scholar]
- 17. Galande S., Purbey P. K., Notani D., Kumar P. P. (2007) The third dimension of gene regulation: organization of dynamic chromatin loopscape by SATB1. Curr. Opin. Genet. Dev. 17, 408–414 [DOI] [PubMed] [Google Scholar]
- 18. Han H. J., Russo J., Kohwi Y., Kohwi-Shigematsu T. (2008) SATB1 reprogrammes gene expression to promote breast tumour growth and metastasis. Nature 452, 187–193 [DOI] [PubMed] [Google Scholar]
- 19. Tu W., Luo M., Wang Z., Yan W., Xia Y., Deng H., He J., Han P., Tian D. (2012) Upregulation of SATB1 promotes tumor growth and metastasis in liver cancer. Liver Int. 32, 1064–1078 [DOI] [PubMed] [Google Scholar]
- 20. Han B., Luan L., Xu Z., Wu B. (2013) Expression and biological roles of SATB1 in human bladder cancer. Tumour Biol. 34, 2943–2949 [DOI] [PubMed] [Google Scholar]
- 21. Pavan Kumar P., Purbey P. K., Sinha C. K., Notani D., Limaye A., Jayani R. S., Galande S. (2006) Phosphorylation of SATB1, a global gene regulator, acts as a molecular switch regulating its transcriptional activity in vivo. Mol. Cell 22, 231–243 [DOI] [PubMed] [Google Scholar]
- 22. Tan J. A., Sun Y., Song J., Chen Y., Krontiris T. G., Durrin L. K. (2008) SUMO conjugation to the matrix attachment region-binding protein, special AT-rich sequence-binding protein-1 (SATB1), targets SATB1 to promyelocytic nuclear bodies where it undergoes caspase cleavage. J. Biol. Chem. 283, 18124–18134 [DOI] [PMC free article] [PubMed] [Google Scholar]
- 23. Tan J. A., Song J., Chen Y., Durrin L. K. (2010) Phosphorylation-dependent interaction of SATB1 and PIAS1 directs SUMO-regulated caspase cleavage of SATB1. Mol. Cell Biol. 30, 2823–2836 [DOI] [PMC free article] [PubMed] [Google Scholar]
- 24. Xue Z., Lv X., Song W., Wang X., Zhao G. N., Wang W. T., Xiong J., Mao B. B., Yu W., Yang B., Wu J., Zhou L. Q., Hao D. L., Dong W. J., Liu D. P., Liang C. C. (2012) SIRT1 deacetylates SATB1 to facilitate MAR HS2-MAR epsilon interaction and promote epsilon-globin expression. Nucleic Acids Res. 40, 4804–4815 [DOI] [PMC free article] [PubMed] [Google Scholar]
- 25. Wang Z., Yang X., Chu X., Zhang J., Zhou H., Shen Y., Long J. (2012) The structural basis for the oligomerization of the N-terminal domain of SATB1. Nucleic Acids Res. 40, 4193–4202 [DOI] [PMC free article] [PubMed] [Google Scholar]
- 26. Nakagomi K., Kohwi Y., Dickinson L. A., Kohwi-Shigematsu T. (1994) A novel DNA-binding motif in the nuclear matrix attachment DNA-binding protein SATB1. Mol. Cell Biol. 14, 1852–1860 [DOI] [PMC free article] [PubMed] [Google Scholar]
- 27. Dickinson L. A., Dickinson C. D., Kohwi-Shigematsu T. (1997) An atypical homeodomain in SATB1 promotes specific recognition of the key structural element in a matrix attachment region. J. Biol. Chem. 272, 11463–11470 [DOI] [PubMed] [Google Scholar]
- 28. Yamasaki K., Akiba T., Yamasaki T., Harata K. (2007) Structural basis for recognition of the matrix attachment region of DNA by transcription factor SATB1. Nucleic Acids Res. 35, 5073–5084 [DOI] [PMC free article] [PubMed] [Google Scholar]
- 29. Galande S., Dickinson L. A., Mian I. S., Sikorska M., Kohwi-Shigematsu T. (2001) SATB1 cleavage by caspase 6 disrupts PDZ domain-mediated dimerization, causing detachment from chromatin early in T-cell apoptosis. Mol. Cell Biol. 21, 5591–5604 [DOI] [PMC free article] [PubMed] [Google Scholar]
- 30. Purbey P. K., Singh S., Kumar P. P., Mehta S., Ganesh K. N., Mitra D., Galande S. (2008) PDZ domain-mediated dimerization and homeodomain-directed specificity are required for high-affinity DNA binding by SATB1. Nucleic Acids Res. 36, 2107–2122 [DOI] [PMC free article] [PubMed] [Google Scholar]
- 31. Gotzmann J., Meissner M., Gerner C. (2000) The fate of the nuclear matrix-associated-region-binding protein SATB1 during apoptosis. Cell Death Differ. 7, 425–438 [DOI] [PubMed] [Google Scholar]
- 32. Sun Y., Wang T., Su Y., Yin Y., Xu S., Ma C., Han X. (2006) The behavior of SATB1, a MAR-binding protein, in response to apoptosis stimulation. Cell Biol. Int. 30, 244–247 [DOI] [PubMed] [Google Scholar]
- 33. Otwinowski Z., Minor W. (1997) Processing of x-ray diffraction data collected in oscillation mode. Methods Enzymol. 276, 307–326 [DOI] [PubMed] [Google Scholar]
- 34. McCoy A. J., Grosse-Kunstleve R. W., Adams P. D., Winn M. D., Storoni L. C., Read R. J. (2007) Phaser crystallographic software. J. Appl. Crystallogr. 40, 658–674 [DOI] [PMC free article] [PubMed] [Google Scholar]
- 35. Emsley P., Lohkamp B., Scott W. G., Cowtan K. (2010) Features and development of Coot. Acta Crystallogr. D Biol. Crystallogr. 66, 486–501 [DOI] [PMC free article] [PubMed] [Google Scholar]
- 36. Adams P. D., Afonine P. V., Bunkóczi G., Chen V. B., Davis I. W., Echols N., Headd J. J., Hung L. W., Kapral G. J., Grosse-Kunstleve R. W., McCoy A. J., Moriarty N. W., Oeffner R., Read R. J., Richardson D. C., Richardson J. S., Terwilliger T. C., Zwart P. H. (2010) PHENIX: a comprehensive Python-based system for macromolecular structure solution. Acta Crystallogr. D Biol. Crystallogr. 66, 213–221 [DOI] [PMC free article] [PubMed] [Google Scholar]
- 37. Laskowski R. A., MacArthur M. W., Moss D. S., Thornton J. M. (1993) PROCHECK: a program to check the stereochemical quality of protein structures. J. Appl. Crystallogr. 26, 283–291 [Google Scholar]
- 38. Schuck P. (2000) Size-distribution analysis of macromolecules by sedimentation velocity ultracentrifugation and lamm equation modeling. Biophys. J. 78, 1606–1619 [DOI] [PMC free article] [PubMed] [Google Scholar]
- 39. Schuck P. (2003) On the analysis of protein self-association by sedimentation velocity analytical ultracentrifugation. Anal. Biochem. 320, 104–124 [DOI] [PubMed] [Google Scholar]
- 40. Klemm J. D., Pabo C. O. (1996) Oct-1 POU domain-DNA interactions: cooperative binding of isolated subdomains and effects of covalent linkage. Genes Dev. 10, 27–36 [DOI] [PubMed] [Google Scholar]