Background: When compared with degradation of the predominant γA-fibrin, lysis of variant γ′-fibrin is delayed.
Results: Thrombin-mediated fibrinopeptide B release is slower from γ′-fibrinogen than from γA-fibrinogen, resulting in delayed binding and activation of plasminogen.
Conclusion: Delayed plasmin generation renders γ′-fibrin resistant to lysis.
Significance: The association between slower clotting and delayed lysis highlights the links between coagulation and fibrinolysis.
Keywords: Enzyme Kinetics, Fibrinogen, Fibrinolysis, Plasminogen, Tissue Plasminogen Activator (tPA), γ′-Fibrinogen
Abstract
Fibrin (Fn) clots formed from γ′-fibrinogen (γ′-Fg), a variant with an elongated γ-chain, are resistant to lysis when compared with clots formed from the predominant γA-Fg, a finding previously attributed to differences in clot structure due to delayed thrombin-mediated fibrinopeptide (FP) B release or impaired cross-linking by factor XIIIa. We investigated whether slower lysis of γ′-Fn reflects delayed plasminogen (Pg) binding and/or activation by tissue plasminogen activator (tPA), reduced plasmin-mediated proteolysis of γ′-Fn, and/or altered cross-linking. Clots formed from γ′-Fg lysed more slowly than those formed from γA-Fg when lysis was initiated with tPA/Pg when FPA and FPB were both released, but not when lysis was initiated with plasmin, or when only FPA was released. Pg bound to γ′-Fn with an association rate constant 22% lower than that to γA-Fn, and the lag time for initiation of Pg activation by tPA was longer with γ′-Fn than with γA-Fn. Once initiated, however, Pg activation kinetics were similar. Factor XIIIa had similar effects on clots formed from both Fg isoforms. Therefore, slower lysis of γ′-Fn clots reflects delayed FPB release, which results in delayed binding and activation of Pg. When clots were formed from Fg mixtures containing more than 20% γ′-Fg, the upper limit of the normal level, the delay in lysis was magnified. These data suggest that circulating levels of γ′-Fg modulate the susceptibility of clots to lysis by slowing Pg activation by tPA and provide another example of the intimate connections between coagulation and fibrinolysis.
Introduction
Hemostasis depends on rapid fibrin (Fn)4 clot formation at sites of vascular injury to stem the flow of blood. By providing a scaffold, Fn endows clots with structural rigidity. Fn is formed from fibrinogen (Fg), a 340-kDa soluble glycoprotein that circulates in plasma at a concentration of about 9 μm (1, 2). Fg is a dimer composed of duplicated Aα-, Bβ-, and γ-chains held together by disulfide bonds. There are two distinct isoforms of Fg in human plasma, which are distinguished by the structure of their γ-chains. The most abundant Fg isoform contains two γA-chains, each composed of 411 amino acid residues, and is designated γA-Fg. About 8–15% of Fg molecules are heterodimers, with one of the γA-chains replaced with a γ′-chain, and are designated γ′-Fg. The γ′-chain, which arises through alternate mRNA processing, possesses a unique anionic 20-amino acid residue extension at its COOH terminus.
Thrombin converts Fg to Fn. This process starts when thrombin binds to the E-domain of Fg, an interaction mediated by exosite 1 on thrombin (3, 4), a positively charged domain that flanks the active site and serves as the substrate docking site. Thrombin converts Fg to Fn monomers by releasing fibrinopeptides A and B (FPA and FPB) from the NH2 termini of the Aα- and Bβ-chains, respectively. Fibrinopeptide release generates knobs that interact with preformed complementary holes located within the D domains of adjacent Fn monomers, a process that initiates the polymerization of Fn monomers into two-stranded protofibrils. The release of FPB, which is slower than that of FPA, initiates lateral aggregation of the protofibrils with a resultant increase in the thickness of the Fn strands (5–7).
The mode of thrombin interaction with γ′-Fg is distinct from that with γA-Fg because the extended γ′-chain endows γ′-Fg with an additional thrombin binding site (3, 8). Although thrombin utilizes exosite 1 to bind to the E-domains of γA-Fg and γ′-Fg, the interaction of thrombin with the γ′-chain is mediated by exosite 2, a negatively charged domain that lies opposite to exosite 1 and serves as the heparin binding site on thrombin. By simultaneously binding to the E-domain and the γ′-chain via exosite 1 and exosite 2, respectively, thrombin forms a bivalent interaction with γ′-Fg that heightens its affinity relative to the univalent interaction of thrombin with γA-Fg and renders thrombin more resistant to inhibition by antithrombin and heparin cofactor II (9). The unique interaction of thrombin with γ′-Fg not only attenuates the reactivity of the enzyme with its inhibitors, but also with its substrates, thereby reducing the activity and availability of thrombin. With less free thrombin, FPB release from γ′-Fg is slower than that from γA-Fg (6), which results in delayed clotting of γ′-Fg relative to γA-Fg (6, 10, 11).
Once the Fn clot serves its barrier function, it must be degraded to restore blood flow, a process known as fibrinolysis. In the intravascular compartment, fibrinolysis is initiated when tissue plasminogen activator (tPA) is released from the vessel wall. tPA converts the zymogen plasminogen (Pg) to the enzyme plasmin (Pn) (12, 13), which then solubilizes Fn and restores blood flow. Fn promotes its own degradation by providing a surface onto which Pg and tPA assemble, a process that increases the catalytic efficiency of Pg activation by at least 2 orders of magnitude. Pg and tPA binding sites on Fg have been localized, but not limited, to the αC-domain (2, 14). During the conversion of Fg to Fn, cryptic binding sites for tPA and Pg are also exposed, which results in additional tPA and Pg binding. Although thrombin-mediated release of FPB has been reported to expose a cryptic Pg binding site (15), the contribution of this binding site to fibrinolysis is unclear.
Lysis of γ′-Fn is delayed relative to that of γA-Fn, a phenomenon that has been attributed to altered thickness of γ′-Fn fibers and/or enhanced cross-linking of γ′-Fn monomers by activated factor XIII (FXIIIa) (6, 10, 11, 16, 17). We hypothesized that the slower release of FPB from γ′-Fg delays the exposure of cryptic Pg binding sites (15) and that this, in turn, delays Pg binding and activation and subsequent fibrinolysis. To test this hypothesis, we (a) compared the rates of lysis of γ′-Fn and γA-Fn with tPA and Pg with those with Pn to determine whether delayed lysis is abrogated when the Pg activation step is bypassed; (b) determined the rates of thrombin-mediated FPA and FPB release from γ′-Fg and γA-Fg to confirm that FPB release from γ′-Fg is delayed; (c) explored the contribution of FPB release by comparing the rates of lysis when γ′-Fg and γA-Fg were clotted with thrombin with those when clotting was induced with batroxobin, a thrombin-like snake venom that only releases FPA; and (d) used a fluorescent Pg derivative to compare the rate of Pg association with γ′-Fn and γA-Fn and surface plasmon resonance to quantify Pg and tPA binding to γ′-Fg and γA-Fg clotted with either thrombin or batroxobin. We show that slower thrombin-mediated release of FPB from γ′-Fg when compared with γA-Fg results in slower Pg binding to γ′-Fn, delayed Pg activation by tPA, and retarded γ′-Fn clot lysis.
EXPERIMENTAL PROCEDURES
Materials
H-d-Val-Leu-Lys-p-nitroaniline-dihydrochloride (S-2251) was from Chromogenix (Mölndal, Sweden). Human Pn, FXIIIa, and α2-antiplasmin were purchased from Hematologic Technologies Inc. (Essex Junction, VT). Human thrombin and unfractionated Fg were from Enzyme Research Laboratories (South Bend, IN). Batroxobin, a thrombin-like enzyme isolated from the venom of Bothrops moojeni that only releases FPA, was purchased from Pentapharm (Basel, Switzerland). An affinity-purified sheep IgG directed against human FXIII was purchased from Affinity Biologicals Inc. (Ancaster, Ontario, Canada). Val-Phe-Lys-chloromethyl ketone (VFKck) and Phe-Pro-Arg-chloromethyl ketone (FPRck) were from EMD Chemicals (Gibbstown, NJ). FPRck-blocked tPA (FPR-tPA) was generated by incubating 1 mg/ml tPA (Genentech Inc., San Francisco, CA) with a 20-fold molar excess of FPRck for 2 h followed by dialysis against 0.02 m HEPES, pH 7.4, 0.15 m NaCl (HBS) as described previously (13). Native Pg, isolated from citrated fresh frozen human plasma using lysine-Sepharose affinity chromatography as described by Castellino and Powell (18) with the modifications outlined by Stewart et al. (19), was stored in aliquots at −80 °C. The Pg active site derivative (S741C) was expressed and isolated from cultured baby hamster kidney cells and labeled with 5-iodoacetamidofluorescein (5-IAF) as described previously (20). All purified proteins were subjected to SDS-PAGE analysis, and concentrations were determined by photospectrometry. To reduce nonspecific effects, 96-well plates were pretreated with HBS containing 1% Tween 80 and rinsed thoroughly with water before use.
Isolation of γ′-Fg and γA-Fg
The two isoforms of Fg were separated by anion exchange chromatography as described previously (3, 21) with slight modifications. Briefly, after passage of Fg through a column containing the FXIII-directed IgG immobilized on Sepharose (1, 3), the flow-through was diluted to 20 mg/ml with 270 mm Tris-phosphoric acid, pH 5.2 (Buffer A). This material was then loaded onto a DEAE-FF-Sepharose column (2.5 × 30 cm, GE Healthcare) pre-equilibrated with Buffer A at a flow rate of 3 ml/min. After collecting γA-Fg in the flow-through, the column was washed extensively with Buffer A prior to elution of the γ′-Fg with 270 mm Tris-phosphoric acid, pH 5.2, and 1 m NaCl. Fractions containing the two Fg isoforms were pooled separately and subjected to precipitation with ammonium sulfate to 19% (1). Fg was recovered by centrifugation, and the pellets were dissolved in HBS, dialyzed against HBS, and stored in aliquots at −80 °C. Purity of the isolated γ′-Fg and γA-Fg was confirmed by SDS-PAGE analysis (Fig. 1). In addition, The absence of γ-γ dimer formation after aliquots were treated with thrombin provided evidence that the Fg preparations were devoid of FXIII (3).
FIGURE 1.
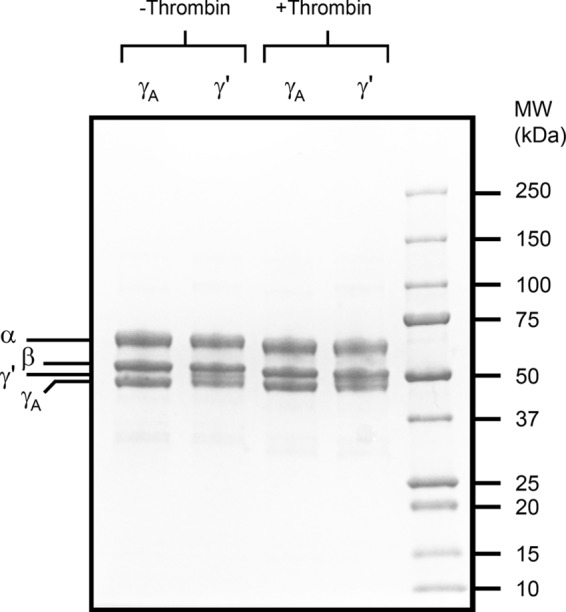
SDS-PAGE analysis of γ′-Fg and γA-Fg. To confirm their purity, γ′-Fg and γA-Fg were subjected to SDS-PAGE analysis under reducing conditions. Prior to electrophoresis, additional aliquots of Fg were incubated with 10 nm thrombin and 10 mm CaCl2, and the absence of γ-γ dimers was used as evidence that the preparations were devoid of factor XIII. Locations of the α, β, γ′ and γA chains are indicated on the left, and the molecular weights of the markers are indicated on the right (MW).
Clotting of γ′-Fg and γA-Fg with Thrombin or Batroxobin
To wells of a 96-well plate maintained at 37 °C containing 1 nm thrombin or 1 unit/ml batroxobin, concentrations that produced similar clot times and increases in absorbance, was added 2–18 μm γ′-Fg or γA-Fg in HBS containing 5 mm CaCl2 and 0.01% Tween 80 to a final volume of 100 μl, and absorbance was then monitored continuously at 400 nm using a Molecular Devices SpectraMax Plus microplate reader (Sunnyvale, CA). The clotting time was determined as the time to reach half-maximal increase in absorbance as calculated by the instrument software (SoftMax Pro, version 5.4).
Quantification of Thrombin-mediated FPA and FPB Release from γ′-Fg and γA-Fg
FPA and FPB were quantified using high performance liquid chromatography as described previously (6, 22), with slight modifications. Briefly, a series of clots was prepared by incubating 10 nm thrombin with solutions consisting of 5 μm γ′-Fg or γA-Fg in HBS containing 5 mm CaCl2 and 0.01% Tween 80 to a final volume of 750 μl for up to 60 min at 37 °C. At intervals, reactions were terminated by the addition of 1 μm FPRck, and after vigorous mixing, tubes were subjected to centrifugation at 12,000 × g for 5 min. From the supernatant, 600 μl was transferred to a new tube and placed on ice. Once chilled, 1.8 ml of 100% ethanol was added, and after incubation for 30 min on ice to precipitate the Fg, the sample was subjected to centrifugation at 12,000 × g for 15 min. A 2-ml aliquot of supernatant was removed and lyophilized to dryness using a SpeedVac and then dissolved in 1 ml of Buffer A (15% acetonitrile and 85% 0.083 m NaH2PO4, pH 3.1). Samples were loaded onto a silica C18 column (Beckman Coulter, Ultrasphere ODS 5 μm, 0.46 × 25 cm) that was pre-equilibrated and washed with Buffer A, and FPA and FPB were eluted using a linear gradient to Buffer B (35% acetonitrile and 65% 0.083 m NaH2PO4, pH 3.1) over 35 min, at a flow rate of 1 ml/min. Peptide elution was monitored by measuring absorbance at 205 nm, and FPA and FPB were quantified by calculating the areas of each peak visualized on the elution chromatogram and comparing them with the concentrations of FPA and FPB released from clots incubated with thrombin under the same conditions for 60 min. The identities of FPA and FPB were confirmed by mass spectrometry as described previously (22).
Comparison of Lysis Times of γ′-Fn or γA-Fn Clots
Studies were performed in 96-well plates to which 5 nm thrombin and 0.25 nm tPA were placed at opposite sides of individual wells. Reactions were initiated by the addition of a mixture containing 2–18 μm γ′-Fg or γA-Fg, 0.67 μm Pg, and 0.33 μm α2-antiplasmin in HBS containing 5 mm CaCl2 and 0.01% Tween 80 to a final volume of 100 μl. Studies were done in the absence or presence of 20 nm FXIIIa. Plates were incubated at 37 °C, and absorbance was monitored continuously at 400 nm. Lysis times were determined as the times to half-maximal decrease in absorbance as calculated by the instrument software. In a separate set of experiments, lysis was initiated with Pn in place of tPA and Pg. Because Fg preparations contain 0.1% (mol/mol) α2-antiplasmin (23), the total Pn concentration added to each reaction mixture was adjusted to achieve a final concentration of 10 nm active Pn, assuming 1:1 inhibition stoichiometry.
Pg Activation in Clots Formed by Incubating γ′-Fg or γA-Fg with Thrombin or Batroxobin
Studies were performed at 37 °C in 96-well plates into which 5 nm thrombin or 3 units/ml batroxobin and 0.25 nm tPA were placed at opposite sides of individual wells. Reactions were initiated by the addition of a mixture containing Pg (in concentrations ranging from 0 to 0.75 μm), 7 μm γ′-Fg or γA-Fg, 5 mm CaCl2, and 400 μm S-2251 in HBS containing 0.01% Tween 80, and absorbance was monitored simultaneously at 405 and 450 nm at 15-s intervals, as described previously (13). Absorbance at 405 nm was corrected for turbidity by subtracting the absorbance determined at 450 nm. The corrected absorbance values were plotted against time-squared, with time 0 set as the time when Fg was added to the wells. Activation rates were then determined from the linear portions of the plots (24). Some conditions produced nonlinear plots, suggesting a delay in the initiation of Pg activation. In these instances, the lag time to initiation of Pg activation with respect to the time of clot formation initiation (tlag) was determined by systemically delaying the analytical window of Pg activation until the plot achieved linearity. The linearized plots were then used to calculate Pg activation rates using the specific activity of Pn against S-2251 in a clot formed from 7 μm Fg of 0.982 Acorr/min/μm.
Effect of Increasing Concentrations of γ′-Fg Relative to γA-Fg on Clot Lysis Times
γ′-Fg and γA-Fg were mixed in varying ratios to generate solutions that contained 0–100% γ′-Fg. The Fg preparations (in final concentrations ranging from 4 to 16 μm) were diluted in HBS with 0.01% Tween 80 containing 0.67 μm Pg, 0.33 μm α2-antiplasmin, and 5 mm CaCl2. These solutions were then added to wells of a 96-well plate containing separate aliquots of 5 nm thrombin and 0.25 nm tPA and incubated at 37 °C. Rates of Pg activation were determined as described above.
Binding of Pg and tPA to Immobilized γ′-Fg or γA-Fg Clotted with Thrombin or Batroxobin
Binding interactions were studied by surface plasmon resonance using a Biacore 1000 (GE Healthcare). Using an amine coupling kit (GE Healthcare), γ′-Fg or γA-Fg, in 10 mm sodium acetate, pH 5.5, or ovalbumin in 10 mm sodium acetate, pH 4.0, was covalently linked to a CM4 sensor chip (Biacore) at a flow rate of 5 μl/min until 6000 response units (RU) were attained. Immobilized Fg was converted to Fn by injecting 0.1 μm thrombin or 2 units/ml batroxobin in HBS containing 2 mm CaCl2 and 0.005% Tween 20 (HBSC-Tw) at a flow rate of 5 μl/min for 60 min (3, 25). This procedure was repeated three times until there was no further reduction in RU, indicating complete release of FPA and/or FPB. Flow cells were then washed with 0.02 m HEPES, 1 m NaCl, 2 mm CaCl2, pH 7.4, containing 0.005% Tween 20 and equilibrated with HBSC-Tw. Glu-Pg (0–30 μm) or FPRck-tPA (0–0.5 μm), diluted in HBSC-Tw containing 40 μm VFKck, was injected at a flow rate of 20 μl/min for 1 min, and flow cells were then washed with HBSC-Tw to monitor dissociation. Between runs, flow cells were regenerated with 0.02 m HEPES, 1 m NaCl, pH 7.4, containing 20 mm ϵ-aminocaproic acid. For each Glu-Pg or FPRck-tPA concentration, RU values at equilibrium (Req) were determined by subtracting the control RU values obtained in the ovalbumin flow cell. Req values then were plotted against the starting concentrations of Pg or FPRck-tPA, and data were fit to a rectangular hyperbola using SigmaPlot (version 8; SPSS) to determine the KD values.
Binding of 5-IAF-Pg to γ′-Fn or γA-Fn
Studies were performed at 37 °C in wells of a white 96-well plate containing 5 nm thrombin. A solution containing 7 μm γ′-Fg or γA-Fg, 5 mm CaCl2, and 5-IAF-Pg (in concentrations ranging from 0 to 0.7 μm) was then added to the wells. The change in fluorescence with each addition, which reflects the conformational change in 5-IAF-Pg that occurs when it binds to Fn (20), was monitored using a SpectraMax M3 (Molecular Devices) fluorescence plate reader with excitation and emission wavelengths set at 495 and 540 nm, respectively, and with a cutoff filter at 530 nm. Fluorescence was unaffected by the changes in turbidity that accompany clotting under these conditions. Because the change in fluorescence is directly proportional to the concentration of 5-IAF-Pg, the fluorescence signal from individual time course profiles generated with each 5-IAF-Pg concentration was divided by the 5-IAF-Pg concentration. Fluorescence values were then expressed as relative change by dividing them by the maximum fluorescence change. The individual time courses were then used to determine the pseudo first-order association rate constant by fitting the data to Equation 1
 |
where RFU is relative fluorescence units, m is the initial slope, k1 is the first-order association rate constant, and t is time. Once calculated, the k1 values were divided by the Fg concentration to determine the second-order rate constant, k2 (26).
Statistical Analysis
Data are presented as mean ± S.D. of at least three independent experiments. Significance of differences was assessed using paired t tests or analysis of variance (GraphPad Prism v5.0), and p values < 0.05 were considered statistically significant.
RESULTS
Comparison of Clotting and Lysis Profiles with γ′-Fg and γA-Fg
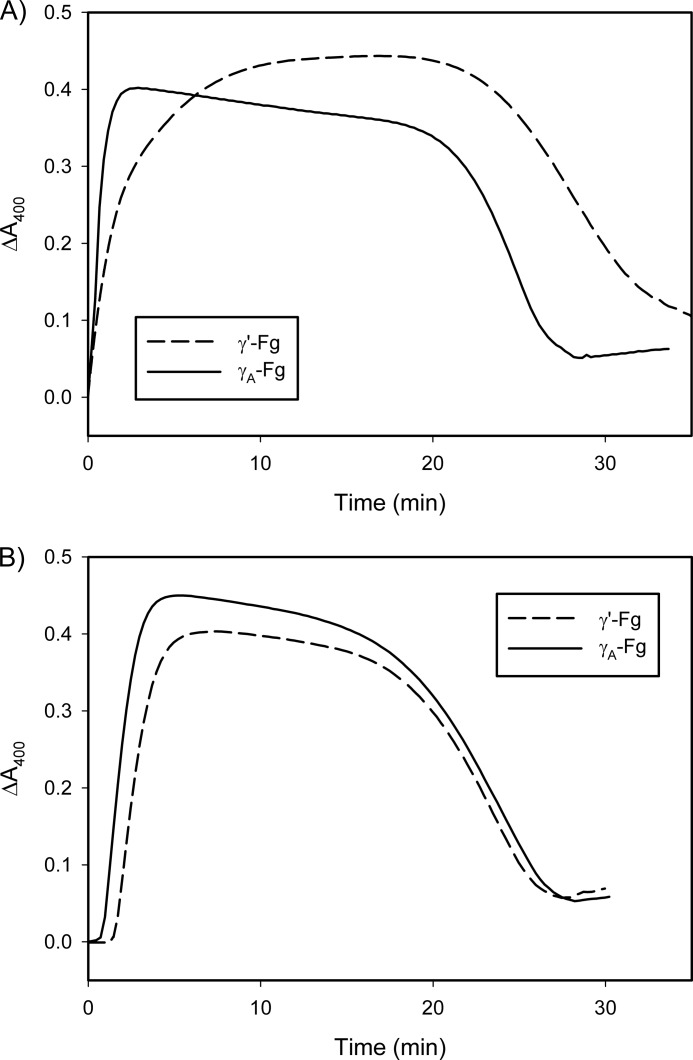
To compare clotting of γ′-Fg and γA-Fg and subsequent lysis, clotting was initiated with thrombin (Fig. 2A) or batroxobin (Fig. 2B) in the presence of tPA and Pg. Spectroscopic analyses demonstrated increases and eventual decreases in absorbance, consistent with clotting and lysis, respectively. When thrombin was used, clotting and lysis times for γ′-Fg were delayed when compared with those for γA-Fg, demonstrating that γ′-Fg affects both processes, as observed previously (6, 16). When batroxobin was used in place of thrombin (Fig. 2B), the clotting time for γ′-Fg was delayed when compared with that for γA-Fg, but lysis times were similar. To better understand these data, clotting and lysis were investigated separately.
FIGURE 2.
Comparison of lysis times of clots formed from γ′-Fg or γA-Fg with thrombin (A) or batroxobin (B). γ′-Fg or γA-Fg (7 μm) was incubated at 37 °C with 0.05 μm Pg and 5 mm CaCl2 in HBS containing 0.01% Tween 80. Reactions were initiated by the addition of the Fg mixtures into wells of a 96-well plate containing separate aliquots of either 5 nm thrombin or 3 units/ml batroxobin, and 0.25 nm tPA, and absorbance was monitored at 400 nm. Lysis time was defined as the time to reach half-maximal decrease in absorbance. Experiments were done at least three times in duplicate, and representative plots are illustrated.
Effect of Fg Concentration on Thrombin- or Batroxobin-induced Clotting of γ′-Fg or γA-Fg
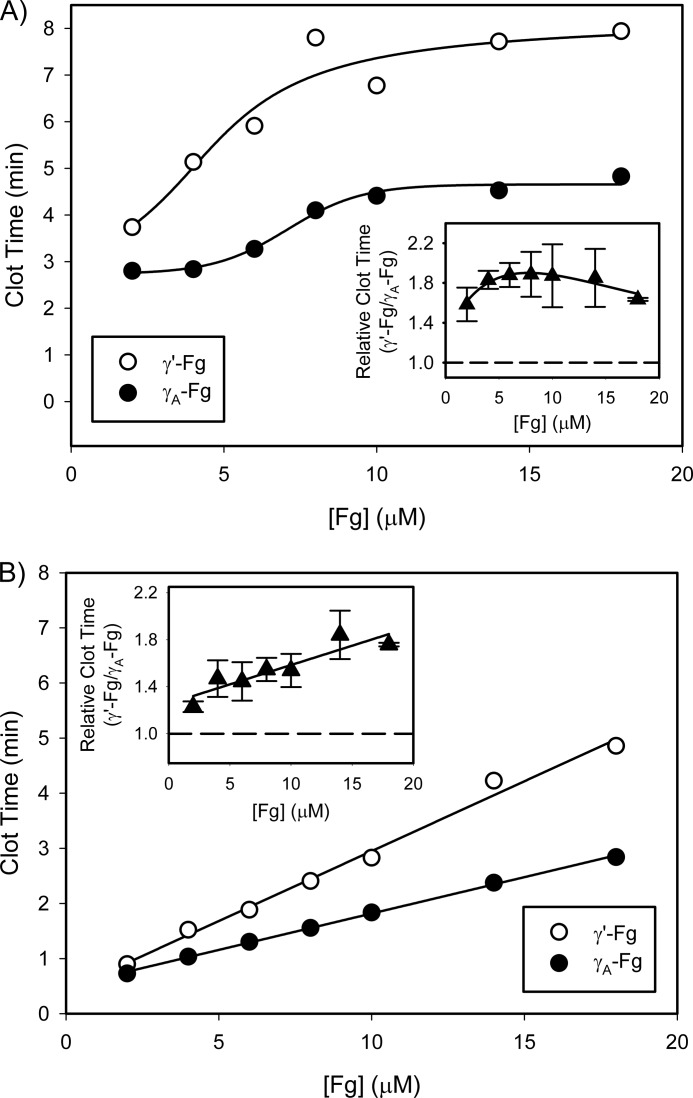
To examine the effect of Fg concentration on clotting of γ′-Fg or γA-Fg, increasing concentrations of γ′-Fg and γA-Fg were incubated with thrombin, and clot time values were determined. Thrombin clotting times were prolonged as the concentrations of both isoforms of Fg were increased from 2 μm up to 9 μm and reached a plateau with higher Fg concentrations (Fig. 3A), a finding consistent with a previous study using unfractionated Fg (23). However, the clotting times for γ′-Fg were longer than those for γA-Fg, as revealed by γ′-Fg/γA-Fg clotting time ratios above 1 (Fig. 3A, inset). Nonetheless, the ratios are independent of initial Fg concentrations (p = 0.5). In contrast, when batroxobin was used in place of thrombin to investigate the role of FPB release during clot formation, the clotting times increased linearly relative to Fg concentrations with both isoforms of Fg and with Fg concentrations up to 18 μm (Fig. 3B). Although the batroxobin clotting times with γ′-Fg were longer than those with γA-Fg, as observed with thrombin (Fig. 3B), the γ′-Fg/γA-Fg clot time ratios with batroxobin increased linearly as a function of the initial Fg concentration (p = 0.01). Therefore, the relationship between the clotting times and initial Fg concentrations differs depending on the enzyme used to initiate clotting.
FIGURE 3.
Comparison of clotting times of γ′-Fg and γA-Fg when clotting is initiated with thrombin or batroxobin. γ′-Fg (open circles) or γA-Fg (closed circles), in concentrations ranging from 2 to 18 μm, was incubated at 37 °C with 5 mm CaCl2 in HBS containing 0.01% Tween 80. A and B, reactions were initiated by adding the mixtures to wells of a 96-well plate containing either 1 nm thrombin (A) or 1 unit/ml batroxobin (B). The insets represent the relative clotting times calculated by dividing the clotting time of γ′-Fg by that of γA-Fg. Symbols represent the means of at least three experiments, and the bars above and below the symbols reflect S.D. The lines connecting the symbols were generated to best fit the data.
Thrombin-mediated FPA and FPB Release from γ′-Fg and γA-Fg
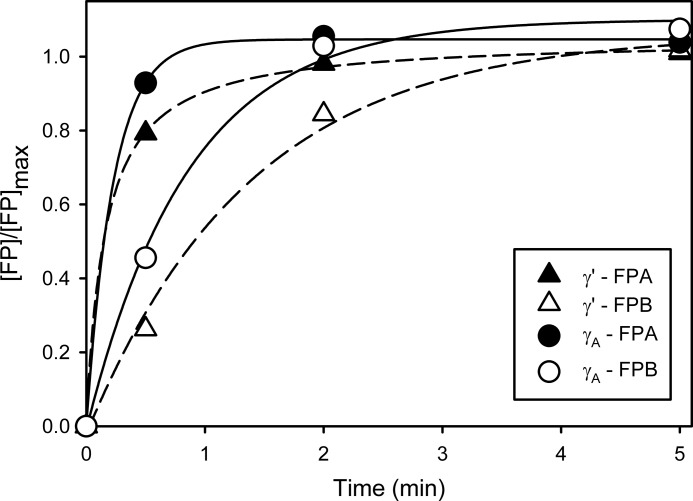
The time courses of thrombin-mediated FPA and FPB release from γ′-Fg were compared with those from γA-Fg. As expected, FPA release from both isoforms of Fg was faster than FPB release, and 80–90% of the maximal FPA was released within 30 s (Fig. 4). In contrast, FPB release from γ′-Fg was slower than that from γA-Fg. The times required to achieve half-maximal FPB release from γ′-Fg and γA-Fg were 0.97 ± 0.02 and 0.60 ± 0.09 min, respectively (p = 0.04). These findings raise the possibility that the delayed clotting of γ′-Fg relative to γA-Fg may reflect slower release of FPB, results consistent with those reported by Cooper et al. (6). Furthermore, we infer that the difference in the relationship between the clot times and the γ′-Fg or γA-Fg concentrations observed between thrombin and batroxobin (Fig. 3, insets) results from the failure of batroxobin to release FPB.
FIGURE 4.
Comparison of time courses of thrombin-mediated release of FPA and FPB from γ′-Fg and γA-Fg. γ′-Fg or γA-Fg (5 μm) was incubated with 10 nm thrombin in HBS containing 0.01% Tween 80 and 5 mm CaCl2 for 60 min at 37 °C. Reactions were stopped at the times indicated by the addition of FPRck to 1 μm. After precipitation of Fg with ethanol as described under “Experimental Procedures,” supernatants were subjected to HPLC analysis using a C18 column to isolate and quantify FPA and FPB. Symbols represent the mean of two experiments, each done in duplicate. Broken lines indicate γ′-Fg, while the solid lines reflect γA-Fg.
Comparison of Lysis Times of Clots Formed from γ′-Fg or γA-Fg
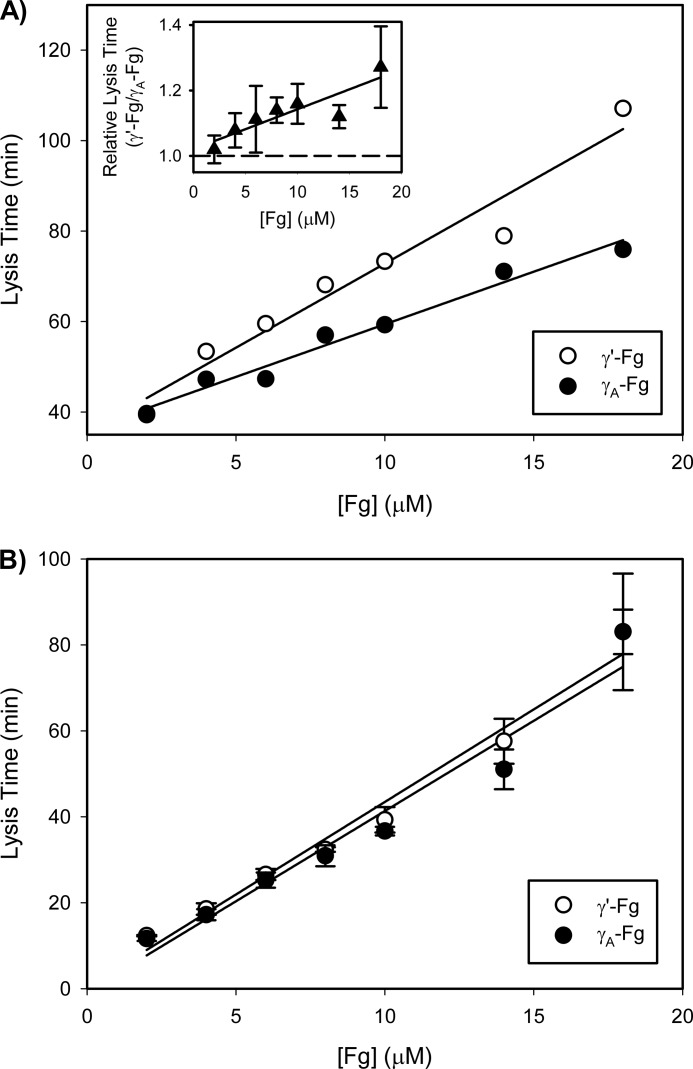
In initial experiments, γ′-Fg or γA-Fg was clotted with thrombin, and tPA and Pg were used to initiate lysis. Because lysis times are directly proportional to Fg concentrations (23), clots were prepared with varying Fg concentrations. Consistent with previous findings (23), with both Fg isoforms, lysis times increased linearly as a function of the initial Fg concentration (Fig. 5A). Examination of γ′-Fg/γA-Fg lysis time ratios reveals that (a) at all concentrations of γ′-Fg or γA-Fg, lysis of γ′-Fn clots is slower than that of γA-Fn clots; and (b) the magnitude of this delay increases with higher concentrations of Fg (Fig. 5A, inset) (p = 0.04). This finding suggests that lysis times are positively correlated with γ′-Fg levels.
FIGURE 5.
Comparison of clotting of γ′-Fg or γA-Fg and lysis of γ′-Fn or γA-Fn clots. A, γ′-Fg (open circles) or γA-Fg (closed circles), at concentrations ranging from 2 to 18 μm, was incubated at 37 °C with 5 mm CaCl2, 0.33 μm α2-antiplasmin, and 0.67 μm Glu-Pg in HBS containing 0.01% Tween 80. Reactions were initiated by adding the mixtures to wells of a 96-well plate containing 5 nm thrombin and 0.25 nm tPA, and absorbance was monitored at 400 nm. A representative plot is illustrated. B, γ′-Fg (open circles) or γA-Fg (closed circles), at concentrations ranging from 2 to 18 μm, was incubated at 37 °C with 5 mm CaCl2 in HBS containing 0.01% Tween 80. Reactions were initiated by adding the mixtures to wells of a 96-well plate containing 5 nm thrombin and 5 nm Pn, and absorbance was monitored at 400 nm. In all experiments, clotting and lysis times were calculated as the times to half-maximal increase and decrease in absorbance, respectively. The inset in panel A shows the ratios of lysis times of γ′-Fn clots to those of γA-Fn clots. Symbols represent the mean of at least three experiments, while the bars above the symbols reflect S.D. Lines were generated by linear regression analysis.
In the next set of experiments, lysis was initiated with Pn instead of tPA plus Pg, thereby bypassing the Pg activation step. Although the linear relationship between lysis times and initial Fg concentrations was preserved, the delay in lysis times of γ′-Fn clots relative to γA-Fn clots was no longer evident (Fig. 5B). Together, these data suggest that delayed lysis of γ′-Fn clots is more likely to reflect delayed Pg activation than impaired degradation of γ′-Fn by Pn.
Influence of FXIIIa-mediated Crosslinking on Lysis
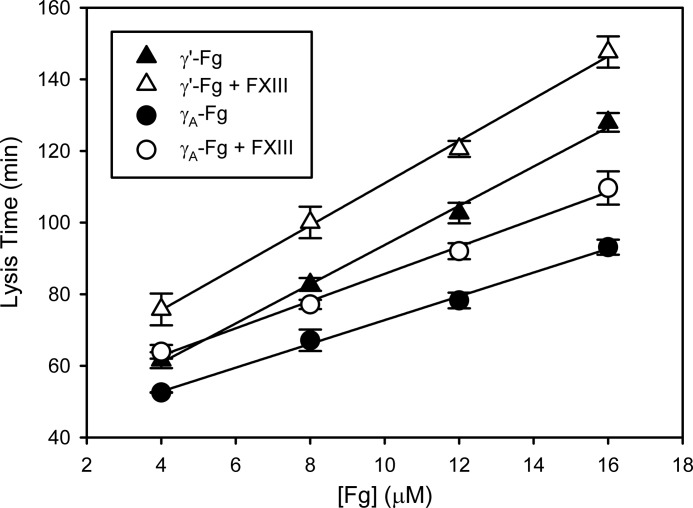
To determine whether crosslinking contributes to the delayed lysis of γ′-Fn clots, lysis experiments with tPA/Pg were repeated in the presence of 20 nm FXIIIa. In the presence of FXIIIa, lysis times were prolonged by 15 min regardless of the Fg isoform or concentration (Fig. 6). The slopes were determined from plots of lysis times versus Fg concentrations to compare differences among the various conditions investigated. The slopes with γA-Fg were 3.3 ± 0.1 and 3.7 ± 0.2 min/μm in the absence and presence of FXIIIa, respectively, whereas those with γ′-Fg were 5.5 ± 0.1 and 5.9 ± 0.2 min/μm, respectively. The addition of FXIIIa had no effect on lysis times of clots formed from either isoform of Fg when Pn was used in place of Pg/tPA (data not shown). Therefore, although differences in the slopes between the two Fg isoforms were retained, the slopes with each isoform in the presence of FXIIIa were similar to those in its absence, suggesting that crosslinking is unlikely to explain the resistance of γ′-Fn clots to lysis.
FIGURE 6.
Influence of FXIIIa on tPA-mediated lysis of γ′-Fn or γA-Fn clots. γ′-Fg (triangles) or γA-Fg (circles), at concentrations ranging from 4 to 16 μm, was incubated at 37 °C with 0.33 μm α2-antiplasmin, 0.67 μm Pg, and 5 mm CaCl2 in HBS containing 0.01% Tween 80, in the presence (open symbols) or absence (closed symbols) of 20 nm FXIIIa. Reactions were initiated by adding the mixtures to wells of a 96-well plate containing 5 nm thrombin and 0.25 nm tPA, and absorbance was monitored at 400 nm. Lysis times were calculated as the time to half-maximal decrease in absorbance. Symbols represent the mean of at least three experiments, while the bars above the symbols reflect S.D. Lines were generated by linear regression analysis.
Rates of Pg Activation by tPA When γ′-Fg or γA-Fg Is Clotted with Thrombin or Batroxobin
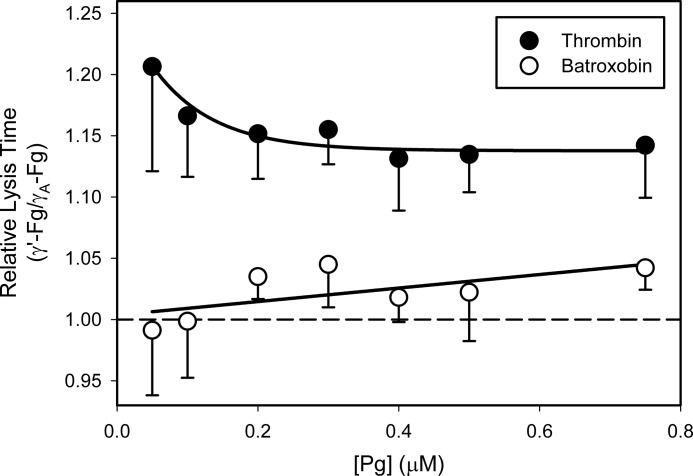
To further investigate the mechanism responsible for delayed lysis of γ′-Fn clots, we determined lysis times and quantified rates of Pg activation by tPA as a function of Pg concentration. Clots were formed with either thrombin or batroxobin to examine the role of FPB release. When formed with thrombin, lysis times of γ′-Fn clots were 1.15-fold longer than those of γA-Fn clots with all concentrations of Pg (Fig. 7). In contrast, when clots were formed with batroxobin, lysis times of γ′-Fn and γA-Fn clots were similar. Because failure to release FPB differentiates batroxobin from thrombin, these findings suggest that FPB release is a prerequisite for the delayed lysis of γ′-Fn clots. With both thrombin and batroxobin, γ′-Fg clotted more slowly than γA-Fg. Consequently, the observation that only when clots are formed with thrombin is lysis of γ′-Fn clots delayed makes it unlikely that the delay solely reflects impaired clot formation.
FIGURE 7.
Comparison of lysis times of clots formed from γ′-Fg or γA-Fg with thrombin or batroxobin. γ′-Fg or γA-Fg (7 μm) was incubated at 37 °C with Pg, at concentrations ranging from 0 to 0.75 μm, 5 mm CaCl2, and 400 μm S-2251. Clots were formed by adding the mixtures to wells of a 96-well plate containing either 5 nm thrombin (closed symbols) or 3 units/ml batroxobin (open symbols) and 0.25 nm tPA. Absorbance was monitored at 400 nm, and lysis times were determined as described in the legend for Fig. 2. Each experiment done at least three times, and symbols represent the mean relative lysis times, which were calculated by dividing the lysis times of γ′-Fn clots by those of γA-Fn, while the bars above the symbols reflect S.D. The lines joining the symbols were arbitrary. The dashed line represents normalization ratio of 1, indicating equal lysis times.
Inclusion of S-2251 in these experiments permits quantification of the rates of Pg activation from the A405 versus time-squared plots (23, 27). With γA-Fn clots, the plots were linear from the time of clot formation, suggesting coincident Pg activation (not shown). In contrast, with γ′-Fn clots, the plots displayed a nonlinear profile, suggesting delayed Pg activation. To quantify the delay, tlag values were determined by systemically advancing the analytical time frame until the plot achieved linearity. The tlag values were longer when γ′-Fg was clotted with thrombin than with batroxobin (95.0 ± 15.6 and 12.5 ± 10.9 s, respectively; p < 0.01). Therefore, the delay in Pg activation occurs with thrombin, but not with batroxobin, suggesting that slower release of FPB from γ′-Fg is a critical determinant of the delayed initiation of Pg activation.
Rates of Pg activation were plotted as a function of the initial Pg concentration to determine the kcat and Km values (Table 1). The kcat values ranged from 0.129 and 0.161 s−1, whereas the Km values ranged from 0.11 and 0.14 μm, none of which were significantly different. These data suggest that once initiated, rates of Pg activation are independent of whether or not FPB is released and are similar with both Fg isoforms. Together, these data suggest that the slower lysis of γ′-Fn clots relative to γA-Fn clots can be attributed to slower thrombin-mediated FPB release and subsequent delayed initiation of Pg activation.
TABLE 1.
Kinetic parameters for Pg activation by tPA in the presence of γ′-Fn or γA-Fn
Fn was formed by clotting 7 μm of γ′-Fg or γA-Fg with 5 nm thrombin or 3 units/ml batroxobin. Pg activation was quantified by monitoring S-2251 hydrolysis, and activation rates were determined to obtain the kcat and Km values. Values represent mean ± S.D. of at least three separate experiments.
| Thrombin |
Batroxobin |
|||
|---|---|---|---|---|
| kcat | Km | kcat | Km | |
| s−1 | μm | s−1 | μm | |
| γA-Fn | 0.129 ± 0.033 | 0.14 ± 0.02 | 0.161 ± 0.088 | 0.12 ± 0.01 |
| γ′-Fn | 0.151 ± 0.028 | 0.14 ± 0.03 | 0.146 ± 0.088 | 0.11 ± 0.03 |
Effect of Increasing Concentrations of γ′-Fg Relative to γA-Fg on Clot Lysis Times
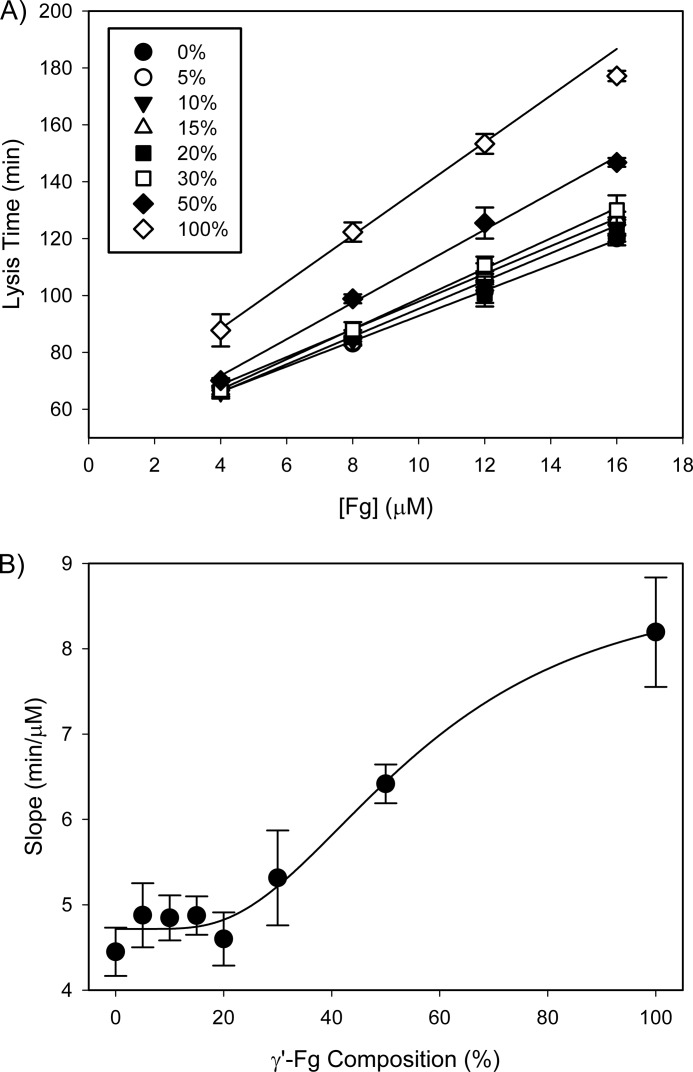
With all concentrations of γ′-Fg tested, lysis times were directly proportional to the initial Fg concentration (Fig. 8A). From this plot, slopes were determined and plotted against the percentage of γ′-Fg relative to γA-Fg used to form the clots (Fig. 8B). Lysis times were only significantly delayed when γ′-Fg represented more than 20% of the total Fg (p < 0.05). When clots contained more than 20% γ′-Fg, lysis times were not only affected by the γ′-Fg content, but also by the total Fg concentration. This finding raises the possibility that these two factors influence clot lysis via distinct mechanisms.
FIGURE 8.
Influence of the extent of γ′-Fg composition on clot lysis times. A, samples containing total Fg concentrations ranging from 4 to 16 μm were prepared with varying amounts of γ′-Fg relative to γA-Fg. Clots were formed, and lysis was monitored as described in the legend for Fig. 2. Lysis times are plotted versus initial Fg concentration, and data were analyzed by linear regression. B, slopes from A are plotted versus the percentage of γ′-Fg composition. Symbols represent the means of at least three experiments, while the bars reflect S.D.
Binding of Glu-Pg and tPA to Immobilized γ′-Fn or γA-Fn
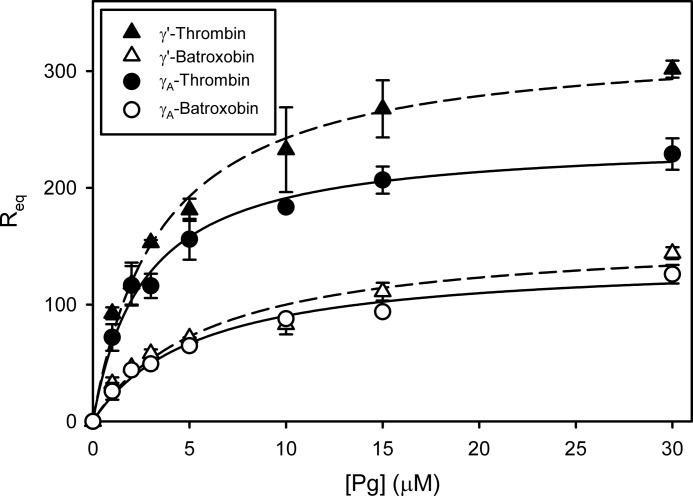
The affinities of Glu-Pg and tPA for immobilized Fn were assessed by surface plasmon resonance to determine whether the Fg isoform influences binding. Req values for their interaction with Fn were plotted versus Pg or tPA concentration, respectively. FPRck-tPA bound to γ′-Fn and γA-Fn with similar affinities regardless of whether the Fg was converted to Fn with thrombin or batroxobin (not shown). In contrast, with both isoforms, an average of 1.9-fold more Pg bound at equilibrium when thrombin was used to convert the Fg to Fn than when batroxobin was used (Fig. 9). Thus, when clotted with thrombin, γ′-Fn bound 32% more Pg at equilibrium than γA-Fn (p < 0.0001). In contrast, no significant difference in Pg binding to γ′-Fn and γA-Fn was observed when batroxobin was used to induce clotting. Pg bound to γA-Fn prepared with thrombin or batroxobin with KD values of 2.7 ± 0.3 and 5.5 ± 1.4 μm, respectively, and to γ′-Fn prepared with thrombin or batroxobin with KD values of 3.6 ± 0.2 and 6.0 ± 0.1 μm, respectively. These data suggest that at equilibrium, (a) more Pg binds to Fn when FPA and FPB have both been released than when only FPA is released, and (b) more Pg binds to γ′-Fn than to γA-Fn only when both FPA and FPB have been released.
FIGURE 9.
Binding of Pg to immobilized γ′-Fn or γA-Fn as determined by surface plasmon resonance. After immobilizing γ′-Fg (triangles and dashed lines) or γA-Fg (circles and solid lines) onto a CM4 chip, the Fg was converted to Fn by injection of thrombin (closed symbol) or batroxobin (open symbol). Pg, at concentrations ranging from 0 to 30 μm, was injected into the flow cells, and the corrected RU values at equilibrium (Req) were plotted versus the initial Pg concentration. The KD values ± S.D. were determined by nonlinear regression analysis of the data (lines).
5-IAF-Pg Binding to γ′-Fn or γA-Fn
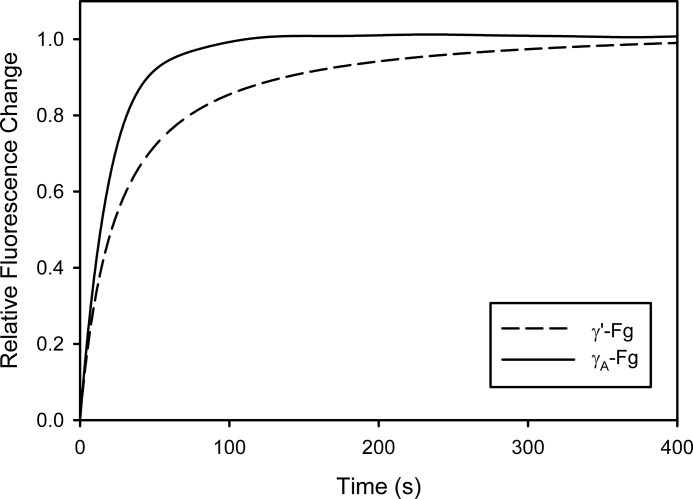
As another indicator of the influence of the Fg isoform on Pg binding, the interaction of 5-IAF-Pg with Fn was monitored in real time as γ′-Fg or γA-Fg was clotted with thrombin. Previous studies have shown that binding of ϵ-aminocaproic acid, a lysine analog, to 5-IAF-Pg results in increased fluorescence reflecting the change in Pg conformation from the closed to open form (20). Dejouvencel et al. (28) showed that Glu-Pg undergoes a similar conformational change when it binds to Fn. Capitalizing on this response, we monitored the binding of 5-IAF-Pg to Fn by measuring the change in RFU as Fg was converted to Fn with thrombin. With both isoforms of Fg, the increase in 5-IAF-Pg fluorescence was directly proportional to the 5-IAF-Pg concentration (not shown). When changes in RFU were normalized relative to the 5-IAF-Pg concentration and averaged (Fig. 10), the association rate value for 5-IAF-Pg binding to γ′-Fn was 22% lower than that to γA-Fn (4663 ± 510 and 5952 ± 404 m−1 s−1, respectively; p < 0.0005), a finding consistent with significantly slower association of Pg with γ′-Fn than with γA-Fn. These data suggest that delayed FPB removal from γ′-Fg not only affects the rate of clot formation, but also delays Pg binding.
FIGURE 10.
Time courses of 5-IAF-Pg binding to γ′-Fn or γA-Fn formed by thrombin. A solution containing 7 μm γ′-Fg (dashed line) or γA-Fg (solid line), 5 mm CaCl2, and 5-IAF-Pg, in concentrations ranging from 0 to 0.7 μm, was added to wells containing 5 nm thrombin. Fluorescence was measured at excitation and emission wavelengths of 495 and 540 nm, respectively, with a cutoff filter at 530 nm. The fluorescence signals from individual time course profiles generated with each 5-IAF-Pg concentration were divided by the 5-IAF-Pg concentration and averaged. Fluorescence values were then expressed as relative change by dividing them by the maximum fluorescence change. Each line represents the mean of seven time course profiles.
DISCUSSION
The purpose of this study was to determine why clots formed from the variant γ′-Fg are resistant to lysis when compared with those formed from the predominant γA-Fg. Although previous work suggested that this difference reflects alterations in the structure of γ′-Fn clots and/or enhanced stability because of increased FXIIIa-mediated crosslinking (6, 10, 11, 16, 17), we explored additional explanations. We show that (a) thrombin-mediated release of FPB from γ′-Fg is slower than that from γA-Fg; (b) when γ′-Fg is clotted with thrombin, but not with batroxobin, the rate of binding of Pg is reduced, and Pg activation is delayed; (c) when the Pg activation step is bypassed by using Pn in place of tPA and Pg, γ′-Fn and γA-Fn clots degrade at similar rates; and (d) with FXIIIa addition, degradation of γ′-Fn and γA-Fn clots is slowed to a similar extent. Therefore, γ′-Fn clots demonstrate impaired Pg binding and activation relative to γA-Fn clots.
The observation that batroxobin, when used in place of thrombin, abrogates both the delayed Pg activation by tPA in the presence of γ′-Fn and the slower lysis of γ′-Fn clots relative to γA-Fn clots identifies FPB release as a key determinant of fibrinolysis. The correlation between FPB release and initiation of Pg activation by tPA is consistent with the work of Doolittle and Pandi (15) who reported that a cryptic Pg binding site on Fg is exposed upon FPB release. With γ′-Fg, exposure of this cryptic Pg binding site is delayed because thrombin-mediated FPB release from γ′-Fg is slower than that from γA-Fg. In support of delayed exposure of this cryptic binding site, the time course of association of fluorescent Pg with γ′-Fn is slower than that with γA-Fn. Delayed binding of Pg to γ′-Fn retards the formation of the ternary Pg-tPA-Fn complex, thereby explaining why Pg activation by tPA in the presence of γ′-Fn is delayed relative to that in the presence of γA-Fn. Lysis of γ′-Fn clots is slower than that of γA-Fn clots because of delayed Pn generation, and not because of differences in Pn activity. Therefore, slower thrombin-mediated release of FPB from γ′-Fg delays exposure of the cryptic Pg binding site, and this, in turn, delays Pg binding, Pg activation by tPA, and γ′-Fn clot lysis.
Although the fluorescence data show that Pg associates with γ′-Fn more slowly than with γA-Fn, the surface plasmon resonance results indicate that once Fg is converted to Fn, more Pg binds to γ′-Fn than to γA-Fn at equilibrium but only when FPA and FPB are both released. This observation provides further support for the concept that the release of FPB exposes a cryptic Pg binding site that is responsible for the enhanced Pg binding. Despite the increased binding of Pg to γ′-Fn formed with thrombin, however, Pg activation by tPA is delayed. A potential explanation comes from the work of Horrevoets et al. (12), which demonstrated that with Fn concentrations above 1 μm, the kinetic parameters for Pg activation by tPA are independent of the Fn concentration. Furthermore, the differences in Pg binding to γ′-Fn or γA-Fn are minimal at the Pg concentrations used in our lysis studies (0.67 μm) or with the physiologic Pg concentration of 2 μm. Taken together, the linearity obtained in our lysis time data, together with the fact that similar lysis times were observed with Pg concentrations between 0.2 and 0.8 μm (not shown), suggest that Pg availability is not the rate-limiting step. Consequently, the difference in Pg binding at equilibrium is unlikely to be relevant under the conditions of our experiments. Furthermore, with a KD value of 3–6 μm for the interaction of Pg with Fn, it is likely that little Pg is bound under physiological conditions. Consequently, the delayed exposure of the Pg binding site on γ′-Fn and the slower initiation of Pg activation by tPA are likely to outweigh the modest increase in Pg binding. In support of this concept, once Pg activation is initiated, the rates of Pg activation by tPA are similar in the presence of either γ′-Fn or γA-Fn. Therefore, the rate-limiting step is likely to be assembly of the ternary tPA-Pg-Fn complex, which occurs more slowly with γ′-Fn than with γA-Fn.
FXIIIa crosslinks Fn clots and renders them less susceptible to lysis by tPA and Pg. FXIII has been reported to associate with γ′-Fg (7, 29, 30), and enhanced FXIIIa-mediated crosslinking has been proposed as a mechanism responsible for the slower lysis of γ′-Fn clots relative to γA-Fn clots (10, 16). When we repeated our studies in the presence of FXIIIa, tPA-mediated lysis of γ′-Fn and γA-Fn clots was delayed to a similar extent. Therefore, it is unlikely that delayed lysis of γ′-Fn clots relative to γA-Fn clots reflects enhanced FXIIIa-mediated crosslinking.
When compared with γA-Fg, γ′-Fg is both slower to clot and slower to degrade. It is not surprising that fibrinolysis is influenced by clotting because Fn is at least 100-fold more efficient than Fg at promoting Pg activation by tPA (31). However, other than formation and polymerization of Fn monomers, the aspects of clotting that modulate the fibrinolytic system are unknown. Although FPA release alone is sufficient to induce Fn polymerization, the relationship between clotting times and the initial Fg concentration is only altered when FPA and FPB are both released. Regardless of whether thrombin or batroxobin is used to initiate clotting, however, γ′-Fg clots more slowly than γA-Fg. The slower clotting of γ′-Fg is associated with altered clot structure because the maximum absorbance observed with clotting of γ′-Fg differs from that with γA-Fg, a finding consistent with previous studies (6, 10, 11). The work of Suenson et al. (5) suggests that protofibril formation, rather than lateral fibril association, enables Fn to enhance Pg activation. This could explain the altered clot structure and delayed lysis of γ′-Fn clots because γ′-Fg has been reported to interfere with protofibril growth during the Fn polymerization process (10). Taken together, these reports support the hypothesis that slower thrombin-mediated FPB release from γ′-Fg and/or the altered structure of γ′-Fn clots delay the binding of Pg and its subsequent activation by tPA.
Fg is a well established biomarker of cardiovascular disease (32–35), and high levels of total Fg and γ′-Fg have been correlated with increased cardiovascular risk (36–41). Some studies suggest the γ′-Fg/γA-Fg ratio, which is inversely correlated with risk, may provide more information than the total Fg level or the level of γ′-Fg alone (36–38). To explore how this ratio might impact clot lysis times, clots were formed from samples containing increasing concentrations of Fg and various ratios of γ′-Fg relative to γA-Fg, and lysis times were determined. With Fg concentrations spanning the physiological range of 9 μm, lysis times increased in a concentration-dependent fashion. Although lysis times of γ′-Fn clots were longer than those of γA-Fn clots regardless of the concentration of Fg from which the clots were generated, the difference in lysis times between the two Fg isoforms increased with higher concentrations of Fg. In addition, lysis times were prolonged when the proportion of γ′-Fg relative to γA-Fg exceeded 20%. Although the association between increased Fg levels and cardiovascular risk is well established, it remains unknown whether Fg plays a causative role. Our studies provide a biochemical rationale to explain the association between γ′-Fg levels and cardiovascular risk; slower FPB release delays Pg binding and activation and retards Fn clot lysis, thereby promoting thrombosis.
In summary, not only have we identified the mechanism responsible for delayed lysis of γ′-Fn clots, but our studies also suggest that this difference will be exaggerated with higher total Fg concentrations and when the proportion of γ′-Fg relative to γA-Fg exceeds 20%. These findings raise the possibility that the increase in total Fg and γ′-Fg levels that occurs in association with acute or chronic inflammatory conditions may predispose patients to thrombosis.
Acknowledgments
We thank Chengliang Wu and Dr. Michael Nesheim for providing the S741C-Pg derivative-expressing baby hamster kidney cell line, and Dr. Peter Gross for assistance with the statistical analysis.
The work was supported in part by Canadian Institutes of Health Research Grants MOP 3992, MOP 102735, and CTP 79846, the Heart and Stroke Foundation of Ontario, and the Ontario Research and Development Challenge Fund.
- Fn
- fibrin
- Pg
- plasminogen
- tPA
- tissue-type plasminogen activator
- Pn
- plasmin
- Fg
- fibrinogen
- γA-Fg
- homodimer with two γA-chains
- γ′-Fg
- heterodimer where one of the γA-chains contains an elongated COOH terminus
- FPRck
- Phe-Pro-Arg chloromethyl ketone
- VFKck
- Val-Phe-Lys-chloromethyl ketone
- FP
- fibrinopeptide(s)
- 5-IAF
- 5-iodoacetamidofluorescein
- FXIIIa
- activated factor XIII
- S-2251
- H-d-Val-Leu-Lys-p-nitroaniline-dihydrochloride
- HBS
- HEPES-buffered saline
- RU
- response units
- RFU
- relative fluorescence units.
REFERENCES
- 1. Walker J. B., Nesheim M. E. (1999) The molecular weights, mass distribution, chain composition, and structure of soluble fibrin degradation products released from a fibrin clot perfused with plasmin. J. Biol. Chem. 274, 5201–5212 [DOI] [PubMed] [Google Scholar]
- 2. Mosesson M. W. (2005) Fibrinogen and fibrin structure and functions. J. Thromb. Haemost. 3, 1894–1904 [DOI] [PubMed] [Google Scholar]
- 3. Fredenburgh J. C., Stafford A. R., Leslie B. A., Weitz J. I. (2008) Bivalent binding to γA/γ′-fibrin engages both exosites of thrombin and protects it from inhibition by the antithrombin-heparin complex. J. Biol. Chem. 283, 2470–2477 [DOI] [PubMed] [Google Scholar]
- 4. Pospisil C. H., Stafford A. R., Fredenburgh J. C., Weitz J. I. (2003) Evidence that both exosites on thrombin participate in its high affinity interaction with fibrin. J. Biol. Chem. 278, 21584–21591 [DOI] [PubMed] [Google Scholar]
- 5. Suenson E., Bjerrum P., Holm A., Lind B., Meldal M., Selmer J., Petersen L. C. (1990) The role of fragment X polymers in the fibrin enhancement of tissue plasminogen activator-catalyzed plasmin formation. J. Biol. Chem. 265, 22228–22237 [PubMed] [Google Scholar]
- 6. Cooper A. V., Standeven K. F., Ariëns R. A. (2003) Fibrinogen γ-chain splice variant γ′ alters fibrin formation and structure. Blood 102, 535–540 [DOI] [PubMed] [Google Scholar]
- 7. Wolberg A. S. (2012) Determinants of fibrin formation, structure, and function. Curr. Opin. Hematol. 19, 349–356 [DOI] [PubMed] [Google Scholar]
- 8. Meh D. A., Siebenlist K. R., Mosesson M. W. (1996) Identification and characterization of the thrombin binding sites on fibrin. J. Biol. Chem. 271, 23121–23125 [DOI] [PubMed] [Google Scholar]
- 9. Chan H. H., Leslie B. A., Stafford A. R., Roberts R. S., Al-Aswad N. N., Fredenburgh J. C., Weitz J. I. (2012) By increasing the affinity of heparin for fibrin, Zn2+ promotes the formation of a ternary heparin-thrombin-fibrin complex that protects thrombin from inhibition by antithrombin. Biochemistry 51, 7964–7973 [DOI] [PubMed] [Google Scholar]
- 10. Allan P., Uitte de Willige S., Abou-Saleh R. H., Connell S. D., Ariëns R. A. (2012) Evidence that fibrinogen γ′ directly interferes with protofibril growth: implications for fibrin structure and clot stiffness. J. Thromb. Haemost. 10, 1072–1080 [DOI] [PubMed] [Google Scholar]
- 11. Gersh K. C., Nagaswami C., Weisel J. W., Lord S. T. (2009) The presence of γ′ chain impairs fibrin polymerization. Thromb. Res. 124, 356–363 [DOI] [PMC free article] [PubMed] [Google Scholar]
- 12. Horrevoets A. J., Pannekoek H., Nesheim M. E. (1997) A steady-state template model that describes the kinetics of fibrin-stimulated [Glu1]- and [Lys78]plasminogen activation by native tissue-type plasminogen activator and variants that lack either the finger or kringle-2 domain. J. Biol. Chem. 272, 2183–2191 [DOI] [PubMed] [Google Scholar]
- 13. Kim P. Y., Tieu L. D., Stafford A. R., Fredenburgh J. C., Weitz J. I. (2012) A high affinity interaction of plasminogen with fibrin is not essential for efficient activation by tissue-type plasminogen activator. J. Biol. Chem. 287, 4652–4661 [DOI] [PMC free article] [PubMed] [Google Scholar]
- 14. Tsurupa G., Medved L. (2001) Identification and characterization of novel tPA- and plasminogen-binding sites within fibrin(ogen) α C-domains. Biochemistry 40, 801–808 [DOI] [PubMed] [Google Scholar]
- 15. Doolittle R. F., Pandi L. (2006) Binding of synthetic B knobs to fibrinogen changes the character of fibrin and inhibits its ability to activate tissue plasminogen activator and its destruction by plasmin. Biochemistry 45, 2657–2667 [DOI] [PubMed] [Google Scholar]
- 16. Falls L. A., Farrell D. H. (1997) Resistance of γA/γ′ fibrin clots to fibrinolysis. J. Biol. Chem. 272, 14251–14256 [DOI] [PubMed] [Google Scholar]
- 17. Collet J. P., Nagaswami C., Farrell D. H., Montalescot G., Weisel J. W. (2004) Influence of γ′ fibrinogen splice variant on fibrin physical properties and fibrinolysis rate. Arterioscler. Thromb. Vasc. Biol. 24, 382–386 [DOI] [PubMed] [Google Scholar]
- 18. Castellino F. J., Powell J. R. (1981) Human plasminogen. Methods Enzymol. 80, 365–378 [DOI] [PubMed] [Google Scholar]
- 19. Stewart R. J., Fredenburgh J. C., Weitz J. I. (1998) Characterization of the interactions of plasminogen and tissue and vampire bat plasminogen activators with fibrinogen, fibrin, and the complex of d-dimer noncovalently linked to fragment E. J. Biol. Chem. 273, 18292–18299 [DOI] [PubMed] [Google Scholar]
- 20. Horrevoets A. J. G., Pannekoek H., Nesheim M. E. (1997) Production and characterization of recombinant human plasminogen(S741C-fluorescein). A novel approach to study zymogen activation without generation of active protease. J. Biol. Chem. 272, 2176–2182 [DOI] [PubMed] [Google Scholar]
- 21. Siebenlist K. R., Meh D. A., Mosesson M. W. (1996) Plasma factor XIII binds specifically to fibrinogen molecules containing γ′ chains. Biochemistry 35, 10448–10453 [DOI] [PubMed] [Google Scholar]
- 22. Vu T. T., Stafford A. R., Leslie B. A., Kim P. Y., Fredenburgh J. C., Weitz J. I. (2013) Batroxobin binds fibrin with higher affinity and promotes clot expansion to a greater extent than thrombin. J. Biol. Chem. 288, 16862–16871 [DOI] [PMC free article] [PubMed] [Google Scholar]
- 23. Kim P. Y., Stewart R. J., Lipson S. M., Nesheim M. E. (2007) The relative kinetics of clotting and lysis provide a biochemical rationale for the correlation between elevated fibrinogen and cardiovascular disease. J. Thromb. Haemost. 5, 1250–1256 [DOI] [PubMed] [Google Scholar]
- 24. Schneider M., Nesheim M. (2004) A study of the protection of plasmin from antiplasmin inhibition within an intact fibrin clot during the course of clot lysis. J. Biol. Chem. 279, 13333–13339 [DOI] [PubMed] [Google Scholar]
- 25. Vu T. T., Stafford A. R., Leslie B. A., Kim P. Y., Fredenburgh J. C., Weitz J. I. (2011) Histidine-rich glycoprotein binds fibrin(ogen) with high affinity and competes with thrombin for binding to the γ′-chain. J. Biol. Chem. 286, 30314–30323 [DOI] [PMC free article] [PubMed] [Google Scholar]
- 26. Ye J., Rezaie A. R., Esmon C. T. (1994) Glycosaminoglycan contributions to both protein C activation and thrombin inhibition involve a common arginine-rich site in thrombin that includes residues arginine 93, 97, and 101. J. Biol. Chem. 269, 17965–17970 [PubMed] [Google Scholar]
- 27. Senis Y. A., Kim P. Y., Fuller G. L., García A., Prabhakar S., Wilkinson M. C., Brittan H., Zitzmann N., Wait R., Warrell D. A., Watson S. P., Kamiguti A. S., Theakston R. D., Nesheim M. E., Laing G. D. (2006) Isolation and characterization of cotiaractivase, a novel low molecular weight prothrombin activator from the venom of Bothrops cotiara. Biochim. Biophys. Acta 1764, 863–871 [DOI] [PubMed] [Google Scholar]
- 28. Dejouvencel T., Doeuvre L., Lacroix R., Plawinski L., Dignat-George F., Lijnen H. R., Anglés-Cano E. (2010) Fibrinolytic cross-talk: a new mechanism for plasmin formation. Blood 115, 2048–2056 [DOI] [PMC free article] [PubMed] [Google Scholar]
- 29. Ariëns R. A., Lai T. S., Weisel J. W., Greenberg C. S., Grant P. J. (2002) Role of factor XIII in fibrin clot formation and effects of genetic polymorphisms. Blood 100, 743–754 [DOI] [PubMed] [Google Scholar]
- 30. Hethershaw E. L., Cilia La Corte A. L., Duval C., Ali M., Grant P. J., Ariëns R. A., Philippou H. (2014) The effect of blood coagulation factor XIII on fibrin clot structure and fibrinolysis. J. Thromb. Haemost. 12, 197–205 [DOI] [PubMed] [Google Scholar]
- 31. Hoylaerts M., Rijken D. C., Lijnen H. R., Collen D. (1982) Kinetics of the activation of plasminogen by human tissue plasminogen activator. Role of fibrin. J. Biol. Chem. 257, 2912–2919 [PubMed] [Google Scholar]
- 32. Maresca G., Di Blasio A., Marchioli R., Di Minno G. (1999) Measuring plasma fibrinogen to predict stroke and myocardial infarction: an update. Arterioscler. Thromb. Vasc. Biol. 19, 1368–1377 [DOI] [PubMed] [Google Scholar]
- 33. Tribouilloy C., Peltier M., Colas L., Senni M., Ganry O., Rey J. L., Lesbre J. P. (1998) Fibrinogen is an independent marker for thoracic aortic atherosclerosis. Am. J. Cardiol. 81, 321–326 [DOI] [PubMed] [Google Scholar]
- 34. Danesh J., Collins R., Appleby P., Peto R. (1998) Association of fibrinogen, C-reactive protein, albumin, or leukocyte count with coronary heart disease: meta-analyses of prospective studies. JAMA 279, 1477–1482 [DOI] [PubMed] [Google Scholar]
- 35. Ma J., Hennekens C. H., Ridker P. M., Stampfer M. J. (1999) A prospective study of fibrinogen and risk of myocardial infarction in the Physicians' Health Study. J. Am. Coll. Cardiol. 33, 1347–1352 [DOI] [PubMed] [Google Scholar]
- 36. Cheung E. Y., Uitte de Willige S., Vos H. L., Leebeek F. W., Dippel D. W., Bertina R. M., de Maat M. P. (2008) Fibrinogen γ′ in ischemic stroke: a case-control study. Stroke 39, 1033–1035 [DOI] [PubMed] [Google Scholar]
- 37. Pieters M., Kotze R. C., Jerling J. C., Kruger A., Ariëns R. A. (2013) Evidence that fibrinogen γ′ regulates plasma clot structure and lysis and relationship to cardiovascular risk factors in black Africans. Blood 121, 3254–3260 [DOI] [PubMed] [Google Scholar]
- 38. Uitte de Willige S., de Visser M. C., Houwing-Duistermaat J. J., Rosendaal F. R., Vos H. L., Bertina R. M. (2005) Genetic variation in the fibrinogen γ gene increases the risk for deep venous thrombosis by reducing plasma fibrinogen γ′ levels. Blood 106, 4176–4183 [DOI] [PubMed] [Google Scholar]
- 39. Mannila M. N., Lovely R. S., Kazmierczak S. C., Eriksson P., Samnegård A., Farrell D. H., Hamsten A., Silveira A. (2007) Elevated plasma fibrinogen γ′ concentration is associated with myocardial infarction: effects of variation in fibrinogen genes and environmental factors. J. Thromb. Haemost. 5, 766–773 [DOI] [PubMed] [Google Scholar]
- 40. Lovely R. S., Kazmierczak S. C., Massaro J. M., D'Agostino R. B., Sr., O'Donnell C. J., Farrell D. H. (2010) γ′ fibrinogen: evaluation of a new assay for study of associations with cardiovascular disease. Clin. Chem. 56, 781–788 [DOI] [PMC free article] [PubMed] [Google Scholar]
- 41. Lovely R. S., Falls L. A., Al-Mondhiry H. A., Chambers C. E., Sexton G. J., Ni H., Farrell D. H. (2002) Association of γA/γ′ fibrinogen levels and coronary artery disease. Thromb. Haemost. 88, 26–31 [PubMed] [Google Scholar]


