

Background: The response to vemurafenib in V600E BRAF+ve melanoma is short lived due to acquisition of vemurafenib resistance.
Results: NRAS expression and increased MAPK activation drive vemurafenib resistance in V600E BRAF+ve melanoma.
Conclusion: Resistance to vemurafenib in melanoma is complex and can be mitigated by MAPK and NRAS inhibition.
Significance: These findings could lead to improved therapy of V600E BRAF+ve melanoma by targeting MAPKs and NRAS.
Keywords: c-Jun N-terminal Kinase (JNK), Extracellular Signal-regulated Kinase (ERK), Melanoma, Mitogen-activated Protein Kinase (MAPK), p38, Acquired Drug Resistance, NRAS, Vemurafenib
Abstract
Although targeting the V600E activating mutation in the BRAF gene, the most common genetic abnormality in melanoma, has shown clinical efficacy in melanoma patients, response is, invariably, short lived. To better understand mechanisms underlying this acquisition of resistance to BRAF-targeted therapy in previously responsive melanomas, we induced vemurafenib resistance in two V600E BRAF+ve melanoma cell lines, A375 and DM443, by serial in vitro vemurafenib exposure. The resulting approximately 10-fold more vemurafenib-resistant cell lines, A375rVem and D443rVem, had higher growth rates and showed differential collateral resistance to cisplatin, melphalan, and temozolomide. The acquisition of vemurafenib resistance was associated with significantly increased NRAS levels in A375rVem and D443rVem, increased activation of the prosurvival protein, AKT, and the MAPKs, ERK, JNK, and P38, which correlated with decreased levels of the MAPK inhibitor protein, GSTP1. Despite the increased NRAS, whole exome sequencing showed no NRAS gene mutations. Inhibition of all three MAPKs and siRNA-mediated NRAS suppression both reversed vemurafenib resistance significantly in A375rVem and DM443rVem. Together, the results indicate a mechanism of acquired vemurafenib resistance in V600E BRAF+ve melanoma cells that involves increased activation of all three human MAPKs and the PI3K pathway, as well as increased NRAS expression, which, contrary to previous reports, was not associated with mutations in the NRAS gene. The data highlight the complexity of the acquired vemurafenib resistance phenotype and the challenge of optimizing BRAF-targeted therapy in this disease. They also suggest that targeting the MAPKs and/or NRAS may provide a strategy to mitigate such resistance in V600E BRAF+ve melanoma.
Introduction
The incidence of melanoma in the United States is increasing faster than that of all other malignancies (1). Although treatment outcome in early stage melanoma is generally good, advanced melanoma is highly treatment-refractory, and following systemic chemotherapy, overall response rates are ∼20%, with complete response rates approaching only 5% and a median survival of only 4.5–12.5 months (2–4). There is, thus, a continued need for a better understanding of the underlying biology and molecular mechanisms involved in the therapeutic response of these tumors in order to develop more effective therapies for them.
A common abnormality present in up to 60% of melanomas and their metastases is an activating mutation at nucleotide 1,796 in the proto-oncogene, BRAF, which changes codon 600 from valine to glutamic acid (V600E) and results in a constitutively activated BRAF oncogene and activation of its downstream target MAPK kinase, MEK1/2, and, ultimately the downstream MAPK target, ERK (5–7). The activated BRAF → MEK → ERK pathway, resulting from the V600E BRAF, has been shown to drive melanoma cell proliferation and is implicated in poor therapeutic outcome in melanoma (5–7). This strong relationship between the activated ERK pathway, increased melanoma cell growth, and the V600E BRAF mutation has led to significant efforts to target this pathway in the treatment of melanoma (8, 9), and in 2011, vemurafenib was approved by the United States Food and Drug Administration for advanced melanoma therapy. Although, in clinical trials, BRAF-targeted therapy of melanoma has shown significant overall response rates, approaching 80%, the median duration of progression-free survival is less than 6 months (10). Consequently, several groups are focusing efforts on gaining a better understanding of the mechanisms underlying such resistance with the hope that this will facilitate the development of alternative clinical strategies to improve melanoma therapy (11–15). Important findings, to date, that have been shown to contribute to resistance to BRAF-targeted therapy include the identification, in preclinical tumor models, of activated NRAS mutations that act on downstream targets via CRAF; increased levels of CRAF that, by dimerization with BRAF, restores the signaling cascade; “rewiring” of the MAPK pathway, such that ARAF or CRAF can activate downstream targets; constitutively active MEK mutations; aberrant activation of MEK; enhanced RTK (PDGFRβ, EGFR, IGFR1) activity; and elevated levels of activated AKT that creates a prosurvival state in the cells (11, 12, 14, 16–18). Other studies have shown that melanoma cells become dependent on the MAPK pathway in the setting of vemurafenib resistance and that intermittent dosing strategies may combat this dependence and delay the development of resistance to vemurafenib (13).
Despite these advances, the mechanisms underlying acquired resistance to BRAF-targeted therapy remain not fully understood, thus making it difficult to design more effective strategies to overcome it clinically. This study was undertaken to shed light on this important problem with a focus on the MAPK and the RAS/RAF pathways. We generated vemurafenib resistance in two V600E BRAF+ve human melanoma cell lines and, using the paired parental and resistant cells, investigated mechanistic aspects of the biology underlying the acquisition of vemurafenib resistance. These cell lines also provide a model and platform for further mechanistic investigations and for testing alternative novel therapeutic strategies for overcoming acquired vemurafenib resistance in melanoma.
EXPERIMENTAL PROCEDURES
Cell Culture
The DM443 (Duke Melanoma 443) cell line was derived from a primary specimen from a melanoma patient and was a generous gift from Dr. Hilliard Seigler (Duke University Medical Center). A375 was purchased from the American Type Culture Collection (ATCC, Manassas, VA). Both cell lines were maintained at 37 °C and 5% CO2 in Isocove's modified Dulbecco's medium, supplemented with 10% fetal bovine serum (FBS) and 1% penicillin/streptomycin, and were confirmed to be free of mycoplasma before use in the experiments.
Reagents
Cisplatin was obtained from the Duke University Medical Center Pharmacy, melphalan was from Sigma-Aldrich, vemurafenib was from ChemieTek (Indianapolis, IN), and temozolomide was from Schering-Plough (now Merck). Antibodies against ERK1/2 (137F5) and phospho-ERK1/2 (Thr-202/Tyr-204), MEK1/2 (D1A5), and phospho-MEK1/2 (Ser-217/221), JNK and phospho-JNK (Thr-183/Tyr-185), p38 and phospho-p38 (Thr-180/Tyr-182), CRAF and phospho-CRAF (Ser-259), ARAF, phospho-ARAF (Ser-299), AKT (11E7) and phospho-AKT (Ser-473), and GAPDH were all purchased from Cell Signaling Technology (Danvers, MA). Antibodies against BRAF (F-7) and NRAS were from Santa Cruz Biotechnology, Inc. (Dallas, TX), whereas anti-human GSTP1 antibody (MSA-102) was from Assay Designs (Ann Arbor, MI). The cell-permeable small molecule-specific ERK inhibitor, 3-[2-aminoethyl)-5-(4-ethoxyphenyl)methylene]-2,4-thiazolidinedione·HCl(AEMT),2 and p38 inhibitor, phenylaminodibenzosuberone-diol (skepinone-L) were both purchased from Calbiochem. The specific JNK inhibitor, N-(4-amino-5-cyano-6-ethoxy-2-pyridinyl)-2,5-dimethoxybenzeneacetamide (TCS JNK 60), was purchased from Tocris (Minneapolis, MN). All other reagents, unless otherwise stated, were from Sigma-Aldrich.
Generation of Vemurafenib-resistant Human Melanoma Cell Lines
To generate vemurafenib-resistant melanoma sublines, exponentially growing cells of the two parental cell lines, A375 and DM443, were treated with a previously determined vemurafenib IC10 of the respective cell line. After attaining confluence, the cells were repassaged and retreated with the vemurafenib IC10. After every three passages, the vemurafenib sensitivity was redetermined, the IC10 was recomputed, and the process was repeated until the vemurafenib resistance was stably increased severalfold over that of the parental cells (11, 12). The resulting vemurafenib-resistant cell lines, A375rVem and DM443rVem, were maintained in culture medium at the corresponding vemurafenib IC10.
Population Kinetics, Cell Survival Assays, and Drug Sensitivity
These were all performed by monitoring cell growth in real time. Briefly, melanoma cells in exponential growth were plated at 4 × 10³ cells/well of a gold-plated 96-well microtiter plate and incubated at 37 °C and 5% CO2 in a humidified atmosphere on a computer-controlled real-time automated electro-sensing platform (Acea, San Diego, CA). The impedance of each well surface, which is proportional to the number of cells on the well surface at any given time, is recorded at 15-min intervals over 7–10 days. Using a standard curve, the impedance readings were transposed into cell number and plotted against time to generate growth/survival curves. Population kinetics analysis was performed, and growth kinetic constants were computed, as we described previously (19), using the equation, n = NoekR, where, No is the starting cell number, N is the cell number at a given time t during the exponential growth phase, and R is the population growth rate.
To determine drug sensitivity, cells were plated, as described above, and after 24 h, they were treated with serially diluted drug solutions to achieve the following concentrations: vemurafenib (0–20 μm), cisplatin (0–150 μm), melphalan (0–300 μm), and temozolomide (0–5 mm). Cell growth was monitored in real time, as described earlier. After normalization against controls, surviving fractions were computed and plotted against the drug concentrations to obtain a dose-response curve for each drug. IC10 and IC50 values, the concentration in which 90 and 50% of cells survive, respectively, were obtained through curve fitting of the dose-response curves.
Flow Cytometry and Cell Cycle Analysis
Cells of each melanoma cell line were plated in 75-cm2 flasks under standard culture conditions, as described earlier. When the cultures were approximately 80% confluent, the cells were trypsinized, washed in PBS, fixed in 70% ethanol at 4 °C for 1 h, and rehydrated in PBS. After treatment with 100 μg/ml RNase A, the cells were stained with 50 μg/ml propidium iodide (Sigma) for 30 min at room temperature and analyzed on a FACScan flow cytometer (BD Biosciences) at the Duke University Core Facility. Cell cycle distribution was computed using WinMDI software. The pre-G1 phase fraction was used as the apoptotic fraction.
In Vivo Evaluation of Vemurafenib Resistance
One million cells of the parental A375 and DM443 and the vemurafenib-resistant A375rVem and DM443rVem in 50 μl of a (2:1) PBS/Matrigel (BD Biosciences) were injected into the right hind limb of 8-week-old nude athymic mice (Charles River Laboratory, Wilmington, MA). Xenografts were measured daily with calipers, and the tumor volume was computed as ½(width × length2). When the tumors were approximately 5 mm in the greatest dimension, daily treatment with orally gavaged vemurafenib (50 mg/kg) was initiated in half of each cohort (10 treatment mice and 10 control mice/xenograft), and tumor measurement continued until study endpoints were reached (40 days after xenograft injection or maximum tumor size allowed ≥2 cm3). The tumor volume was plotted against time to obtain the in vivo tumor growth curve.
Western Blot Analysis of Cell Signaling Proteins
Western blotting, performed as we described previously (20, 28), was used to determine the levels of and changes in specific proteins in their phosphorylated and unphosphorylated forms and to determine their role in the vemurafenib resistance phenotype of the cell lines. Briefly, exponentially growing cultures of each cell line were harvested by trypsinization and lysed by sonication in PBS containing a mixture of protease inhibitors. The cell lysates were clarified by centrifugation at 14,000 × g for 15 min, and the protein concentration was determined by the Bradford method (21). Discontinuous 1% SDS-polyacrylamide gel electrophoresis, using 40 μg of protein, was performed, after which the proteins were electrotransferred to PVDF membranes. The membranes were blocked with 5% BSA for 1 h at room temperature, incubated overnight at 4 °C with appropriate dilutions of each primary antibody (1:1,000 for all antibodies except NRAS, which was diluted 1:500), and treated with the respective avidin-conjugated secondary antibody (1:10,000 anti-rabbit or anti-mouse) for 45 min at room temperature. Immunoreactive bands were visualized by the avidin-biotin chemiluminescence method (Pierce ECL, Thermo Scientific) and quantified by densitometry.
BRAF and NRAS Whole Exome Sequencing
Total RNA was isolated from exponentially growing melanoma cell lines using the Perfect Pure RNA isolation kit (Fisher) according to the manufacturer's protocols and 2 μg of RNA in first-strand cDNA synthesis (GoScriptTM reverse transcription system, Promega, Madison, WI) with oligo(dT)20 primer, according to the manufacturer's protocols. The reaction was diluted to 25 ng of DNA/μl, and 4 μl of cDNA was used to set up a 50-μl PCR containing 1.5 mm MgCl2, a 0.2 μm concentration of different sets of the specific forward and reverse primers for BRAF or NRAS, 0.4 mm dNTP, 1× GOTAG buffer, and 2 units of GOTAG DNA polymerase (Promega). PCR cycling conditions were as follows: 94 °C for 2 min (denaturation), followed by 40 cycles of 0.5 min at 94 °C, 0.5 min 55 °C, and 2.5 min at 72 °C, and a final extension for 7 min at 72 °C. The PCR products were monitored by electrophoresis in 1.5% agarose, ethidium bromide, and UV light visualization. After purification (Qiaquick PCR purification kit, Qiagen), each DNA sample was sequenced by the Duke University DNA Analysis Facility using the Applied Biosystems Dye Terminator Cycle Sequencing system with AmpliTaq DNA polymerase and ABI 377 PRISM DNA sequencing instruments and software.
Effect of Down-regulation of NRAS and Inhibition of MAPKs on Vemurafenib Resistance
These studies were designed to determine the functionality/role of the changes in NRAS and MAPK signaling in the acquired vemurafenib resistance phenotype and whether these are drivers of the resistance in melanoma cells. To inhibit MAPK activity, exponentially growing A375, A375rVem, DM443, and DM443rVem cells were treated with a 7.5 μm concentration of the ERK inhibitor AEMT, a 2.5 μm concentration of the JNK inhibitor TCS JNK 60, or a 0.5 μm concentration of the p38 inhibitor skepinone-L. The concentrations used had been predetermined to be non-toxic (≤IC10) and to inhibit the respective MAPK by 80% or more, relative to controls. To suppress NRAS expression, the cells were transfected with 10 nm Stealth NRAS-targeted siRNA with the sequence AGUCAUUUGCGGAUAUUAACCUCUA, using Lipofectamine, as we previously reported (28). One hour after MAPK inhibition or 48 h after NRAS siRNA transfection, the cells were treated with vemurafenib to achieve final concentrations of 0–10 μm, and cell growth was monitored by real-time cell sensing, as described previously. Controls were untreated and vehicle-treated (for MAPK inhibitors) or transfected with scrambled NRAS siRNA (for NRAS suppression). Cell growth was monitored by real-time cell sensing, as described previously. Replicate MAPK-inhibited or NRAS siRNA-transfected cells and controls were harvested and monitored for MAPK activity, as we described earlier (28), and for NRAS suppression by Western blotting.
Clonal Analysis of BRAF Mutation in Cell Population
A 320-base pair cDNA fragment spanning codon 600 of BRAF was synthesized from each cell line as described above, using the following primer set: 5′-CCGGCCGGCCGGCCGG-3′ (forward) and 5′-AATTAATTAATTAATTAATTAATT-3′ (reverse). The amplified cDNA was size-confirmed by agarose gel electrophoresis, and the PCR product was purified and cloned into the pGEM-T vector (Promega, Madison WI), according to the manufacturer's protocol, using an insert/vector ratio of 5:1 with ligation at 4 °C for 16 h. JM109-competent cells were mixed with 2 μl of the ligation reaction, and 100 μl of the mixture was plated on an LB agar plate containing 100 μg/ml ampicillin, 80 μg/ml X-gal, and 0.5 mm isopropyl 1-thio-β-d-galactopyranoside for colony selection. After 16 h at 37 °C, 20 positive clones were selected and expanded in LB medium containing 100 μg of ampicillin, and the purified plasmid was subjected to DNA sequencing, as we described earlier.
RESULTS
Generation and Characterization of Acquired Vemurafenib-resistant Human Melanoma Cell Lines
The in vitro vemurafenib dose-response curves for the parental A375 and DM443 and the vemurafenib-resistant A375rVem and DM443rVem are shown in Fig. 1. From the survival curves, we computed the respective IC10 and IC50 values to be 0.05 and 0.8 μm for A375, 3 and 11.3 μm for A573rVem, 0.06 and 0.85 μm for DM443, and 3 and 6.6 μm for DM443rVem, respectively. Based on the IC50 values, A375rVem was 14.1-fold and DM443rVem was 7.8-fold more resistant than the respective parental cell lines (Table 1). Removal of vemurafenib from the culture medium for five passages on vemurafenib sensitivity of the resistant cell lines had no statistically significant effect on the vemurafenib IC50 for A375rVem and DM443rVem, relative to those of the parental cell lines. Both A375rVem and DM443rVem were maintained routinely in 3 μm vemurafenib.
FIGURE 1.

Serial dose-response curves showing generation of acquired vemurafenib resistance in A375 and DM443 melanoma cell lines. For each generation, cells were cultured in the IC10 dose of vemurafenib for three passages and reexamined for vemurafenib sensitivity. Note the increasing vemurafenib resistance of the cell lines with each increasing generation.
TABLE 1.
Vemurafenib sensitivity of parental and vemurafenib-resistant melanoma cell lines
IC10 and IC50 values represent the concentration required to achieve 10 and 50% decrease, respectively, in cell survival.
| Cell line | Vemurafenib |
|
|---|---|---|
| IC10 | IC50 | |
| μm | ||
| A375 | 0.05 | 0.8 |
| A375rVem | 3.0 | 11.3 |
| -Fold resistancea | 16 | 14.1 |
| DM443 | 0.06 | 0.85 |
| DM443rVem | 3.0 | 6.6 |
| -Fold resistancea | 50 | 7.76 |
a -Fold resistance is defined as the IC10 or IC50 of the resistant cell line/IC10 or IC50 of the parental cell line.
Acquired Resistance to Vemurafenib Is Associated with Collateral Resistance to DNA-damaging Chemotherapeutic Agents
The parental cell lines, A375 and DM443, and their acquired vemurafenib-resistant sublines, A375rVem and DM443rVem, were examined for their sensitivity to three vemurafenib-unrelated DNA-damaging anticancer agents used in melanoma therapy, namely cisplatin, melphalan, and temozolomide. The results, summarized in Fig. 2, show that, in contrast to the parental cell lines, both vemurafenib-resistant cell lines were significantly cross-resistant to all three cytotoxic agents, despite their structural and mechanistic unrelatedness to vemurafenib. Table 2 shows the IC50 values of A375 to increase from 0.6 μm (cisplatin), 2.3 μm (melphalan), and 0.2 mm (temozolomide) to 2.1 μm (cisplatin), 14.6 μm (melphalan), and 1 mm (temozolomide) in A375rVem and from 7.7 μm (cisplatin), 110 μm (melphalan), and 0.8 mm (temozolomide) in DM443 to 10.2 μm (cisplatin), 175 μm (melphalan), and 2.2 mm (temozolomide) for DM443rVem. It is noteworthy that, overall, the DM443 and DM443rVem cell lines were significantly more resistant to cisplatin, melphalan, and temozolomide than the A375/A375rVem cell line pair. The former also demonstrated a lower -fold change in sensitivity to all three agents upon acquisition of vemurafenib resistance.
FIGURE 2.

Dose-response curves of paired parental/vemurafenib-resistant melanoma cell lines showing relative collateral resistance of acquired vemurafenib-resistant cell lines to DNA-damaging chemotherapeutic agents. Note the overall higher resistance of DM443/DM443rVem compared with A375/A375rVem.
TABLE 2.
Sensitivity of parental and vemurafenib-resistant melanoma cell lines to cisplatin, melphalan, and temozolomide
| Cell line | IC50 values |
||
|---|---|---|---|
| Cisplatin | Melphalan | Temozolomide | |
| μm | |||
| A375 | 0.6 | 2.3 | 0.2 |
| A375rVem | 2.1 | 14.6 | 1.0 |
| -Fold resistancea | 3.5 | 6.35 | 5.0 |
| DM443 | 7.7 | 110 | 0.8 |
| DM443rVem | 10.2 | 175 | 2.2 |
| -Fold resistancea | 1.30 | 1.60 | 2.75 |
a -Fold resistance is defined as the IC50 (resistant cell line)/IC50 (parental cell line).
Population Growth Kinetics
The results of the population growth kinetic studies of the paired parental and vemurafenib-resistant cell lines are summarized in Table 3 and show that, with the acquisition of vemurafenib resistance, the population growth rate for A375 increased significantly (p ≤ 0.05) from 4.83 × 10⁻² ± 1.64 × 10⁻⁴ h−1 for A375 to 6.80 × 10⁻² ± 2.21 × 10⁻⁴ h−1 for A375rVem. In contrast, for DM443, with the development of vemurafenib resistance, the growth rate decreased from 3.25 × 10⁻² ± 2.40 × 10⁻⁴ h−1 for the parental cell line to 9.22 × 10⁻³ ± 6.0210−5 h−1 for the vemurafenib-resistant DM443rVem cell line. The results of the cell cycle phase distribution analysis (Table 3) are consistent with the altered growth rates of the cell lines following acquisition of vemurafenib resistance. In both cell lines, the apoptotic fractions (pre-G1) were very low (<0.1% for A375/A375rVem and <3% for DM443/DM443rVem), and the proportion of cells in G1 decreased by approximately 25% in both parental cell lines relative to the resistant cell lines. In contrast, the proportion of S-phase cells increased 1.8-fold for A375/A375rVem and decreased 2.7-fold for the DM443/DM443rVem pair, consistent with their increased and decreased growth rates, respectively, observed in the population kinetic studies.
TABLE 3.
Population growth rates and cell cycle phase distribution of parental and acquired vemurafenib-resistant melanoma cell lines
| Cell line | Population growth rate | Cell cycle phase distribution |
|||
|---|---|---|---|---|---|
| Pre-G1 | G1 | S | G2/M | ||
| Hr−1 | % | % | % | % | |
| A375 | 4.83 × 10⁻² ± 1.64 × 10⁻⁴ | 0.05 ± 0.01 | 78.74 ± 0.19 | 11.27 ± 0.6 | 10.30 ± 0.16 |
| A375rVem | 6.80 × 10⁻² ± 2.21 × 10⁻⁴ | 0.08 ± 0.02 | 58.55 ± 0.42 | 18.65 ± 0.48 | 23.37 ± 0.68 |
| DM443 | 3.25 × 10⁻² ± 2.40 × 10⁻⁴ | 1.06 ± 0.13 | 73.70 ± 0.86 | 12.37 ± 0.54 | 13.3 ± 0.22 |
| DM443rVem | 9.22 × 10⁻³ ± 6.02 × 10⁻⁵ | 3.26 ± 0.16 | 55.60 ± 0.27 | 33.25 ± 0.28 | 8.14 ± 0.40 |
Sensitivity of Melanoma Cells to Low Dose Vemurafenib
Metronomic drug therapy has been proposed as a therapeutic strategy in melanoma (22). We therefore examined the sensitivity of the parental cell lines, A375 and DM443, and their acquired vemurafenib-resistant counterparts, A375rVem and DM443rVem, to low dose (0–2.5 μm) vemurafenib. The results, summarized in Fig. 3, show that, in contrast to the acquired vemurafenib-resistant cell lines, A375rVem and DM443rVem, the parental cell lines, A375 and DM443, were highly sensitive to vemurafenib, whereas the resistant cell lines maintained their resistance over the entire low vemurafenib concentration range.
FIGURE 3.

Real-time in vitro growth curves of A375 and DM443 and their respective isogenic acquired vemurafenib-resistant counterparts, A375rVem and DM443rVem, showing increased resistance of acquired vemurafenib-resistant melanoma cells to metronomic doses of vemurafenib.
Acquired Vemurafenib Resistance in Vivo
Fig. 4 summarizes the results of the in vivo characterization of the growth and response to vemurafenib of parental A375 and the vemurafenib-resistant counterpart, A573rVem. The in vivo growth rate in nude mice was higher for A375rVem (104 mm3·day−1) than for A375 (68 mm3·day−1) after 12 days of growth, and the size of the A375rVem xenograft was 1.8-fold greater than that of the parental A375. Following treatment with a single dose of vemurafenib, the growth rate and size of the A375 xenograft decreased dramatically. In contrast, for A573rVem, vemurafenib had no effect on the growth rate or size of the xenografts over the 12 days of in vivo growth.
FIGURE 4.
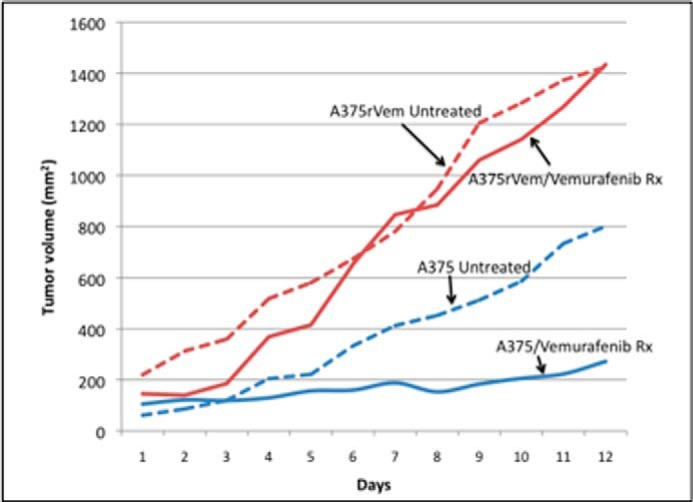
In vivo growth curves of parental A375 and acquired vemurafenib-resistant A573rVem, with and without vemurafenib treatment. Nude mice carrying xenografts of the tumors received 50 mg/kg vemurafenib daily by oral gavage.
Vemurafenib Resistance Is Associated with Activation of All Three MAPKs
Previous studies have reported increased activation of the ERK pathway in vemurafenib-resistant melanoma (11, 12, 23). The role of other MAPKs in the context of vemurafenib resistance, however, is relatively unknown, although it is well established that the different MAPKs overlap functionally and can mediate cellular response to therapy. We therefore investigated changes in the levels and activation states of all three major human MAPKs in the parental and vemurafenib-resistant cell lines. The results, shown in Fig. 5 and Table 4, demonstrate a significant and consistent increase in the levels of the phosphorylated/activated forms of the three MAPKs, ERK, JNK, and p38, in the acquired vemurafenib-resistant cell lines compared with the parental cell lines. Because GSTP1 is a negative regulator of cellular MAPKs, we examined the levels of GSTP1 in the cell lines to determine whether this could contribute to the decreased MAPK activation observed in the resistant cell lines. The results, also in Fig. 5, demonstrated that although GSTP1 was expressed in both parental and resistant cell lines, the levels were lower in the acquired vemurafenib-resistant cell lines and correlated with the higher activated MAPK levels in them, relative to the parental cell lines.
FIGURE 5.

MAPK (A) and RAS (B) signaling proteins in vemurafenib resistance. Extracts from cells of the parental and vemurafenib-resistant melanoma cell lines were subjected to Western blotting using antibodies against the different phosphorylated and unphosphorylated proteins. The Western blots were quantitated densitometrically and normalized against that of the native protein or against that of GAPDH. The results and analysis of the densitometric quantitation of replicate Western blots are summarized in Table 4.
TABLE 4.
Changes in total and activated MAPKs and RAS-associated proteins following acquisition of vemurafenib resistance in A375 and DM443 melanoma cells
Western blot bands were quantified by densitometry and used to compute the phosphoprotein/protein or the protein/GAPDH ratios. Each value is the mean of triplicate determinations ± S.D.
| A375 | A375rVem | Fold change | DM443 | DM443rVem | Fold change | |
|---|---|---|---|---|---|---|
| Phosphoprotein | ||||||
| JNK/phospho-JNK | 0.31 ± 0.026 | 1.46 ± 0.50 | 4.71 | 0.42 ± 0.02 | 1.53 ± 0.05 | 3.64 |
| ERK/phospho-ERK | 0.81 ± 0.075 | 4.13 ± 0.13 | 5.10 | 0.87 ± 0.03 | 4.25 ± 0.15 | 4.88 |
| p38/phospho-p38 | 0.86 ± 0.02 | 1.26 ± 0.06 | 1.46 | 0.14 ± 0.012 | 0.83 ± 0.04 | 5.93 |
| MEK/phospho-MEK | 0.45 ± 0.01 | 1.13 ± 0.15 | 2.5 | 0.25 ± 0.02 | 0.93 ± 0.02 | 3.74 |
| ARAF/phospho-ARAF | 0.065 ± 0.005 | 0.02 ± 0.005 | 0.03 | 0.063 ± 0.005 | 0.06 ± 0.005 | 0.95 |
| CRAF/phospho-CRAF | 1.35 ± 0.022 | 1.24 ± 0.03 | 0.92 | 0.11 ± 0.02 | 0.44 ± 0.03 | 4.0 |
| AKT/phospho-AKT | 0.13 ± 0.02 | 1.96 ± 0.16 | 15.08 | 0.22 ± 0.016 | 1.16 ± 0.03 | 5.27 |
| Total protein | ||||||
| BRAF/GAPDH | 0.92 ± 0.87 | 1.2 ± 0.24 | 1.30 | 0.75 ± 0.05 | 1.32 ± 0.05 | 1.76 |
| NRAS/GAPDH | 0.053 ± 0.01 | 3.21 ± 0.05 | 6.01 | 0.076 ± 0.01 | 1.56 ± 0.13 | 1.56 |
| GSTP1/GAPDH | 1.36 ± 0.035 | 0.74 ± 0.03 | 0.54 | 1.73 ± 0.025 | 1.15 ± 0.03 | 1.15 |
RAS/RAF Pathway in Acquired Vemurafenib-resistant Melanoma Cells
Activating mutations in NRAS have been implicated in vemurafenib resistance in melanoma (11) Consequently, we examined the paired parental and acquired vemurafenib-resistant cell lines for both the level of NRAS and the mutational status of the NRAS gene. The results of the Western blot analysis (Fig. 5B) showed significantly higher levels of NRAS in the resistant cell lines, A375rVem and DM443rVem, compared with the almost undetectable levels in their corresponding parental cell lines, A375 and DM443. Despite the high levels of NRAS protein, whole exome sequencing of the NRAS gene showed no mutations in either the parental or the vemurafenib-resistant cell lines.
We also examined the levels and activation states of the three RAF isoforms, ARAF, BRAF, and CRAF. The results (Fig. 5B) showed ARAF to be expressed at high levels in all of the cell lines, and, despite these high ARAF levels, phosphorylated (i.e. activated) ARAF was not detectable in any the cell lines, parental or resistant. Similar to ARAF, high levels of CRAF were present in all of the cell lines. In contrast, however, compared with their parental counterparts, phosphorylated CRAF was increased only modestly in DM443rVem but not in A375rVem. Consistent with the presence of the mutant V600E BRAF, all of the cell lines expressed high levels of BRAF.
Down-regulation of NRAS Reverses Acquired Vemurafenib Resistance in Melanoma Cells
To further investigate the link between the increased NRAS expression and increased activation of the MAPKs as a mechanism of acquired vemurafenib resistance in the melanoma cell lines, we examined the effects of suppressing NRAS on the phosphorylation/activation of each MAPK (ERK, JNK, and p38) and AKT and on the vemurafenib resistance phenotype in both A375rVem and DM443rVem. The results are summarized in Fig. 6 and confirmed Tables 5 and 6. Fig. 6A shows a complete knockdown of NRAS expression in the cells of both resistant cell lines 48 h after transfection with 10 nm NRAS siRNA. As Fig. 6 shows, in A375rVem and DM443rVem, NRAS suppression had no effect on total levels of all three MAPKs and AKT compared with controls without NRAS suppression. However, in both cell lines, suppression of NRAS was associated with a significant decrease in the level of activation of all three MAPKs, namely 72-, 30-, and 2.24-fold and 6.6-, 14-, and 7.1-fold for A375rVem and DM443rVem, respectively. Similar to the MAPKs, phospho-AKT levels were significantly decreased (33.67-fold for A375rVem and 25.75-fold for DM443rVem) in NRAS-suppressed resistant cell lines compared with NRAS+ve controls. The results of the knockdown of NRAS expression on vemurafenib resistance are summarized in Table 6. The vemurafenib IC50, upon NRAS suppression, decreased from 10.3 to 1.33 μm for A375rVem and from 6.12 to 1.16 μm for DM443rVem. In contrast, the IC50 values were essentially unchanged for the parental cell lines, namely from 0.83 to 0.74 μm for A375 and from 0.88 to 0.70 μm for DM443, respectively, for the control and NRAS siRNA-transfected cell lines. These results are consistent with the high levels of NRAS in the vemurafenib-resistant and very low levels in the parental cell lines.
FIGURE 6.

Effect of siRNA-mediated NRAS gene suppression on phosphorylation state of MAPKs and AKT in vemurafenib-resistant A375rVem and DM443rVem cells. Cells were transfected with 10 nm stealth NRAS-targeted or scrambled (control) siRNA for 48 h and analyzed for total and phosphorylated proteins by Western blotting, as described under “Experimental Procedures.”
TABLE 5.
Effect of siRNA-mediated knockdown of NRAS on phosphorylation state of ERK, JNK, p38, and AKT in vemurafenib-resistant cell lines, A375rVem and DM443rVem
Cells were transfected with 10 nm NRAS-targeted siRNA for 48 h and then examined for each protein and phosphoprotein or for sensitivity to vemurafenib. Cell survival was monitored by real-time cell sensing, as described under “Experimental Procedures.” Controls were transfected with scrambled siRNA, and the results were normalized against those of untreated cells.
| MAPK/AKT phosphorylation |
||||||
|---|---|---|---|---|---|---|
| A375rVem |
DM443rVem |
|||||
| NRAS siRNA |
Fold change in phosphorylation | NRAS siRNA |
-Fold change in phosphorylation | |||
| − | + | − | + | |||
| pERK/ERK | 0.72 | 0.01 | 72.00 | 0.93 | 0.14 | 6.64 |
| pJNK/JNK | 0.24 | 0.008 | 30.00 | 1.26 | 0.09 | 14.0 |
| pP38/P38 | 1.23 | 0.55 | 2.24 | 0.64 | 0.09 | 7.10 |
| pAKT/AKT | 1.01 | 0.03 | 33.67 | 1.03 | 0.04 | 25.75 |
TABLE 6.
Effect of siRNA-mediated knockdown of NRAS on vemurafenib sensitivity in A375rVem and DM443rVem and their parental counterparts
Cells were transfected with 10 nm NRAS-targeted siRNA for 48 h and then examined for each protein and phosphoprotein or for sensitivity to vemurafenib. Cell survival was monitored by real-time cell sensing, as described under “Experimental Procedures.” Controls were transfected with scrambled siRNA, and the results were normalized against those of untreated cells.
| Vemurafenib sensitivity (IC50) |
|||
|---|---|---|---|
| NRAS siRNA |
Fold change in resistance | ||
| − | + | ||
| μm | |||
| A375 | 0.83 ± 0.06 | 0.74 ± 0.09 | 1.02 |
| A375rVem | 10.3 ± 2.03 | 1.33 ± 0.14 | 7.74 |
| DM443 | 0.88 ± 0.07 | 0.70 ± 0.09 | 0.98 |
| DM443rVem | 6.12 ± 0.76 | 1.16 ± 0.13 | 5.28 |
MAPK Inhibition Enhances Sensitivity of Resistant Cells to Vemurafenib
In Fig. 5 and Table 4, we showed earlier that the acquisition of vemurafenib resistance in both A375rVem and DM443rVem cell lines was associated with significantly increased activation/phosphorylation of the MAPKs. To further examine the mechanistic role of the MAPKs in the acquired vemurafenib resistance, we treated A375rVem and DM443rVem cells with specific inhibitors of each of the three MAPKs, ERK, JNK, and p38, and examined the effect on their vemurafenib sensitivity. Table 7 shows the effects of the MAPK inhibitors on the activity of the respective MAPK in the cell lines. Relative to controls, each MAPK was inhibited to levels that ranged between 75% and over 90%. Table 8 summarizes the effects of the MAPK inhibitors on the vemurafenib sensitivities of the cell lines and shows that, for each of the MAPKs, the inhibition was associated with a significant decrease in the vemurafenib IC50 in the resistant but not in the parental cell lines. Thus, for A375rVem, based on the IC50 values, vemurafenib sensitivity increased by 3.76-, 3.92-, and 2.27-fold, respectively, upon treatment with the ERK inhibitor AEMT, the JNK inhibitor TCS JNK 60, and the p38 inhibitor skepinone-L. The vemurafenib sensitivities of the parental A375 were only modestly increased upon treatment with the three inhibitors by 1.29-fold for AEMT, 1.25-fold for TCS JNK 60, and 1.08-fold for skepinone-L. The results with DM443 and DM443rVEM were similar to those of A375/A375rVem. Vemurafenib sensitivity increased by 3.67-, 3.62-, and 3.77-fold, respectively, for AEMT, TCS JNK 60, and skepinone-L for DM443rVem and only by 1.26-, 1.23-, and 1.37-fold for the parental DM443.
TABLE 7.
Effect of MAPK inhibitors on MAPK activity in parental and acquired vemurafenib-resistant melanoma cell lines
Extracts of cells treated with non-toxic (<IC10) concentration of each MAPK inhibitor or vehicle (control) for 1 h were examined for level of MAPK activation.
| Inhibitor | MAPK activity relative to control |
|||
|---|---|---|---|---|
| A375 | A375rVem | DM443 | DM443rVem | |
| AEMTa | 0.17 ± 0.03 | 0.19 ± 0.05 | 0.15 ± 0.03 | 0.07 ± 0.01 |
| TCS JNK60b | 0.16 ± 0.01 | 0.11 ± 0.01 | 0.17 ± 0.04 | 0.1 ± 0.02 |
| Skepinone-Lc | 0.25 ± 0.01 | 0.30 ± 0.03 | 0.14 ± 0.02 | 0.08 ± 0.01 |
a ERK inhibitor (15 μm).
b JNK inhibitor (5.0 μm).
c p38 inhibitor (1.0 μm).
TABLE 8.
Effect of MAPK inhibitors on vemurafenib sensitivity of parental A375 and DM443 and their vemurafenib-resistant counterparts, A375rVem and DM443rVem
Cell survival was monitored by real-time cell sensing, as described under “Experimental Procedures.” Controls were treated with vehicle, and the results were normalized against those of untreated cells.
| Inhibitor | Vemurafenib sensitivity (IC50) |
|||
|---|---|---|---|---|
| A375 | A375rVem | DM443 | DM443rVem | |
| μm | ||||
| Control | 0.71 ± 0.03 | 10.89 ± 1.07 | 0.83 ± 0.07 | 7.37 ± 0.96 |
| AEMT | 0.55 ± 0.08 | 2.90 ± 0.03 | 0.66 ± 0.09 | 2.00 ± 0.06 |
| -Fold change in sensitivity | 1.29 | 3.76 | 1.26 | 3.67 |
| Control | 0.76 ± 0.04 | 11.56 ± 1.26 | 0.91 ± 0.06 | 6.33 ± 0.26 |
| TCS JNK60 | 0.61 ± 0.05 | 2.95 ± 0.07 | 0.74 ± 0.05 | 1.74 ± 0.12 |
| -Fold change in sensitivity | 1.25 | 3.92 | 1.23 | 3.62 |
| Control | 0.78 ± 0.06 | 10.84 ± 1.16 | 0.88 ± 0.08 | 6.83 ± 0.65 |
| Skepinone-L | 0.72 ± 0.04 | 4.78 ± 0.07 | 0.64 ± 0.05 | 1.81 ± 0.17 |
| -Fold change in sensitivity | 1.08 | 2.27 | 1.37 | 3.77 |
Loss of Genetic Heterogeneity in V600E BRAF Is Associated with Acquired Vemurafenib Resistance in Human Melanoma Cell Lines
As stated earlier, whole exome sequencing showed V600E to be the only mutation in the BRAF gene in all of the cell lines. A closer examination of the sequencing results, however, showed that the parental DM443 cell line harbored both wild-type and V600E mutant BRAF, in contrast to the parental A375 and the two acquired vemurafenib-resistant cell lines, A375rVem and DM443rVem, which were homogeneous for V600E BRAF. Thus, the BRAF heterogeneity of DM443 was lost in the transition to the resistant cell line, DM443rVem. To further examine this, we subcloned each of the cell lines and sequenced 20 clones of each. The results (Fig. 7) confirmed that the paired parental and vemurafenib-resistant A375 harbored only the V600E BRAF gene but that the parental DM443 cell line was biclonal and contained two subpopulations of cells, one with wild-type BRAF and the other with the V600E BRAF (Fig. 7, top). This V600E BRAF biclonality of DM443 was lost upon acquisition of BRAF resistance (Fig. 7, bottom).
FIGURE 7.
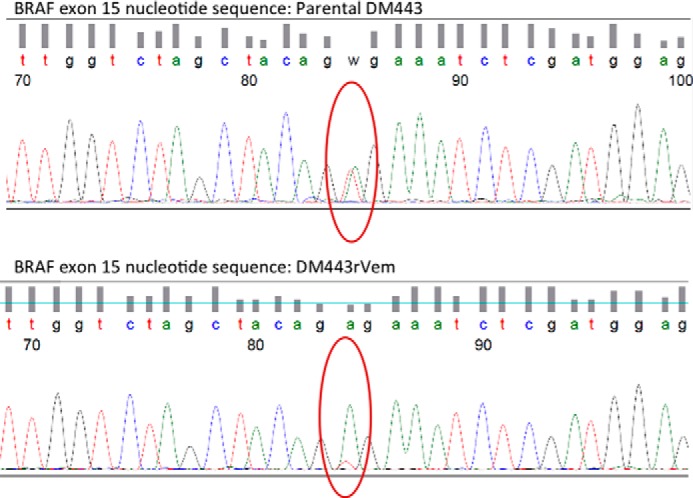
Sequence of BRAF exon 15 gene segment from parental DM443 showing a heterogeneous population of cells with wild-type BRAF and V600E BRAF genes (top), and two DM443 subclones isolated from parental DM443, showing only V600E BRAF (bottom).
DISCUSSION
Acquired resistance to the second generation BRAF inhibitor, vemurafenib (PLX4032), is a major factor limiting successful, long term targeted therapy for patients with malignant melanomas that harbor the V600E BRAF mutation (10). Consequently, much effort is being directed at unraveling the cellular and molecular mechanisms involved in resistance to BRAF-targeted therapy in these tumors (11–15). The present study is a contribution to these efforts, and the results provide important novel insight into the complexity of the vemurafenib resistance phenotype in melanoma and advance the basis upon which such resistance may be overcome clinically. To mimic the clinical situation in which resistance to vemurafenib frequently occurs after the initial response to vemurafenib therapy, we induced vemurafenib resistance in two vemurafenib-sensitive human melanoma cell lines, A375 and DM443, both harboring the V600E BRAF mutation, by continuous exposure of the cells to vemurafenib in vitro. Using the resulting vemurafenib-resistant cell lines and their parental counterparts, we investigated mechanisms, in particular those related to MAPK and RAS/RAF signaling, associated with the acquisition of vemurafenib resistance.
A main and novel finding in this study is that all three major human MAPKs, ERK, p38, and JNK, were significantly activated with the acquisition of vemurafenib resistance in the cell lines. These findings are noteworthy in the context of the current body of literature pertaining to the MAPK pathway in the setting of vemurafenib resistance in melanoma, which have focused, primarily, on ERK and its upstream kinase, MEK (11, 12, 23). Our findings are the first to demonstrate that significant simultaneous activation of all three MAPK families occurs upon acquisition of vemurafenib resistance in melanoma cells. For p38, these observations are consistent with previous reports of activation of both ERK and p38 in melanomas, especially those with BRAF or RAS mutations; this positive feedback loop between p38 and ERK induces a prosurvival state that could contribute to vemurafenib resistance (24, 25). This is particularly interesting and contrasts with carcinomas in which the enhanced activation of ERK and p38 has been reported to be mutually exclusive (24, 25). Similarly, the activation of JNK in the acquired vemurafenib-resistant melanoma cells observed in this study is consistent with a previous report that activated ERK increases activation of the transcription factor c-Jun, the downstream target of JNK, and links ERK and JNK signaling in a prosurvival context (26).
Associated with the increased MAPK activation, we observed a significant decrease in the level of the protein, glutathione S-transferase P1, or GSTP1, a major negative regulator of cellular MAPK signaling, which, at high levels of expression is frequently associated with treatment failure and poor patient survival in a variety of human cancers (27–31). The role of GSTP1 in the regulation of MAPK-mediated drug resistance is complex because of the dual nature of MAPKs in cell survival and apoptosis (13). In the appropriate cellular context, modest decreases in GSTP1 can enhance cell survival by increasing MAPK activation, as is the case in the acquired vemurafenib resistance in melanoma cells in this study. Significant or complete suppression of GSTP1, on the other hand, can lead to high proapoptotic levels of MAPK activation, as we have shown elwewhere.3 Using targeted specific MAPK inhibitors, we showed, in this study, that, in both A375/A375rVem and DM443/DM443rVem cell line pairs, MAPK inhibition results in significant reversal of vemurafenib resistance in the vemurafenib-resistant melanoma cells but not in the parental vemurafenib-sensitive cells. This is consistent with the increased MAPK activation that we observed in the former compared with the latter. The findings are also consistent with a recent report that genetic knockdown of ERK1 and ERK2 increased vemurafenib sensitivity of A375 cells (32). The findings in this study and those in the literature allow us to postulate that the acquisition of vemurafenib resistance in melanoma cells results, at least partially, from the activation of all of the three MAPKs, ERK, JNK, and p38.
Another important novel finding in this study is that intracellular levels of NRAS increased significantly with the acquisition of vemurafenib resistance and that this occurred without mutation(s) in the NRAS gene. This contrasts with previous observations that increased NRAS levels in vemurafenib-resistant melanoma cells result from activating NRAS mutations (11). Interestingly, consistent with our findings, a study of primary specimens of 18 oral melanomas showed high NRAS protein levels, although the majority of the tumors harbored no NRAS gene mutations (33).
Our findings of increased NRAS and increased MAPK signaling in the acquired vemurafenib-resistant melanoma cells are consistent with previous reports that elevated NRAS, with or without activating NRAS mutations, activates downstream targets of the MAPK pathway (11, 34). To confirm the functionality of elevated NRAS in driving the resistance phenotype, we showed that suppression of NRAS decreased vemurafenib resistance significantly in vemurafenib-resistant A375rVem and DM443rVem cells, whereas the vemurafenib sensitivity of the parental cell lines, with barely detectable NRAS expression, remained, essentially, unchanged. In both A375rVem and DM443rVem, we also showed that NRAS suppression resulted in significant decreases in the level of activation of all three MAPKs. These findings support a mechanistic link between elevated NRAS and increased MAPK signaling in the acquired vemurafenib resistance phenotype in melanoma cells.
We also showed that, in addition to the increased MAPK activation and NRAS expression, the acquisition of vemurafenib resistance was associated with an increase in activated AKT, which shifts the PI3K pathway toward a prosurvival state and, thus, could be a contributing factor to the acquired vemurafenib resistance phenotype in A375rVem and DM443rVem. This is consistent with recent findings that the PI3K-AKT pathway is a critical regulator of MEK-targeted therapy in V600E BRAF+ve melanoma cells (35, 43).
To better understand the basis for the observed up-regulated NRAS in the absence of any mutations, we examined the levels and activation states of other RAF family members, specifically ARAF and CRAF, in the vemurafenib-resistant cells. In the context of vemurafenib resistance, ARAF and CRAF can also activate downstream targets of the BRAF-MEK-ERK signaling axis (12). Our results showed that ARAF was expressed but not phosphorylated in both the sensitive and resistant cell lines, indicating that ARAF activation may not be involved in the acquisition of vemurafenib resistance in these melanoma cell lines. The results for CRAF, however, were inconclusive and showed that, although unphosphorylated Ser-259 CRAF was present at high levels in both A375- and DM443-sensitive and -resistant cell lines, the ratio of phosphorylated to unphosphorylated CRAF was higher for the parental A375 than for its resistant counterpart, A375rVem. This finding was reversed for the DM443 cell line. At least for DM443, this is consistent with previous reports indicating that Raf-1 activity is inhibited by phosphorylation of CRAF Ser-259, and that this causes a decrease in ERK activation and cellular mitotic activity (36). Although these results are not conclusive with respect to the role of the RAS-related proteins in the acquired vemurafenib resistance observed in this study, they demonstrate the complexity of the vemurafenib resistance phenotype and suggest that, at least for some tumors, the acquisition of vemurafenib resistance may be related to a decrease in the level of inhibitory (Ser-259-phosphorylated) CRAF. It remains to be established, however, whether direct activation of CRAF may be more relevant than the inhibitory CRAF regulation as a mechanism of vemurafenib resistance in such tumors.
The absence of a secondary or gatekeeper mutation in the BRAF gene, other than the V600E in exon 15, in the setting of resistance to BRAF-targeted agents, such as vemurafenib, observed in this study, is similar to that in previous reports (11–13, 23). An interesting observation in this study was that the DM443 parental cell line consisted of two heterogeneous subpopulations of V600E+ve and wild-type BRAF cells. Our data showed that, upon acquisition of vemurafenib resistance, this transitioned to a single population of V600E BRAF+ve cells, similar to the parental and vemurafenib-resistant A375. Following NRAS suppression, both A375rVem- and DM443rVem-resistant cell lines showed similar decreased levels of MAPK activation and similar increased sensitivities to vemurafenib. These findings are significant and suggest that, regardless of whether a tumor initially has a mixed wild-type and V600E BRAF or a homogeneous mutant BRAF population, upon failure of vemurafenib therapy, a similar strategy, targeting NRAS and/or MAPK, might be effective. Future studies in our laboratory, using differential cell fractionation and reverse genetic approaches, should help to establish the basis for the loss of BRAF genetic heterogeneity in DM443 and whether different therapeutic strategies are required to target the different subpopulations of tumor cells.
Clinically, approximately 15% of patients with V600E BRAF+ve melanoma fail to respond to initial vemurafenib therapy (10, 35). Our findings in this study suggest that the mechanisms that drive vemurafenib resistance acquired after initial response to vemurafenib therapy may be unique and are associated with increased activation of all three MAPKs, ERK, JNK, and p38, and increased expression of NRAS and possibly CRAF as well as with high levels of the prosurvival phospho-AKT. These data suggest that different strategies may be required for the effective treatment of melanoma patients and may depend on the history of previous vemurafenib exposure. This concept is reinforced by a phase II study that showed previous vemurafenib exposure to portend a poor therapeutic response to MEK inhibitors (36, 37). In that study, MEK inhibitors given in sequence with vemurafenib improved progression-free overall survival and response rates in vemurafenib-naive patients but not in patients who had failed prior vemurafenib therapy.
The increased growth of vemurafenib-resistant melanoma cells in the presence of vemurafenib that we observed in this study, although intriguing, has also been reported in other studies (11, 13). In the clinical setting, this argues against the continuation of vemurafenib treatment in, and questions the utility of dose-escalating regimens that have been proposed for, melanoma patients whose disease has progressed in the face of vemurafenib therapy (11–13).
Current efforts to develop strategies for overcoming or delaying acquired resistance to vemurafenib that have focused, primarily, on using a second targeted agent, such as a MEK or AKT inhibitor, have, to date, not been very successful in patients with advanced melanoma (11–13, 15, 38–42). This raises the question of whether other approaches, such as combination of BRAF-targeted agents with chemotherapy, might be more efficacious. Our findings of collateral resistance of acquired vemurafenib-resistant melanoma cells to cisplatin, melphalan, and temozolomide, however, suggest that in acquired vemurafenib resistance, a combination BRAF-targeted therapy with chemotherapy is, similar to observations with the MEK inhibitor combinations (39), not likely to be clinically efficacious. In this context, it was interesting that, although, in both cell lines, collateral resistance to cisplatin, melphalan, and temozolomide increased upon acquisition of vemurafenib resistance, A375 was, overall, much more sensitive than DM443 to the three agents. The basis for the differences in sensitivity/resistance to chemotherapy is unclear; however, it is likely to be due, in part, to the fact that with the development of vemurafenib resistance, the growth rate and proportion of S-phase cells increased in A375 and decreased in DM443, given that rapidly growing cells are, generally, more sensitive to alkylating/DNA-damaging agents. It is also possible that differences exist between the cell lines in other mechanisms, such as DNA repair, that do not affect vemurafenib resistance but are determinants of sensitivity to these agents. Further studies, in vitro and in vivo, will be necessary to better characterize the phenomenon of cross-resistance to these chemotherapeutic agents in the setting of vemurafenib resistance and to determine whether the combination of BRAF-targeted therapy and chemotherapy can be optimized to be clinically efficacious.
In summary, the findings in this study provide insights into the complexity of the targeted BRAF drug-resistant phenotype in melanoma and provide some basis for rationally developing strategies to overcome it clinically.
This work was supported, in whole or in part, by National Institutes of Health Grants 5R01CA153050 and 1R01CA127872. This work was also supported by a Veterans Affairs merit review grant.
R. Turley, G. Antoun, P. Speicher, T. Okamura, B. Adams, M. Lidsky, C. Augustine, D. Tyler, and F. Ali-Osman, manuscript in preparation.
- AEMT
- 3-[2-aminoethyl)-5-(4-ethoxyphenyl) methylene]-2,4-thiazolidinedione·HCl
- skepinone-L
- phenylaminodibenzosuberone-diol
- TCS JNK 60
- N-(4-amino-5-cyano-6-ethoxy-2-pyridinyl)-2,5-dimethoxybenzeneacetamide.
REFERENCES
- 1. Jemal A., Bray F., Center M. M., Ferlay J., Ward E., Forman D. (2011) Global cancer statistics. CA Cancer J. Clin. 61, 69–90 [DOI] [PubMed] [Google Scholar]
- 2. Anderson C. M., Buzaid A. C., Legha S. S. (1995) Systemic treatments for advanced cutaneous melanoma. Oncology (Williston Park) 9, 1149–1158; discussion 1163–1144, 1167–1148 [PubMed] [Google Scholar]
- 3. Atkins M. B., Lotze M. T., Dutcher J. P., Fisher R. I., Weiss G., Margolin K., Abrams J., Sznol M., Parkinson D., Hawkins M., Paradise C., Kunkel L., Rosenberg S. A. (1999) High-dose recombinant interleukin 2 therapy for patients with metastatic melanoma: analysis of 270 patients treated between 1985 and 1993. J. Clin. Oncol. 17, 2105–2116 [DOI] [PubMed] [Google Scholar]
- 4. Chapman P. B., Einhorn L. H., Meyers M. L., Saxman S., Destro A. N., Panageas K. S., Begg C. B., Agarwala S. S., Schuchter L. M., Ernstoff M. S., Houghton A. N., Kirkwood J. M. (1999) Phase III multicenter randomized trial of the Dartmouth regimen versus dacarbazine in patients with metastatic melanoma. J. Clin. Oncol. 17, 2745–2751 [DOI] [PubMed] [Google Scholar]
- 5. Davies H., Bignell G. R., Cox C., Stephens P., Edkins S., Clegg S., Teague J., Woffendin H., Garnett M. J., Bottomley W., Davis N., Dicks E., Ewing R., Floyd Y., Gray K., Hall S., Hawes R., Hughes J., Kosmidou V., Menzies A., Mould C., Parker A., Stevens C., Watt S., Hooper S., Wilson R., Jayatilake H., Gusterson B. A., Cooper C., Shipley J., Hargrave D., Pritchard-Jones K., Maitland N., Chenevix-Trench G., Riggins G. J., Bigner D. D., Palmieri G., Cossu A., Flanagan A., Nicholson A., Ho J. W., Leung S. Y., Yuen S. T., Weber B. L., Seigler H. F., Darrow T. L., Paterson H., Marais R., Marshall C. J., Wooster R., Stratton M. R., Futreal P. A. (2002) Mutations of the BRAF gene in human cancer. Nature 417, 949–954 [DOI] [PubMed] [Google Scholar]
- 6. Gray-Schopfer V. C., da Rocha Dias S., Marais R. (2005) The role of B-RAF in melanoma. Cancer Metastasis Rev. 24, 165–183 [DOI] [PubMed] [Google Scholar]
- 7. Satyamoorthy K., Li G., Gerrero M. R., Brose M. S., Volpe P., Weber B. L., Van Belle P., Elder D. E., Herlyn M. (2003) Constitutive mitogen-activated protein kinase activation in melanoma is mediated by both BRAF mutations and autocrine growth factor stimulation. Cancer Res. 63, 756–759 [PubMed] [Google Scholar]
- 8. Bhatia S., Tykodi S. S., Thompson J. A. (2009) Treatment of metastatic melanoma: an overview. Oncology (Williston Park) 23, 488–496 [PMC free article] [PubMed] [Google Scholar]
- 9. Johnson D. B., Sosman J. A. (2013) Update on the targeted therapy of melanoma. Curr. Treat. Options Oncol. 14, 280–292 [DOI] [PMC free article] [PubMed] [Google Scholar]
- 10. Chapman P. B., Hauschild A., Robert C., Haanen J. B., Ascierto P., Larkin J., Dummer R., Garbe C., Testori A., Maio M., Hogg D., Lorigan P., Lebbe C., Jouary T., Schadendorf D., Ribas A., O'Day S. J., Sosman J. A., Kirkwood J. M., Eggermont A. M., Dreno B., Nolop K., Li J., Nelson B., Hou J., Lee R. J., Flaherty K. T., McArthur G. A. (2011) Improved survival with vemurafenib in melanoma with BRAF V600E mutation. N. Engl. J. Med. 364, 2507–2516 [DOI] [PMC free article] [PubMed] [Google Scholar]
- 11. Nazarian R., Shi H., Wang Q., Kong X., Koya R. C., Lee H., Chen Z., Lee M. K., Attar N., Sazegar H., Chodon T., Nelson S. F., McArthur G., Sosman J. A., Ribas A., Lo R. S. (2010) Melanomas acquire resistance to B-RAF(V600E) inhibition by RTK or N-RAS upregulation. Nature 468, 973–977 [DOI] [PMC free article] [PubMed] [Google Scholar]
- 12. Villanueva J., Vultur A., Lee J. T., Somasundaram R., Fukunaga-Kalabis M., Cipolla A. K., Wubbenhorst B., Xu X., Gimotty P. A., Kee D., Santiago-Walker A. E., Letrero R., D'Andrea K., Pushparajan A., Hayden J. E., Brown K. D., Laquerre S., McArthur G. A., Sosman J. A., Nathanson K. L., Herlyn M. (2010) Acquired resistance to BRAF inhibitors mediated by a RAF kinase switch in melanoma can be overcome by cotargeting MEK and IGF-1R/PI3K. Cancer Cell 18, 683–695 [DOI] [PMC free article] [PubMed] [Google Scholar]
- 13. Das Thakur M., Salangsang F., Landman A. S., Sellers W. R., Pryer N. K., Levesque M. P., Dummer R., McMahon M., Stuart D. D. (2013) Modelling vemurafenib resistance in melanoma reveals a strategy to forestall drug resistance. Nature 494, 251–255 [DOI] [PMC free article] [PubMed] [Google Scholar]
- 14. Johannessen C. M., Boehm J. S., Kim S. Y., Thomas S. R., Wardwell L., Johnson L. A., Emery C. M., Stransky N., Cogdill A. P., Barretina J., Caponigro G., Hieronymus H., Murray R. R., Salehi-Ashtiani K., Hill D. E., Vidal M., Zhao J. J., Yang X., Alkan O., Kim S., Harris J. L., Wilson C. J., Myer V. E., Finan P. M., Root D. E., Roberts T. M., Golub T., Flaherty K. T., Dummer R., Weber B. L., Sellers W. R., Schlegel R., Wargo J. A., Hahn W. C., Garraway L. A. (2010) COT drives resistance to RAF inhibition through MAP kinase pathway reactivation. Nature 468, 968–972 [DOI] [PMC free article] [PubMed] [Google Scholar]
- 15. Su F., Bradley W. D., Wang Q., Yang H., Xu L., Higgins B., Kolinsky K., Packman K., Kim M. J., Trunzer K., Lee R. J., Schostack K., Carter J., Albert T., Germer S., Rosinski J., Martin M., Simcox M. E., Lestini B., Heimbrook D., Bollag G. (2012) Resistance to selective BRAF inhibition can be mediated by modest upstream pathway activation. Cancer Res. 72, 969–978 [DOI] [PubMed] [Google Scholar]
- 16. Lito P., Pratilas C. A., Joseph E. W., Tadi M., Halilovic E., Zubrowski M., Huang A., Wong W. L., Callahan M. K., Merghoub T., Wolchok J. D., de Stanchina E., Chandarlapaty S., Poulikakos P. I., Fagin J. A., Rosen N. (2012) Relief of profound feedback inhibition of mitogenic signaling by RAF inhibitors attenuates their activity in BRAFV600E melanomas. Cancer Cell 22, 668–682 [DOI] [PMC free article] [PubMed] [Google Scholar]
- 17. Montagut C., Sharma S. V., Shioda T., McDermott U., Ulman M., Ulkus L. E., Dias-Santagata D., Stubbs H., Lee D. Y., Singh A., Drew L., Haber D. A., Settleman J. (2008) Elevated CRAF as a potential mechanism of acquired resistance to BRAF inhibition in melanoma. Cancer Res. 68, 4853–4861 [DOI] [PMC free article] [PubMed] [Google Scholar]
- 18. Wagle N., Emery C., Berger M. F., Davis M. J., Sawyer A., Pochanard P., Kehoe S. M., Johannessen C. M., Macconaill L. E., Hahn W. C., Meyerson M., Garraway L. A. (2011) Dissecting therapeutic resistance to RAF inhibition in melanoma by tumor genomic profiling. J. Clin. Oncol. 29, 3085–3096 [DOI] [PMC free article] [PubMed] [Google Scholar]
- 19. Ali-Osman F. (1996) Methods in molecular medicine (Jones E. D., ed) in Human Cell Culture Protocols, pp. 63–80, Humana Press, Inc., Totowa, NJ: [DOI] [PubMed] [Google Scholar]
- 20. Lo H. W., Ali-Osman F. (2002) Cyclic AMP mediated GSTP1 gene activation in tumor cells involves the interaction of activated CREB-1 with the GSTP1 CRE: a novel mechanism of cellular GSTP1 gene regulation. J. Cell. Biochem. 87, 103–116 [DOI] [PubMed] [Google Scholar]
- 21. Bradford M. M. (1976) A rapid and sensitive method for the quantitation of microgram quantities of protein utilizing the principle of protein-dye binding. Anal. Biochem. 72, 248–254 [DOI] [PubMed] [Google Scholar]
- 22. Bhatt R. S., Merchan J., Parker R., Wu H. K., Zhang L., Seery V., Heymach J. V., Atkins M. B., McDermott D., Sukhatme V. P. (2010) A phase 2 pilot trial of low-dose, continuous infusion, or “metronomic” paclitaxel and oral celecoxib in patients with metastatic melanoma. Cancer 116, 1751–1756 [DOI] [PMC free article] [PubMed] [Google Scholar]
- 23. Yadav V., Zhang X., Liu J., Estrem S., Li S., Gong X. Q., Buchanan S., Henry J. R., Starling J. J., Peng S. B. (2012) Reactivation of mitogen-activated protein kinase (MAPK) pathway by FGF receptor 3 (FGFR3)/Ras mediates resistance to vemurafenib in human B-RAF V600E mutant melanoma. J. Biol. Chem. 287, 28087–28098 [DOI] [PMC free article] [PubMed] [Google Scholar]
- 24. Aguirre-Ghiso J. A., Estrada Y., Liu D., Ossowski L. (2003) ERK(MAPK) activity as a determinant of tumor growth and dormancy: regulation by p38(SAPK). Cancer Res. 63, 1684–1695 [PubMed] [Google Scholar]
- 25. Estrada Y., Dong J., Ossowski L. (2009) Positive crosstalk between ERK and p38 in melanoma stimulates migration and in vivo proliferation. Pigment Cell Melanoma Res. 22, 66–76 [DOI] [PubMed] [Google Scholar]
- 26. Lopez-Bergami P., Kim H., Dewing A., Goydos J., Aaronson S., Ronai Z. (2010) c-Jun regulates phosphoinositide-dependent kinase 1 transcription: implication for Akt and protein kinase C activities and melanoma tumorigenesis. J. Biol. Chem. 285, 903–913 [DOI] [PMC free article] [PubMed] [Google Scholar]
- 27. Lo H. W., Ali-Osman F. (2007) Genetic polymorphism and function of glutathione S-transferases in tumor drug resistance. Curr. Opin. Pharmacol. 7, 367–374 [DOI] [PubMed] [Google Scholar]
- 28. Okamura T., Singh S., Buolamwini J., Haystead T., Friedman H., Bigner D., Ali-Osman F. (2009) Tyrosine phosphorylation of the human glutathione S-transferase P1 by epidermal growth factor receptor. J. Biol. Chem. 284, 16979–16989 [DOI] [PMC free article] [PubMed] [Google Scholar]
- 29. Tew K. D. (1994) Glutathione-associated enzymes in anticancer drug resistance. Cancer Res. 54, 4313–4320 [PubMed] [Google Scholar]
- 30. Townsend D. M., Tew K. D. (2003) The role of glutathione-S-transferase in anti-cancer drug resistance. Oncogene 22, 7369–7375 [DOI] [PMC free article] [PubMed] [Google Scholar]
- 31. Wang T., Arifoglu P., Ronai Z., Tew K. D. (2001) Glutathione S-transferase P1–1 (GSTP1–1) inhibits c-Jun N-terminal kinase (JNK1) signaling through interaction with the C terminus. J. Biol. Chem. 276, 20999–21003 [DOI] [PubMed] [Google Scholar]
- 32. Qin J., Xin H., Nickoloff B. J. (2012) Specifically targeting ERK1 or ERK2 kills melanoma cells. J. Transl. Med. 10, 15–22 [DOI] [PMC free article] [PubMed] [Google Scholar]
- 33. Buery R. R., Siar C. H., Katase N., Gunduz M., Lefeuvre M., Fujii M., Inoue M., Setsu K., Nagatsuka H. (2011) NRAS and BRAF mutation frequency in primary oral mucosal melanoma. Oncol. Rep. 26, 783–787 [DOI] [PubMed] [Google Scholar]
- 34. Heidorn S. J., Milagre C., Whittaker S., Nourry A., Niculescu-Duvas I., Dhomen N., Hussain J., Reis-Filho J. S., Springer C. J., Pritchard C., Marais R. (2010) Kinase-dead BRAF and oncogenic RAS cooperate to drive tumor progression through CRAF. Cell 140, 209–221 [DOI] [PMC free article] [PubMed] [Google Scholar]
- 35. Jaiswal B. S., Janakiraman V., Kljavin N. M., Eastham-Anderson J., Cupp J. E., Liang Y., Davis D. P., Hoeflich K. P., Seshagiri S. (2009) Combined targeting of BRAF and CRAF or BRAF and PI3K effector pathways is required for efficacy in NRAS mutant tumors. PLoS One 4, e5717. [DOI] [PMC free article] [PubMed] [Google Scholar]
- 36. Kubicek M., Pacher M., Abraham D., Podar K., Eulitz M., Baccarini M. (2002) Dephosphorylation of Ser-259 regulates Raf-1 membrane association. J. Biol. Chem. 277, 7913–7919 [DOI] [PubMed] [Google Scholar]
- 37. Dhillon A. S., Pollock C., Steen H, Shaw P. E., Mischak H., Kolch W. (2002) Cyclic AMP-dependent kinase regulates Raf-1 kinase mainly by phosphorylation of serine 259. Mol. Cell Biol. 22, 3237–3246 [DOI] [PMC free article] [PubMed] [Google Scholar]
- 38. Flaherty K. T., Puzanov I., Kim K. B., Ribas A., McArthur G. A., Sosman J. A., O'Dwyer P. J., Lee R. J., Grippo J. F., Nolop K., Chapman P. B. (2010) Inhibition of mutated, activated BRAF in metastatic melanoma. N. Engl. J. Med. 363, 809–819 [DOI] [PMC free article] [PubMed] [Google Scholar]
- 39. Kim K. B., Kefford R., Pavlick A. C., Infante J. R., Ribas A., Sosman J. A., Fecher L. A., Millward M., McArthur G. A., Hwu P., Gonzalez R., Ott P. A., Long G. V., Gardner O. S., Ouellet D., Xu Y., DeMarini D. J., Le N. T., Patel K., Lewis K. D. (2013) Phase II study of the MEK1/MEK2 inhibitor Trametinib in patients with metastatic BRAF-mutant cutaneous melanoma previously treated with or without a BRAF inhibitor. J. Clin. Oncol. 31, 482–489 [DOI] [PMC free article] [PubMed] [Google Scholar]
- 40. Flaherty K. T., Infante J. R., Daud A., Gonzalez R., Kefford R. F., Sosman J., Hamid O., Schuchter L., Cebon J., Ibrahim N., Kudchadkar R., Burris H. A., 3rd, Falchook G., Algazi A., Lewis K., Long G. V., Puzanov I., Lebowitz P., Singh A., Little S., Sun P., Allred A., Ouellet D., Kim K. B., Patel K., Weber J. (2012) Combined BRAF and MEK inhibition in melanoma with BRAF V600 mutations. N. Engl. J. Med. 367, 1694–1703 [DOI] [PMC free article] [PubMed] [Google Scholar]
- 41. Luo J., Manning B. D., Cantley L. C. (2003) Targeting the PI3K-Akt pathway in human cancer: rationale and promise. Cancer Cell 4, 257–262 [DOI] [PubMed] [Google Scholar]
- 42. Flaherty K. T., Robert C., Hersey P., Nathan P., Garbe C., Milhem M., Demidov L. V., Hassel J. C., Rutkowski P., Mohr P., Dummer R., Trefzer U., Larkin J. M., Utikal J., Dreno B., Nyakas M., Middleton M. R., Becker J. C., Casey M., Sherman L. J., Wu F. S., Ouellet D., Martin A. M., Patel K., Schadendorf D., and METRIC Study Group (2012) Improved survival with MEK inhibition in BRAF-mutated melanoma. N. Engl. J. Med. 367, 107–114 [DOI] [PubMed] [Google Scholar]
- 43. Gopal Y. N., Deng W., Woodman S. E., Komurov K., Ram P., Smith P. D., Davies M. A. (2010). Basal and treatment-induced activation of AKT mediates resistance to cell death by AZD6244 (ARRY-142886) in Braf-mutant human cutaneous melanoma cells. Cancer Res. 70, 8736–8747 [DOI] [PMC free article] [PubMed] [Google Scholar]