Background: The role of HDAC3 in anti-cancer drug resistance remains unknown.
Results: HDAC3 forms a negative feedback loop with miR-326 and regulates the response to anti-cancer drugs.
Conclusion: HDAC3 forms a feedback loop with multiple miRNAs to regulate the response to anti-cancer drugs.
Significance: miR-326 and HDAC3 serve as targets for the development of anti-cancer therapeutics.
Keywords: Angiogenesis, Gene Expression, Histone Deacetylase 3 (HDAC3), MicroRNA (miRNA), Tumor Metastases, Anti-cancer Drug Resistance, Feedback Loop, miR-326
Abstract
Histone modification is known to be associated with multidrug resistance phenotypes. Cancer cell lines that are resistant or have been made resistant to anti-cancer drugs showed lower expression levels of histone deacetylase-3 (HDAC3), among the histone deacetylase(s), than cancer cell lines that were sensitive to anti-cancer drugs. Celastrol and Taxol decreased the expression of HDAC3 in cancer cell lines sensitive to anti-cancer drugs. HDAC3 negatively regulated the invasion, migration, and anchorage-independent growth of cancer cells. HDAC3 conferred sensitivity to anti-cancer drugs in vitro and in vivo. TargetScan analysis predicted miR-326 as a negative regulator of HDAC3. ChIP assays and luciferase assays showed a negative feedback loop between HDAC3 and miR-326. miR-326 decreased the apoptotic effect of anti-cancer drugs, and the miR-326 inhibitor increased the apoptotic effect of anti-cancer drugs. miR-326 enhanced the invasion and migration potential of cancer cells. The miR-326 inhibitor negatively regulated the tumorigenic, metastatic, and angiogenic potential of anti-cancer drug-resistant cancer cells. HDAC3 showed a positive feedback loop with miRNAs such as miR-200b, miR-217, and miR-335. miR-200b, miR-217, and miR-335 negatively regulated the expression of miR-326 and the invasion and migration potential of cancer cells while enhancing the apoptotic effect of anti-cancer drugs. TargetScan analysis predicted miR-200b and miR-217 as negative regulators of cancer-associated gene, a cancer/testis antigen, which is known to regulate the response to anti-cancer drugs. HDAC3 and miR-326 acted upstream of the cancer-associated gene. Thus, we show that the miR-326-HDAC3 feedback loop can be employed as a target for the development of anti-cancer therapeutics.
Introduction
Multidrug resistance-1 (MDR1) confers resistance to anti-cancer drugs. The deacetylation of histones H3 and H4 at the MDR1 promoter leads to the suppression of MDR1 expression (1). ABCG2 is a ubiquitous ATP-binding cassette transmembrane protein that confers resistance to anti-cancer drugs. The overexpression of ABCG2 is accompanied by an increase in acetylated histone H3, but a decrease in class I HDACs3 is associated with the ABCG2 promoter (2). These reports suggest the role of histone modifications in anti-cancer drug resistance.
Among the numerous HDACs, histone deacetylase-3 (HDAC3) is ubiquitously expressed and conserved in a wide range of species (3). HDAC3 forms large co-repressor complexes containing N-CoR/SMRT and additional proteins (4). HDAC3 regulates the JNK pathway (5), NF-κB activity (6), MAPK activation (7), and apoptosis (8, 9). HDAC3 represses CREB3-mediated transcription and migration of metastatic breast cancer cells (10).
The phase I clinical trial reveals that albumin-bound Taxol shows encouraging activity against advanced metastatic melanomas (11). Resistance to Taxol, a microtubule-targeting drug, in hepatoma cells is related to JNK activation and prohibition into mitosis (12). Taxol resistance results from MAPK activation (13). Inhibition of MAPK enhances Taxol-induced apoptosis (14). These reports suggest the potential role of HDAC3 in determining the response to microtubule-targeting drugs, including Taxol. However, the role of HDAC3 in determining the response to microtubule-targeting drugs in cancer cell lines such as hepatoma and melanoma remains unknown.
miRNAs are a class of endogenous 21–23-nucleotide (in mammals) noncoding RNAs that regulate the expression of target genes either through translational inhibition or destabilization of mRNA (15). miRNAs play important roles in tumor development by regulating the expression of various oncogenes and tumor suppressor genes (15). miRNAs suppress tumorigenicity and multidrug resistance. For example, miR-199a suppresses tumorigenicity and multidrug resistance of ovarian cancer-initiating cells (16). miR-27a reverses the multidrug resistance phenotype by regulating the expression of MDR1 and β-catenin (17). miR-200b forms a feedback loop with CAGE, a cancer/testis antigen, and it regulates the invasion and tumorigenic and angiogenic responses in a cancer cell line to microtubule-targeting drugs (18). The miR-29 family functions as a tumor suppressor (19, 20). Expression of these miRNAs inhibits cell proliferation, promotes apoptosis of cancer cells, and suppresses tumorigenicity by targeting multiple oncogenes. However, the role of miRNAs in anti-cancer drug resistance remains largely unknown.
In this study, we wanted to investigate the role of HDAC3, among HDAC(s), in anti-cancer drug resistance. We show the in vitro and in vivo functional role of HDAC3 in anti-cancer drug resistance. We show the regulatory network involving HDAC3 and miRNAs. We show that miR-326, which forms a negative feedback regulatory loop with HDAC3, regulates the invasion and the metastatic potential of cancer cells and tumor-induced angiogenesis in response to anti-cancer drugs. miR-200b, miR-217, and miR-335, which form a positive feedback loop with HDAC3, confer sensitivity to anti-cancer drugs. We show that CAGE, reported to form a feedback loop with miR-200b, serves as a downstream target of HDAC3 and miR-326. In this study, we show that the regulation of the miR-326/HDAC3 axis can be employed for the development of anti-cancer therapeutics.
EXPERIMENTAL PROCEDURES
Cell Lines and Cell Culture
Cancer cell lines made resistant to microtubule-targeting drugs were established by stepwise addition of the respective drug. Cells surviving drug treatment (attached fraction) were obtained and used throughout this study. SNU387/SNU387R or Malme3M/Malme3MR cells that stably express antisense HDAC3 cDNA or HDAC3-FLAG were selected by G418 (400 μg/ml). Malme3MR cells that stably express miR-200b, miR-217, or miR-335 were also selected by G418 (400 μg/ml). Human umbilical vein endothelial cells (HUVECs) were isolated from human umbilical cord veins according to standard procedures (18).
Materials
Anti-mouse and anti-rabbit IgG-horseradish peroxidase-conjugated antibodies were purchased from Pierce. An enhanced chemiluminescence (ECL) kit was purchased from Amersham Biosciences. Lipofectamine and PlusTM reagent were purchased from Invitrogen.
Western Blot Analysis
Western blot analysis, immunoprecipitation, and cellular fractionation were performed according to standard procedures (18). For analysis of proteins from tumor tissues, frozen samples were ground to a fine powder using a mortar and pestle over liquid nitrogen. Proteins were solubilized in RIPA buffer containing protease inhibitors, and insoluble material was removed by centrifugation.
Cell Viability Determination
The cells were assayed for their growth activity using the 3-(4,5-dimethylthiazol-2-yl)-2,5-diphenyltetrazolium bromide (MTT; Sigma). Viable cell number counting was carried out by trypan blue exclusion assays.
Annexin V-FITC Staining
Apoptosis detection was performed by using annexin V-FITC according to the manufacturer's instructions (Biovision). Ten thousand cells were counted for three independent experiments.
Caspase-3 Activity Assays
Caspase-3 activity was measured according to the manufacturer's instructions (BioVision, Palo Alto, CA). Cells were lysed in 0.1 m HEPES buffer, pH 7.4, containing 2 mm dithiothreitol, 0.1% CHAPS, and 1% sucrose. Cell lysates were incubated with a colorimetric substrate, 200 μm Ac-DEVD-p-nitroanilide, for 30 min at 30 °C. The fluorescence was measured at 405 nm using a microtiter plate reader.
Histone Deacetylase Activity Assays
Histone deacetylase activity was measured according to the manufacturer's instructions (Cayman Chemical, Ann Arbor, MI). For immunoprecipitation, cells were lysed with ice-cold buffer (10 mm Tris-HCl, pH 7.4, 10 mm NaCl, 15 mm MgCl2, 250 mm sucrose, 0.12 mm EDTA, 0.5% Nonidet P-40, and a mixture of protease inhibitors). The lysates were suspended with nuclear extraction buffer (50 mm HEPES, pH 7.5, 420 mm NaCl, 0.5 mm EDTA, 0.1 mm EGTA and 10% glycerol), sonicated for 30 s, and centrifuged at 10,000 × g for 10 min at 4 °C. The supernatant containing the nuclear extract was immunoprecipitated with anti-HDAC3 (2 μg/ml), anti-HDAC2 (2 μg/ml), or anti-IgG antibody (2 μg/ml). The immunoprecipitates were incubated with 200 μm acetylated fluorometric substrate for 30 min at 37 °C, and 40 μl of developer was added. After 15 min, the fluorescence was measured using an excitation wavelength of 340–360 nm and an emission wavelength of 440–460 nm.
Tumorigenic Potential
Athymic nude mice (BALB/c nu/nu, 5–6-week-old females) were obtained from Orient Bio Inc. (Seoul, Korea) and were maintained in a laminar air-flow cabinet under aseptic conditions. Cancer cells (1 × 10⁶) were injected subcutaneously into the dorsal flank area of the mice. Tumor volume was determined by direct measurement with calipers and calculated by the following formula: length × width × height × 0.5. To determine the effect of HDAC3 on in vivo response to microtubule-targeting drugs, each cancer cell line expressing HDAC3-FLAG, control vector, or antisense HDAC3 cDNA was injected subcutaneously into the dorsal flank area of the mice. Following the establishment of a sizeable tumor, celastrol (1 mg/kg), Taxol (1 mg/kg), or vinblastine (0.5 mg/kg) was administered via tail vein. Tumor volume was measured as described above. To determine the effect of miR-326 on in vivo tumorigenic potential, control inhibitor (40 μg/kg or 50 μm/kg) or miR-200b inhibitor (40 μg/kg or 50 μm/kg) was injected along with or without Taxol (1 mg/kg), following the establishment of sizable tumor by Malme3MR cells, via tail vein five times in a total of 30 days.
Anchorage-independent Growth Assay
Anchorage-independent growth assays were performed according to the manufacturer's instruction (Millipore). The assays were done in 96-well plates, and the plates were incubated at 37 °C for 21–28 days. Anchorage-independent growth was evaluated by using the cell stain solution. Stained colonies were counted using a microscope, and the intensity of staining was quantified by measuring absorbance at 490 nm.
Chemo Invasion Assays
The invasive potential was determined by using a transwell chamber system with 8-μm pore polycarbonate filter inserts (CoSTAR, Acton, MA). The lower and upper sides of the filter were coated with gelatin and Matrigel, respectively. Trypsinized cells (5 × 10³) in serum-free RPMI 1640 medium containing 0.1% bovine serum albumin were added to each upper chamber of the transwell. RPMI 1640 medium supplemented with 10% fetal bovine serum was placed in the lower chamber, and cells were incubated at 37 °C for 16 h. The cells were fixed with methanol, and the invaded cells were stained and counted. Results were analyzed for statistical significance using the Student's t test. Differences were considered significant when p < 0.05.
Wound Migration
Cells were plated overnight to achieve a confluent layer in 24-well plates. A scratch was made on the cell layer with a micropipette tip, and cultures were washed twice with serum-free medium. Cells were then transfected with the construct of interest. Wound healing was visualized by comparing photographs taken at the time of transfection and 48 h later.
RNA Extraction and Quantitative Real Time PCR (qRT-PCR)
Total miRNA was isolated using the mirVana miRNA isolation kit (Ambion). miRNA was extended by a poly(A) tailing reaction using the A-Plus poly(A) polymerase tailing kit (Cell Script). cDNA was synthesized from miRNA with poly(A) tail using a poly(T) adaptor primer and qScriptTM reverse transcriptase (Quanta Biogenesis). The expression level of miR-326 or other miRNA genes was quantified with the SYBR Green qRT-PCR kit (Ambion) using an miRNA-specific forward primer and a universal poly(T) adaptor reverse primer. The expression of miR-326 was defined based on the threshold (Ct), and the relative expression levels were calculated as 2−((Ct of miR-326) − (Ct of U6)) after normalization with reference to the expression of U6 small nuclear RNA. For detection of HDAC3 or CAGE RNA level, total RNA was isolated using TRIzol (Invitrogen), and 1 μg of total RNA was used to synthesize complementary DNA using random primers and reverse transcriptase (Super Script II RT; Invitrogen). For quantitative PCR, SYBR PCR master mix (Applied Biosystems) was used in a CFX96 real time system thermocycler (Bio-Rad).
miR-326 and pGL3–3′UTR-HDAC3 Constructs
To generate miR-326 expression vector, a 500-bp genomic fragment encompassing the primary miR-326 gene was PCR-amplified and cloned into the BamHI/XhoI site of the pcDNA3.1 vector. The construction of the miR-200b expression vector is described elsewhere (17). To generate miR-217 vector, a 310-bp genomic fragment encompassing the primary miR-217 gene was PCR-amplified and cloned into BamHI/XhoI site of the pcDNA3.1 vector. To generate miR-335 vector, a 351-bp genomic fragment encompassing the primary miR-335 gene was PCR-amplified and cloned into BamHI/XhoI site of the pcDNA3.1 vector. To generate pGL3–3′UTR-HDAC3 construct, 500-bp human HDAC3 gene segment encompassing 3′UTR was PCR-amplified and subcloned into XbaI site of pGL3 luciferase plasmid. Mutant pGL3–3′UTR-HDAC3 construct was made with the Quick-change site-directed mutagenesis kit (Stratagene). Luciferase activity assay was performed according to the instruction manual (Promega).
Chromatin Immunoprecipitation (ChIP) Assays
Assays were performed according to the manufacturer's instruction (Upstate). For detection of binding the protein of interest to miR-326 promoter sequences, the following specific primers were used: miR-326 promoter-1 sequences 5′-AGAGGAGTCAGCAGAAGGGT-3′ (sense) and 5′-GCCCTCTCTGGATGTGTCTG-3′ (antisense); miR-326 promoter-2 sequences 5′-CATGCCAGACTGAGATGAGA-3′ (sense) and 5′-GACTTGCTGTGCACCTATTG-3′ (antisense); and miR-326 promoter-3 sequences 5′-CAAAGAAATCTGGCAGTGCT-3′ (sense) and 5′-AGGTCCAAGTCTGTCTGTCT-3′ (antisense). For detection of binding the proteins of interest to miR-200b promoter sequences, the following specific primers were used: miR-200b promoter-1 sequences 5′-CACCCCCTGCCCTCAGAC-3′ (sense) and 5′-CCCACGTGCTGCCTTGTC-3′ (antisense); miR-200b promoter-2 sequences 5′-CTTCCTATGGGACCACCCAG-3′ (sense) and 5′-GGGCACTGAGGACAGCATC-3′ (antisense); and miR-200b promoter-3 sequences [5′-GGTGGAAGGTGCCAGAAAAC-3′ (sense) and 5′-CTGGAGCCCAGAGACCCTA-3′ (antisense). For detection of binding the proteins of interest to miR-217 promoter sequences, the following specific primers were used: miR-217 promoter-1 sequences 5′-GTAATATAATAAACAAGAAAACTTTTGGAAGTG-3′ (sense) and 5′-GTTTTCCTCCCTGCCAGCTTTATT-3′ (antisense); miR-217 promoter-2 sequences 5′-ACCCCATCTCTACTAAAAATACAAAAATTAG-3′ (sense) and 5′-TATATCTAACCTACTAATCAAGCCACCTTAGCT-3′ (antisense); and miR-217 promoter-3 sequences 5′-AGTAGGTTAGATATAGAATTTTAAAAAGCTATTTTT-3′ (sense) and 5′-CCCAATTTACCAAGAGAGATATATTACAATATAA-3′ (antisense).
Transfection
All transfections were performed according to the manufacturer's instructions. Lipofectamine and Plus reagents (Invitrogen) were used. The construction of siRNA was carried out according to the instruction manual provided by the manufacturer (Ambion, Austin, TX). For miR-326 knockdown, cells were transfected with 50 nm oligonucleotide (inhibitor) with Lipofectamine 2000 (Invitrogen), according to the manufacturer's protocol. The sequences used were 5′-CCUCUGGGCCCUUCCUCCAG-3′ (miR-326 inhibitor) and 5′-GCCUCCGGCUUCGCACCUCU-3′ (control inhibitor).
Immunohistochemistry
Paraffin-embedded tissue sections were immunostained using the Vecta stain ABC elite kit (Vector Laboratories). Tissue sections were deparaffinized with xylene and washed in ethanol. Endogenous peroxidase activity was blocked with 3% hydrogen peroxide and H2O for 10 min. Slides were then blocked with 5% normal goat serum in TBS containing 0.1% Tween 20 (TBS-T) for 1 h. For immunohistochemistry, a primary antibody to HDAC3 (1:100, Santa Cruz Biotechnology), CAGE (1:100, Santa Cruz Biotechnology), MDR1 (1:100, Santa Cruz Biotechnology), SNAIL (1:100, Santa Cruz Biotechnology), or IgG (1:100, Santa Cruz Biotechnology) was added and incubation continued at 4 °C for 24 h. After washing with TBS-T, slides were treated with biotinylated secondary antibody for 30 min. After washing, slides were incubated in the ABC complex for 30 min and then stained with diaminobenzidine (Sigma). Sections were counterstained with hematoxylin and finally mounted using Fixo gum rubber cement (Mercateo, München, Germany). For angiogenic potential analysis, harvested tissues (lung tumor) were frozen in optimal cutting temperature compound by Tissue Tek (OCT; Allegiance, McGaw, IL). Frozen tissues were cryosectioned (6–10 μm) and placed on positively charged glass slides. Nonspecific binding of antibodies was blocked by incubation with 1% bovine serum albumin (BSA) for 1 h before incubation with anti-CD31 antibody (1:100, Abcam) overnight at 4 °C. After washing, secondary antibody (goat anti-rabbit IgG-Alexa 488, In Vitrogen) was applied at 1:100 or 1:200 dilutions for 1 h. DAPI (Molecular Probes) was added to stain nuclei. Confocal images were acquired using a confocal laser scanning microscope (FV-1000, Olympus).
In Vivo Metastasis Assay
Female athymic nude mice were used for the studies. Malme3MR cells (106 cells in PBS) were injected intravenously into the tail vein of 4-week-old athymic nude mice, and the extent of lung metastasis was evaluated. Control inhibitor (50 μm/kg) or miR-326 inhibitor (50 μm/kg) was injected intravenously into the tail vein of athymic nude mice five times. After 4 weeks, the mice were sacrificed and analyzed for lung colonization. The lungs were rinsed with PBS and then fixed and stained with Bouin's solution. After 24 h, the lungs were rinsed in water to remove excess Bouin's solution, and the extent of lung metastases was quantified.
In Vivo Matrigel Plug Assay
Seven-week-old BALB/C mice (DBL Co., Ltd., Korea) were injected subcutaneously with 0.1 ml of Matrigel containing the conditioned medium and 10 units of heparin (Sigma). The injected Matrigel rapidly formed a single, solid gel plug. After 8 days, the skin of the mouse was easily pulled back to expose the Matrigel plug, which remained intact. Hemoglobin (Hb) content in the Matrigel plugs was measured using the Drabkin reagent (Sigma) for quantification of blood vessel formation.
Intravital Microscopy
Male BALB/c mice (6–8 weeks old) were obtained from Daehan Biolink (Korea). In vivo angiogenesis was assessed as follows. The mice were anesthetized with 2.5% avertin (v/v) via intraperitoneal injection (Surgivet), and abdominal wall windows were implanted. Next, a titanium circular mount with eight holes on the edge was inserted between the skin and the abdominal wall. Growth factor-reduced Matrigel containing the conditioned medium was applied to the space between the windows, and a circular glass coverslip was placed on top and fixed with a snap ring. After 4 days, the animals were anesthetized and injected intravenously with 50 μl of 25 ng/ml fluorescein isothiocyanate-labeled dextran (Mr ∼2,000,000) via the tail vein. The mice were then placed on a Zeiss Axiovert 200 M microscope. The epi-illumination microscopy setup included a 100-watt mercury lamp and filter set for blue light. Fluorescence images were recorded at random locations of each window using an electron-multiplying charge-coupled device camera (Photo Max 512, Princeton Instruments) and digitalized for subsequent analysis using the Metamorph program (Universal Imaging). The assay was scored from 0 (negative) to 5 (most positive) in a double-blind manner.
Endothelial Cell Tube Formation Assays
Growth factor-reduced Matrigel was pipetted into pre-chilled 24-well plates (200 μl of Matrigel per well) and polymerized for 30 min at 37 °C. The HUVECs were placed onto the layer of Matrigel in 1 ml of M199 containing 1% FBS. After 6–8 h of incubation at 37 °C in a 95:5% (v/v) mixture of air and CO2, the endothelial cells were photographed using an inverted microscope (magnification ×100; Olympus). Tube formation was observed using an inverted phase contrast microscope. Images were captured with a video graphic system. The degree of tube formation was quantified by measuring the length of tubes in five randomly chosen low power fields (×100) from each well using the Image-Pro plus version 4.5 (Media Cybernetics, San Diego).
miRNA Target Analysis
Genes that contain the miR-binding site(s) in the UTR were obtained using the TargetScan program.
Statistical Analysis
Statistical differences were determined by using the Student's t test.
RESULTS
Expression Level of HDAC3 Is Inversely Correlated with the Resistance to Anti-cancer Drugs
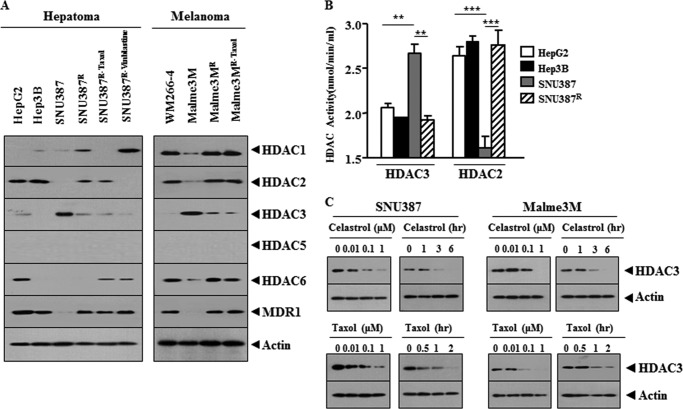
Reports suggest the role of HDAC(s) in anti-cancer drug resistance (1, 2). We therefore examined the relationship between the expression level of HDAC(s) and the response to anti-cancer drugs. Celastrol, a triterpene extracted from the Chinese “Thunder of God Vine,” is a potent proteasome inhibitor and suppresses human prostate cancer growth in nude mice (21). Celastrol inhibits the proliferation of wide variety of human tumor cell types, and it induces apoptosis through the activation of JNK and the suppression of PI3K/Akt signaling pathway (22). SNU387R, the hepatic cancer cell line selected for resistance to celastrol, and HepG2 and Hep3B hepatoma cell lines show higher resistance to anti-cancer drugs than SNU387 cells (Table 1). SNU387R and Malme3MR (melanoma cell line selected for resistance to celastrol) cells are 3.3- and 2.6-fold resistant to celastrol compared with parental cells (Table 1). SNU387R and Malme3MR cells are 2.5- and 2.1-fold resistant to Taxol compared with parental cells, respectively (Table 1). SNU387R and Malme3MR cells are 2.0- and 2.0-fold resistant to vinblastine compared with parental cells, respectively (Table 1). SNU387R-Taxol and Malme3MR-Taxol cells (selected for resistance to Taxol) are 3.6- and 2.3-fold resistant to celastrol compared with parental cells, respectively (Table 1). SNU387R-vinblastine cells are 2.6- and 3.4-fold resistant to celastrol and Taxol compared with parental cells, respectively (Table 1). These results suggest cross-resistance among anti-cancer drugs. Melanoma cells WM266-4 and Malme3MR show higher resistance to anti-cancer drugs than Malme3M cells (Table 1). Malme3MR-Taxol also shows higher resistance to anti-cancer drugs (Fig. 1A). SNU387R-Taxol, SNU387R-vinblastine, and Malme3MR-Taxol cells show lower expression of HDAC3 than their parental cells (Fig. 1A). WM266-4 and Malme3MR show lower expression levels of HDAC3 than Malme3M (Fig. 1A). HepG2 and Hep3B also show lower expression levels of HDAC3 than SNU387 (Fig. 1A). HDAC1 and HDAC2 show an inverse relationship with HDAC3 in melanoma cell lines but not in hepatoma cell lines (Fig. 1A). HDAC1 and HDAC2 show correlations with MDR1 in melanoma cell lines but not in hepatoma cell lines (Fig. 1A). HDAC5 shows no expression in any of these cancer cell lines (Fig. 1A). HDAC6 shows an inverse relationship with HDAC3 in melanoma cell lines but not in hepatoma cell lines (Fig. 1A). The expression level of HDAC3 is correlated with HDAC3 and HDAC2 activity (Fig. 1B). Celastrol and Taxol decrease the expression of HDAC3 (Fig. 1C), suggesting that the decreased expression of HDAC3 may induce resistance to these anti-cancer drugs. As only HDAC3, among the HDAC(s), shows an inverse relationship with MDR1 in every cancer cell line we employed (Fig. 1B), we focused our study on HDAC3.
TABLE 1.
Drug-sensitivity (half-maximal inhibitory concentration [IC50]) and relative resistance of cancer cell lines
The indicated cancer cell line was treated with or without various concentrations of the indicated drugs for 48 h. SNU387R and Malme3MR cells were originally selected for resistance to celastrol (25). The cell viability was analyzed by an MTT assay. The IC50 value of each cell line was calculated from the concentration-response curves. All values indicate the mean ± S.D. Relative resistance means IC50 ratio of SNU387R or Malme3MR cell line to parental cell lines. RF is resistance factor.
| Drug IC50a (RF) | |||
|---|---|---|---|
| Cell line | Celastrol | Taxol | Vinblastine |
| μm | μm | nm | |
| HepG2 | 3.11 ± 0.053 (3.7) | 2.29 ± 0.052 (2.7) | 7.52 ± 0.024 (2.1) |
| Hep3B | 3.03 ± 0.041 (3.5b) | 2.54 ± 0.041 (3.0) | 7.44 ± 0.224 (2.1) |
| SNU387 | 0.86 ± 0.020c | 0.85 ± 0.001 | 3.54 ± 0.021 |
| SNU387R | 2.80 ± 0.046 (3.3) | 2.13 ± 0.079 (2.5) | 7.00 ± 0.124 (2.0) |
| SNU387R-Taxol | 3.11 ± 0.031 (3.6) | 2.87 ± 0.021 (3.4) | 8.00 ± 0.142 (2.3) |
| SNU387R-Vinblastine | 2.26 ± 0.029 (2.6) | 2.90 ± 0.049 (3.4) | 10.01 ± 0.252 (2.8) |
| WM266-4 | 2.19 ± 0.048 (3.8) | 1.20 ± 0.575 (2.3) | 15.34 ± 0.041 (2.1) |
| Malme3M | 0.58 ± 0.006 | 0.51 ± 0.063 | 7.70 ± 0.060 |
| Malme3MR | 1.51 ± 0.049 (2.6) | 1.07 ± 0.056 (2.1) | 15.42 ± 0.127 (2.0) |
| Malme3MR-Taxol | 1.36 ± 0.020 (2.3) | 1.50 ± 0.047 (2.9) | 15.25 ± 0.035 (2.0) |
a IC50 indicates the concentration of drug required to inhibit cell growth by 50%.
b IC50 in resistant cell line/IC50 in parent cell line.
c Means ± S.D. are of three independent experiments.
FIGURE 1.
HDAC3 expression level is inversely related with the resistance to anti-cancer drugs. A, cell lysates from the indicated cancer cell lines were subjected to Western blot analysis. B, cell lysates were subjected to HDAC activity assays. **, p < 0.005; ***, p < 0.0005. C, indicated cancer cell lines were treated with celastrol or Taxol as indicated. Cell lysates prepared were subjected to Western blot analysis.
HDAC3 Regulates the Response to Anti-cancer Drugs
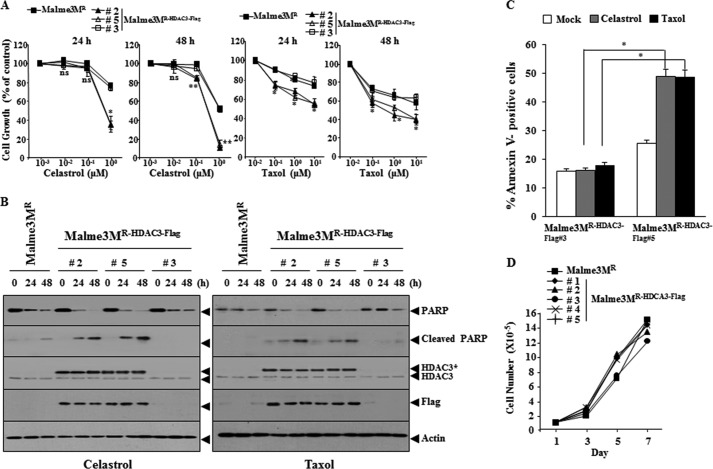
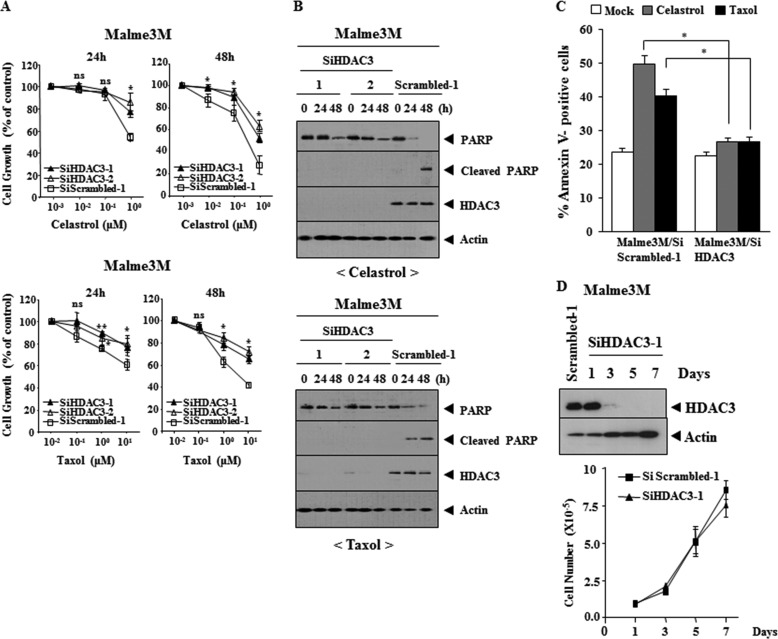
We examined the effect of HDAC3 on the response to anti-cancer drugs. Malme3MR cell line stably expressing wild type HDAC3 (Malme3MR-HDAC3-FLAG) shows the enhanced sensitivity to anti-cancer drugs (Fig. 2A) and cleavage of PARP by anti-cancer drugs (Fig. 2B). Malme3MR-HDAC3-FLAG cells show the enhanced apoptotic cell death in response to anti-cancer drugs (Fig. 2C). Malme3MR-HDAC3-FLAG cells show similar growth rates to Malme3MR cells (Fig. 2D). The down-regulation of HDAC3 induces resistance to anti-cancer drugs in Malme3M (Fig. 3A) and prevents cleavage of PARP by anti-cancer drugs (Fig. 3B). The down-regulation of HDAC3 decreases apoptotic cell death in response to anti-cancer drugs (Fig. 3C), but it does not affect cellular proliferation of Malme3M cells (Fig. 3D). These results suggest that HDAC3 regulates the response to anti-cancer drugs.
FIGURE 2.
HDAC3 confers sensitivity to microtubule-targeting drugs. A, Malme3MR or Malme3MR-HDAC3-FLAG cells were treated with various concentrations of anti-cancer drugs, followed by MTT assay. *, p < 0.05; **, p < 0.005. p value was determined in comparison with value obtained from Malme3MR cells. ns denotes not significant. B, indicated cancer cell line was treated with celastrol (1 μm) or Taxol (1 μm) for various time intervals. C, indicated cancer cell line was treated with celastrol (1 μm) or Taxol (1 μm) for 24 h, followed by annexin V-FITC staining. *, p < 0.05. D, cellular proliferation of the indicated cancer cell line was measured by trypan blue exclusion assays.
FIGURE 3.
Down-regulation of HDAC3 confers resistance to microtubule-targeting drugs. A, Malme3M cells were transfected with the indicated siRNA (each at 10 nm). The next day, cells were treated with various concentrations of celastrol or Taxol for 24 or 48 h. MTT assays were performed as described. ns denotes not significant. B, same as A except that Western blot analysis was performed. C, Malme3M cells were transfected with the indicated siRNA (10 nm each). The next day, cells were treated with celastrol (1 μm) or Taxol (1 μm) for 24 h, followed by annexin V-FITC staining. D, Malme3M cells were transfected with the indicated siRNA (10 nm each). On the indicated day after transfection, cell lysates were subjected to Western blot analysis (upper panel), and cell number was determined by trypan blue exclusion assays (lower panel).
HDAC3 Regulates the Invasion, Migration, and the Anchorage-independent Growth of Cancer Cells
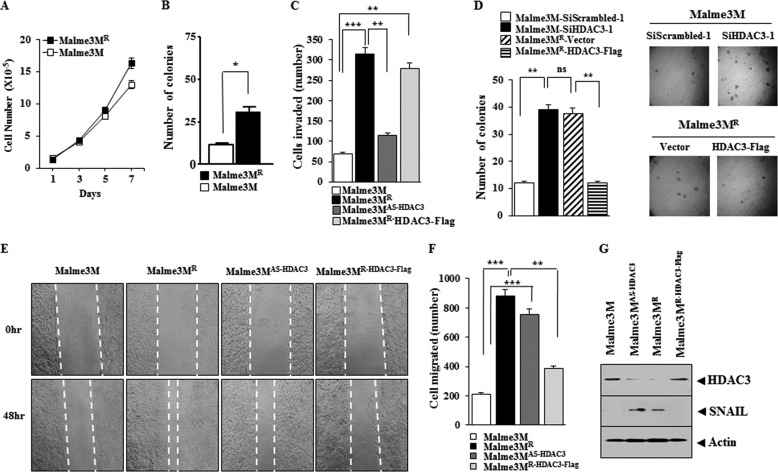
Malme3MR cells show higher cellular proliferation (Fig. 4A) and anchorage-independent growth potential (Fig. 4B) than Malme3M cells. Mame3MAS-HDAC3 cells show higher invasion potential than Malem3M cells, although the Malme3MR-HHDAC3-FLAG cells show lower invasion potential than Malme3MR cells (Fig. 4C). The down-regulation of HDAC3 enhances anchorage-independent growth potential of Malme3M cells, whereas the overexpression of HDAC3 decreases anchorage independent-growth potential of Malme3MR cells (Fig. 4D). Malme3MR and Malme3MAS-HDAC3 cells show higher migration potential than Malme3M cells, and Malme3MR-HDAC3-FLAG cells show lower migration potential than Malme3MR cells (Fig. 4, E and F). Malme3MAS-HDAC3 and Malme3MR cells show higher expression of SNAIL than Malme3M and Malme3MR-HDAC3-FLAG cells, respectively (Fig. 4G). These results suggest that resistance to anti-cancer drugs is related with the enhanced invasion, migration, and anchorage-independent potential.
FIGURE 4.
HDAC3 regulates the invasion, migration, and the growth potential of cancer cells. A, cellular proliferation of was determined by trypan blue exclusion assay. Each value represents an average of three independent experiments. B, indicated cancer cell line was harvested, counted, resuspended in 0.2% soft agar, and seeded onto 0.4% soft agar supplemented with 10% fetal bovine serum (1000 cells/well for Malme3M/Malme3MR cells). Four weeks later, colonies were stained and counted. The columns represent mean of triplicate experiments; bars indicate S.D.; *, p < 0.05. C, indicated cancer cell line was subjected to invasion assays. Malme3MR-HDAC3-FLAG denotes cells that stably express HDAC3-FLAG. Malme3M AS-HDAC3 denotes cells that stably express antisense HDAC3. **, p < 0.005; ***, p < 0.0005. D, Malme3M or Malme3MR cells were transfected with the construct as indicated, followed by anchorage-independent growth assays. Each value represents average of three independent experiments. E, indicated cancer cell lines were subjected to wound migration assays. Movement of cells into wound was shown for the indicated cancer cell lines at 0 and 48 h post-scratch (×40). The broken lines indicate the boundary lines of scratch. F, data were the means of three independent experiments, and the bars represent S.D. of the mean. G, cell lysates were subjected to Western blot analysis. ns denotes not significant.
HDAC3 Confers Sensitivity to Anti-cancer Drugs in Vivo
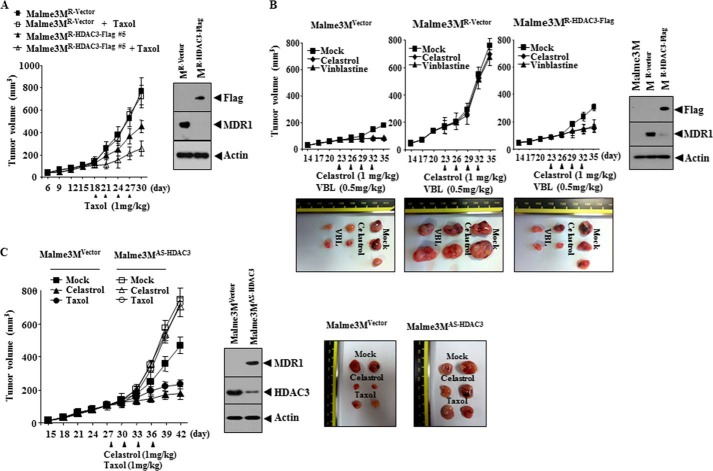
We examined whether HDAC3 would confer in vivo sensitivity to anti-cancer drugs. The xenograft of Malme3MR-vector cells shows higher tumorigenic potential and resistance to Taxol than the xenograft of Malme3MR-HDAC3-FLAG cells (Fig. 5A). The xenograft of Malme3MR-HDAC3-FLAG cells shows a lower expression level of MDR1 than the xenograft of Malme3MR cells (Fig. 5A). The xenograft of Malme3MR-vector cells shows higher tumorigenic potential than Malme3MVector cells and shows higher resistance to celastrol and vinblastine than the xenograft of Malme3MR-HDAC3-FLAG cells (Fig. 5B). The xenograft of Malme3MVector cells shows a lower expression level of MDR1 than the xenograft of Malme3MR-Vector cells (Fig. 5B). The xenograft of Malme3MR-HDAC3-FLAG cells shows a lower expression level of MDR1 than the xenograft of Mame3MR-vector cells (Fig. 5B). The xenograft of Malme3MAS-HDAC3 cells shows a higher tumorigenic potential, resistance to celastrol and Taxol, and expression level of MDR1 than the xenograft of Malme3MVector cells (Fig. 5C). These results indicate that HDAC3 level determines the in vivo response to anti-cancer drugs.
FIGURE 5.
HDAC3 confers sensitivity to microtubule-targeting drugs in vivo. A, Malme3MR-Vector (1 × 10⁶) or Malme3MR-HDAC3-FLAG cells (1 × 10⁶) were injected into the dorsal flanks of athymic nude mice. Taxol (1 mg/kg) was injected into each nude mouse after the tumor reached a certain size. Tumor volume was measured as described. Each experimental group consisted of five mice. Each value represents an average obtained from the five athymic nude mice of each group. Data are expressed as mean ± S.D. Tumor lysates were subjected to Western blot analysis (right panel). B, Malme3MVector (1 × 10⁶), Malme3MR-vector (1 × 10⁶), or Malme3MR-HDAC3-FLAG cells (1 × 10⁶) were injected into the dorsal flanks of athymic nude mice. Celastrol (1 mg/kg) or vinblastine (0.5 mg/kg) was injected into each nude mouse after the tumor reached a certain size. Tumor volume was measured as described. Each experimental group consisted of five mice. Each value represents an average obtained from the five athymic nude mice of each group. Data are expressed as mean ± S.D. Each figure shows a representative image of the mice in each group at the time of sacrifice. Tumor-bearing mice were assessed for weight loss. All animal experiments were approved by Institutional Animal Care and Use Committee (IACUC) of Kangwon National University (KIACUC-13-0005). Lysates isolated from each tumor tissue were subjected to Western blot analyses. C, Malme3MVector (1 × 10⁶) or Malme3MAS-HDAC3 cells (1 × 10⁶) were injected into the dorsal flanks of athymic nude mice. Celastrol (1 mg/kg) or Taxol (1 mg/kg) was injected into each nude mouse after the tumor reached a certain size. Tumor volume was measured as described. Each experimental group consists of five mice. Each value represents an average obtained from five athymic nude mice of each group. Data are expressed as mean ± S.D. Tumor lysates were also subjected to Western blot (lower panel).
HDAC3 Regulates the Expression of Multiple miRNAs
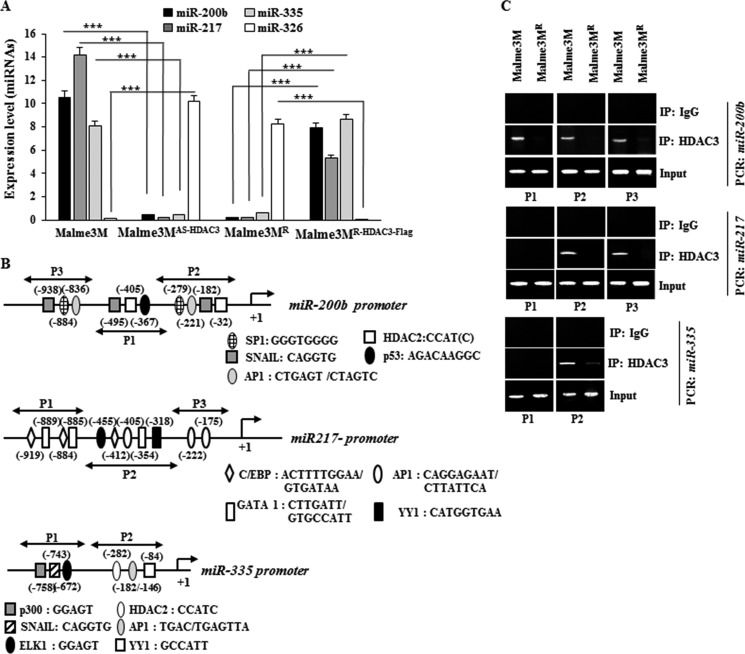
In an effort to unravel the role of miRNAs, we identified miRNAs that showed differential expression between Malme3M and Mame3MR cell line by performing miRNA array analysis. These miRNAs include miR-200b, miR-217, miR-335, and miR-326 (data not shown). miR-200b enhances the sensitivity to anti-cancer drugs by forming a negative feedback loop with CAGE (18). This suggests a potential relationship between CAGE and HDAC3. miR-200b inhibits growth, epithelial-mesenchymal transition, and the metastatic potential of prostate cancer cells (23). qRT-PCR analysis shows that miR-200b, miR-217, and miR-335 show lower expression levels in Malme3MR cells than in Malme3M cells, whereas miR-326 shows lower expression levels in Malme3M cells than in Malme3MR cells (Fig. 6A). miR-335 is decreased in various chemo-resistant cancer cell lines (24) and suppresses the invasiveness and promotes apoptosis of lung cancer cells A549 and H1299 by targeting Bcl-w and SP1 (25). miR-217 functions as a tumor suppressor by regulating the expression of KRAS (26).
FIGURE 6.
HDAC3 regulates the expression of multiple miRNAs. A, expression level of each miRNA was determined by qRT-PCR. ***, p < 0.005. B shows potential binding sites of various transcriptional factors in miR-200b, miR-217, or miR-335 promoter sequences. C, cell lysates were subjected to ChIP assays employing anti-HDAC3 antibody (2 μg/ml) or IgG antibody (2 μg/ml).
Broad spectrum HDAC inhibitors control expression of miRNAs in tumor cells (27). HDAC3, Myc, and PRC2 are tethered to the promoter sequences of miR-29 to down-regulate the expression of miR-29 through histone deacetylation and trimethylation (28). The above reports suggest the expression regulation of miRNAs by HDAC(s). Malme3MAS-HDAC3 cells show lower expression of miR-200b, miR-217, and miR-335 while showing higher expression of miR-326 than Malme3M cells (Fig. 6A). Malme3MR-HDAC3-FLAG cells show higher expression of expression of miR-200b, miR-217, and miR-335 than Malme3MR cells (Fig. 6A). Because the expression level of HDAC3 shows correlation with miR-200b, miR-217, and miR-335 (Fig. 6A), we examined the effect of HDAC3 on the expression of these miRNAs. The promoter sequences of miR-200b, miR-217, and miR-335 contain potential binding sites for various transcriptional factors as shown in Fig. 6B. ChIP assays show the binding of HDAC3 to the promoter sequences of miR-200b, miR-217, and miR-335 (Fig. 6C). This indicates the direct involvement of HDAC3 in the expression regulation of miR-200b, miR-217, and miR-335.
p53 Interacts with HDAC3 and Is Responsible for the Binding of HDAC3 to the Promoter Sequences of miRNAs
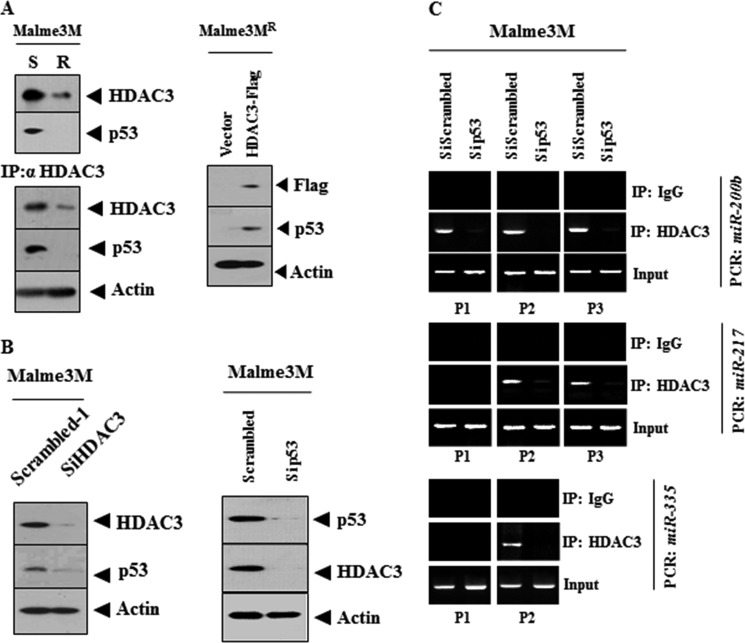
miR-200b promoter contains the binding site for p53 (Fig. 6B). Ataxia telangiectasia mutated-activated p53 and KSRP enhance the maturation of specific miRNAs such as miR-15, miR-16, and miR-206, as part of the DNA damage response (29, 30). DNA damage elicits an increase in miR-335 expression in a p53-dependent manner (31). miR-335 and p53 cooperate in a positive feedback loop to drive cell cycle arrest, limit cell proliferation, and neoplastic cell transformation (31). These reports led us to hypothesize that p53 might be involved in the expression regulation of these miRNAs by HDAC3. Malme3MR cells show lower expression of p53 than Malme3M cells (Fig. 7A). HDAC3 shows an interaction with p53 in Malme3M cells (Fig. 7A). The overexpression of HDAC3 induces the expression of p53 in Malme3MR cells (Fig. 7A). HDAC3 and p53 regulate the expression of each other (Fig. 7B). The down-regulation of p53 prevents the binding of HDAC3 to the promoter sequences of miR-200b, miR-217, and miR-335 (Fig. 7C). Taken together, these results suggest that p53, through its interaction with HDAC3, is responsible for the binding of HDAC3 to the promoter sequences of these miRNAs.
FIGURE 7.
p53 interacts with HDAC3 and is responsible for the binding of HDAC3 to the promoter sequences of miRNAs. A, cell lysates were immunoprecipitated with the indicated antibody (2 μg/ml), followed by Western blot analysis or subjected to Western blot analysis (left panel). The indicated cancer cell line was transfected with control vector (1 μg/ml) or HDAC3-FLAG (1 μg/ml). 48 h after transfection, Western blot analysis was performed (right panel). B, Malme3M cells were transiently transfected with the indicated siRNA (10 nm). 48 h after transfection, Western blot analysis was performed. C, same as B except that ChIP assays were performed. IP, immunoprecipitation.
Overexpression of miR-200b, miR-217, or miR-335 Enhances the Response of Anti-cancer Drug-resistant Cancer Cell Line to Anti-cancer Drugs
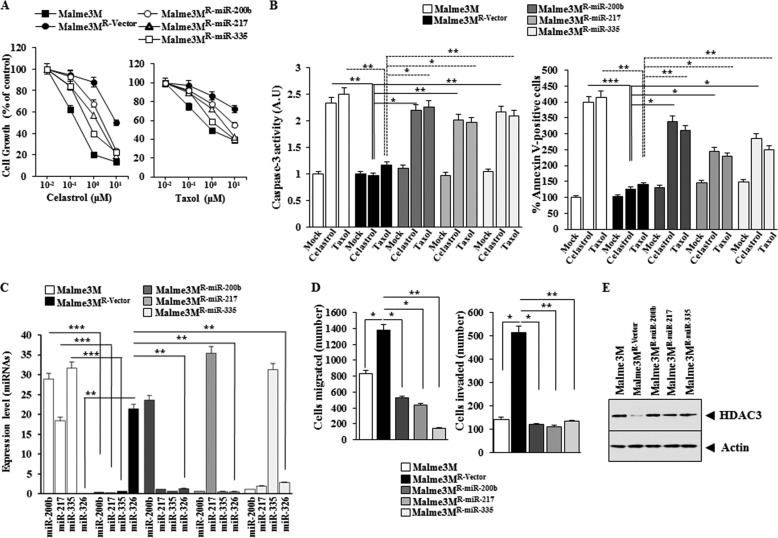
We examined the effect of miR-200b, miR-217, and miR-335 on the response to anti-cancer drugs. Malme3MR cells stably expressing miR-200b, miR-217, or miR-335 (Malme3MR-miR-200b, Malme3MR-miR-217, or Malme3MR-miR-335) show sensitivity to celastrol and Taxol, and Malme3MR-vector cells show resistance to these anti-cancer drugs (Fig. 8A). Malme3MR-miR-200b, Malme3MR-miR-217, and Malme3MR-miR-335 cells show higher caspase-3 activity and the percentage of apoptotic cells than Malme3MR-Vector cells in response to celastrol and Taxol (Fig. 8B). miR-200b, miR-217, or miR-335 does not affect the expression of each other (Fig. 8C). Malme3MR-miR-200b, Malme3MR-miR-217, and Malme3MR-miR-335 cells show lower expression levels of miR-326 (Fig. 8C) migration and invasion potential than Malme3MR-Vector cells (Fig. 8D) but show higher expression levels of HDAC3 than Mame3MR-Vector cells (Fig. 8E). Taken together, these results suggest that miRNAs that form a positive feedback loop with HDAC3 enhance the response to anti-cancer drugs.
FIGURE 8.
miR-200b, miR-217, and miR-335 regulate the response to anti-cancer drugs, the migration, and invasion potential of cancer cells. A, indicated cancer cells were treated with various concentrations of celastrol or Taxol for 48 h, followed by MTT assays. B, indicated cancer cells were treated with celastrol (1 μm) or Taxol (1 μm) for 48 h, followed by caspase-3 activity assay (left panel) or annexin V-FITC assay (right panel). *, p < 0.05; **, p < 0.005; ***, p < 0.0005. C, miRNAs from the indicated cancer cells were subjected to qRT-PCR. **, p < 0.005; ***, p < 0.0005. D, indicated cancer cells were subjected to wound migration assays (left panel) or invasion assays (right panel). *, p < 0.05; **, p < 0.005. E, cell lysates from the indicated cancer cells were subjected to Western blot analysis.
Inhibition of miR-200b, miR-217, or miR-335 Reverses Cellular Phenotypes of Malme3MR-miR-200b, Malme3MR-miR-217, or Malme3MR-miR-335 Cells
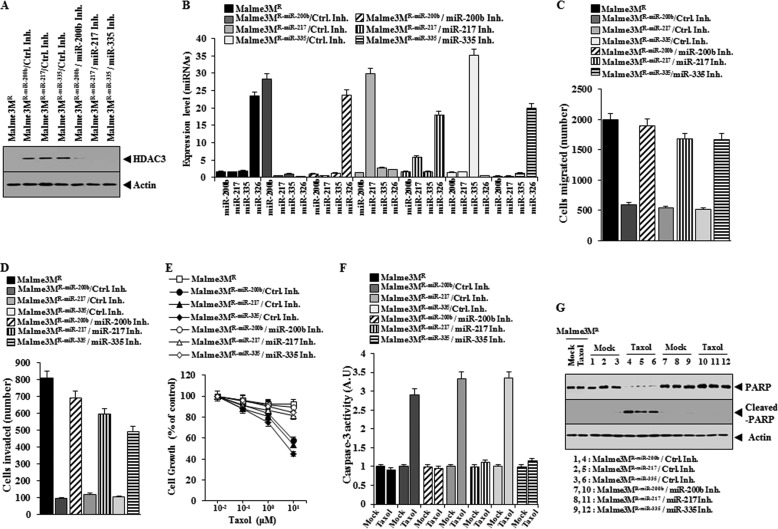
The inhibition of miR-200b, miR-217, or miR-335 in Malme3MR-miR-200b, Malme3MR-miR-217, or Malme3MR-miR-335 cell line decreases the expression of HDAC3 (Fig. 9A) and the expression of miR-200b, miR-217, or miR-335 (Fig. 9B). The inhibition of miR-200b, miR-217, or miR-335 enhances the migration (Fig. 9C) and invasion potential (Fig. 9D) of Malme3MR-miR-200b, Malme3MR-miR-217, or Malme3MR-miR-335 cell line. The inhibition of miR-200b, miR-217, or miR-335 in Malme3MR-miR-200b, Malme3MR-miR-217, or Malme3MR-miR-335 cell line confers resistance to Taxol (Fig. 9E) and prevents Taxol from increasing caspase-3 activity (Fig. 9F) and the cleavage of PARP (Fig. 9G). These results suggest the role of miRNAs in the response to the anti-cancer drugs.
FIGURE 9.
Inhibition of miR-200b, miR-217, or miR-335 confers resistance to anti-cancer drugs and enhances the migration and invasion potential of Malme3MR-miR-200b, Malme3M R-miR-217, or Malme3MR-miR-335 cells. A, indicated cancer cells were transiently transfected with the indicated inhibitor (50 nm each). 48 h after transfection, Western blot analysis was performed. B, same as A except that qRT-PCR analysis was performed. C, indicated cancer cells transiently transfected with the indicated inhibitor (50 nm each) were subjected to wound migration assays. D, same as C except that invasion assays were performed. E, Malme3M cells were transiently transfected with the indicated inhibitor (50 nm each). 24 h after transfection, cells were treated with Taxol (1 μm) for 24 h, followed by MTT assays. F, same as E except that caspase-3 activity assays were performed. G, same as F except that Western blot analysis was performed. Ctrl. Inh., control inhibitor.
Inhibition of miR-200b, miR-217, or miR-335 Confers Resistance to Anti-cancer Drugs and Enhances the Migration and Invasion Potential of Malme3M Cells
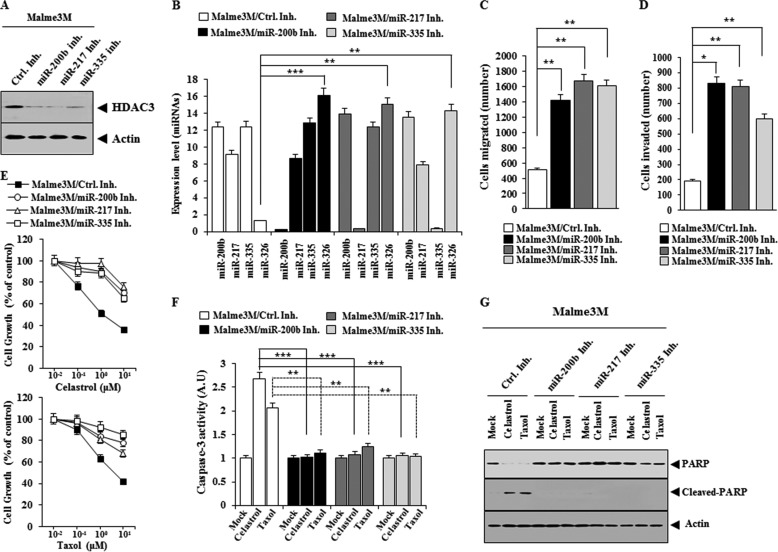
The inhibition of miR-200b, miR-217, or miR-335 decreases the expression of HDAC3 (Fig. 10A) and the expression of miR-200b, miR-217, or miR-335 in Malme3M cells (Fig. 10B), while enhancing the migration (Fig. 10C) and the invasion potential of Malme3M cells (Fig. 10D). The inhibition of miR-200b, miR-217, or miR-335 increases the expression of miR-326 (Fig. 10B). The inhibition of miR-200b, miR-217, or miR-335 confers resistance to celastrol and Taxol (Fig. 10E) and prevents celastrol and Taxol from increasing caspase-3 activity (Fig. 10F) and from inducing the cleavage of PARP (Fig. 10G). These results confirm that miR-200b, miR-217, and miR-335 regulate the response to anti-cancer drugs.
FIGURE 10.
Inhibition of miR-200b, miR-217, or miR-335 confers resistance to anti-cancer drugs and enhances the migration and invasion potential of Malme3M cells. A, Malme3M cells were transiently transfected with the indicated inhibitor (50 nm each). 48 h after transfection, Western blot analysis was performed. B, same as A except that qRT-PCR analysis was performed. **, p < 0.005; ***, p < 0.0005. C, Malme3M cells transfected with the indicated inhibitor (50 nm each) were subjected to wound migration assays. **, p < 0.005. D, same as C except that invasion assays were performed. *, p < 0.05; **, p < 0.005. E, Malme3M cells were transiently transfected with the indicated inhibitor (50 nm each). 24 h after transfection, cells were treated with various concentrations of celastrol (upper panel) or Taxol (lower panel) for 24 h, followed by MTT assays. F, Malme3M cells were transiently transfected with the indicated inhibitor (50 nm each). 24 h after transfection, cells were treated with celastrol (1 μm) or Taxol (1 μm) for 24 h, followed by caspase-3 activity assays. **, p < 0.005; ***, p < 0.0005. G, same as F except that Western blot analysis was performed. Ctrl. Inh., control inhibitor.
TargetScan Analysis Predicts That miR-326 Acts as a Negative Regulator of HDAC3
We wanted to identify targets of miRNAs that were differentially expressed between Malme3M and Malme3MR cell line. miRNA databases predict that both HDAC3 and p53 are regulated by miR-326 and miR-185 (data not shown). miR-185 acts as a tumor suppressor and suppresses gastric cancer metastasis (32). However, miRNA array shows no difference in the expression of miR-185 in between Malme3M and Malme3MR cells (data not shown). miR-326 is negatively regulated by HDAC3 (Fig. 7A). This implies that miR-326 and HDAC3 may form a negative feedback loop. miRNA databases predict that miR-217 regulates the expression of CAGE, a cancer/testis antigen, and VEGFA (data not shown). CAGE enhances the invasion, migration, and the expression of VEGF and enhances tumor-induced angiogenesis (18). CAGE regulates the expression of cyclin D in an AP1 and E2F-dependent manner (33). CAGE regulates the response to anti-cancer drugs through its interaction with HDAC2 (34). miR-335 is predicted to regulate the expression of cyclin D1 and VEGFA (data not shown). miR-200b is predicted to regulate the expression of CAGE, cyclin D1, and VEGFA (data not shown). Because miRNAs that are regulated by HDAC3 are predicted to target CAGE, cyclin D1, or VEGFA, it is probable that HDAC3 may also exert regulation on the expression of CAGE. Taken together, miRNA database analyses suggest that HDAC3 and miRNAs exert a regulation on each other and regulate the response to anti-cancer drugs in relation with the invasion, migration, and angiogenesis.
miR-326 Directly Regulates the Expression of HDAC3
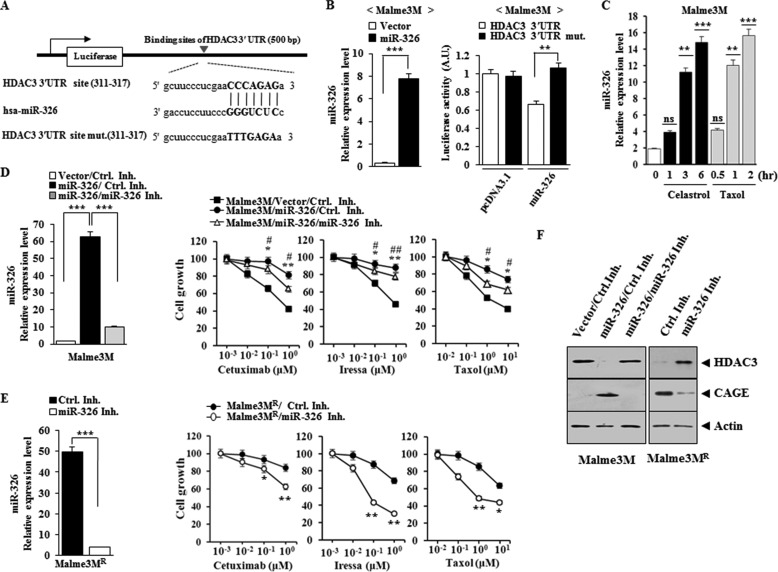
Because HDAC3 is predicted to be a target of miR-326 by miRNA databases, we examined whether miR-326 would exert a direct regulation on the expression of HDAC3. TargetScan analysis predicts the binding of miR-326 to the 3′-UTR of HDAC3 (Fig. 11A). The overexpression of miR-326 decreases the luciferase activity associated with the wild type 3′-UTR-HDAC3, but not mutant 3′-UTR-HDAC3 (Fig. 11B). Celastrol and Taxol increase the expression of miR-326 in Malme3M cells (Fig. 11C), suggesting that the increased expression of miR-326 may confer resistance to these anti-cancer drugs. miR-326 induces resistance to anti-cancer drugs such as cetuximab, iressa, and Taxol in Malme3M cells (Fig. 11D). miR-326 inhibitor enhances sensitivity of Malme3MR cells to anti-cancer drugs (Fig. 11E). miR-326 decreases the expression of HDAC3 while increasing the expression of CAGE (Fig. 11F). miR-326 inhibitor increases the expression of HDAC3 while decreasing the expression of CAGE in Malme3MR cells (Fig. 11F). Taken together, these results suggest that miR-326 confers resistance to anti-cancer drugs by regulating the expression of HDAC3 and CAGE.
FIGURE 11.
miR-326 regulates the expression of HDAC3 and CAGE. A, shows the binding site of miR-326 to 3′UTR on HDAC3. B, wild type or mutant pGL3-HDAC3–3′UTR reporter plasmid in which the luciferase coding sequence had been fused to the wild type or mutant 3′UTR of HDAC3 was co-transfected into each cell line along with pcDNA3.1-miR-326 or pcDNA 3.1 vector. Relative luciferase activity = (Sluc/Cluc). Sluc indicates relative luciferase units of luciferase activity in the pcDNA3.1-miR-326-transfected cell line; Cluc indicates relative luciferase units of luciferase activity in the pcDNA3.1-transfected cell line. 48 h after transfection, the expression of miR-326 was determined by qRT-PCR (left panel). Each value represents average of three independent experiments. Luciferase activity assays were performed as described (right panel). C, Malme3M cells were treated with celastrol (1 μm) or Taxol (1 μm) for various time intervals. The expression level of miR-326 was determined by qRT-PCR. **, p < 0.005; ***, p < 0.0005. ns denotes not significant. D, Malme3M cells were transfected with control vector (1 μg) or miR-326 construct (1 μg) along with control inhibitor (50 nm) or miR-326 inhibitor (50 nm). 48 h after transfection, qRT-PCR analysis was performed (left panel). ***, p < 0.0005. 24 h after transfection, cells were then treated with various concentrations of the indicated anti-cancer drugs for 24 h, followed by MTT assays (right panel). *, ** denotes statistical difference between control inhibitor versus miR-326 inhibitor transfection in miR-326-transfected cells. #, ## denotes statistical difference between control vector transfection and miR-326 construct transfection. E, Malme3MR cells were transfected with control inhibitor (50 nm) or miR-326 inhibitor (50 nm). 48 h after transfection, qRT-PCR analysis was performed (left panel). ***, p < 0.0005. 24 h after transfection with the indicated constructs, cells were then treated with various concentrations of the indicated ant-cancer drugs for 24 h, followed by MTT assays (right panel). F, 48 h after transfection, Western blot analysis was performed. Ctrl. Inh., control inhibitor.
HDAC3 Directly Regulates the Expression of miR-326
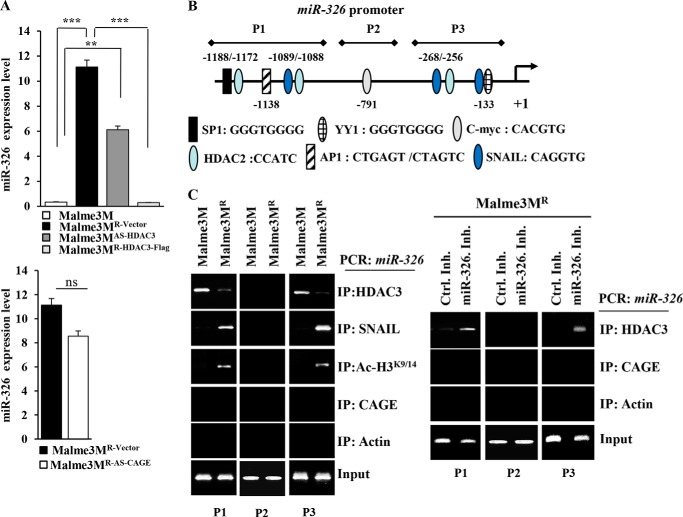
Because miR-326 directly regulates the expression of HDAC3, we examined whether HDAC3 would also exert a direct regulation on the expression of miR-326. qRT-PCR analysis shows higher expression levels of miR-326 in Malme3MR-Vector cells than in Malme3M cells (Fig. 12A). Malme3MAS-HDAC3 cells show a higher expression level of miR-326 than Malm3M cells (Fig. 12A). Malme3MR-HDAC3-FLAG cells show a lower expression level of miR-326 than Malme3MR-Vector cells (Fig. 12A). miR-326 regulates the expression of CAGE (Fig. 11F). However, CAGE does not affect the expression of miR-326 (Fig. 12A), suggesting that CAGE functions downstream of miR-326. We examined the possibility of the direct regulation of miR-326 by HDAC3. miR-326 promoter sequences contain putative binding sites for various transcription factors such as AP1, SP1, HDAC2, SNAIL, c-Myc, and YY1 (Fig. 12B). ChIP assays show the binding of HDAC3 to sites 1 and 3 of the promoter sequences of miR-326 in Malme3M cells (Fig. 12C). SNAIL and Ac-H3K9/14, but not CAGE, show binding to sites 1 and 3 of the promoter sequences of miR-326 in Malme3MR cells (Fig. 12C). The miR-326 inhibitor induces the binding of HDAC3, but not the binding of CAGE, to sites 1 and 3 of the promoter sequences of miR-326 promoter sequences in Malme3MR cells (Fig. 12C). Taken together, these results indicate the direct regulation of miR-326 by HDAC3.
FIGURE 12.
HDAC3 directly regulates the expression of miR-326. A, expression level of miR-326 in each cancer cell line was determined by qRT-PCR analysis. ***, p < 0.0005. ns denotes not significant. B, shows the potential binding sites of various transcriptional factors in miR-326 promoter sequences. C, cell lysates from the indicated cancer cell lines were immunoprecipitated (IP) with the indicated antibody (2 μg/ml), followed by ChIP assays (left panel). Malme3MR cells were transfected with control inhibitor (50 nm) or miR-326 inhibitor (50 nm). 48 h after transfection, cell lysates were isolated and subjected to ChIP assays (right panel).
miR-326 Regulates the Response to Anti-cancer Drugs by Its Effect on Apoptosis
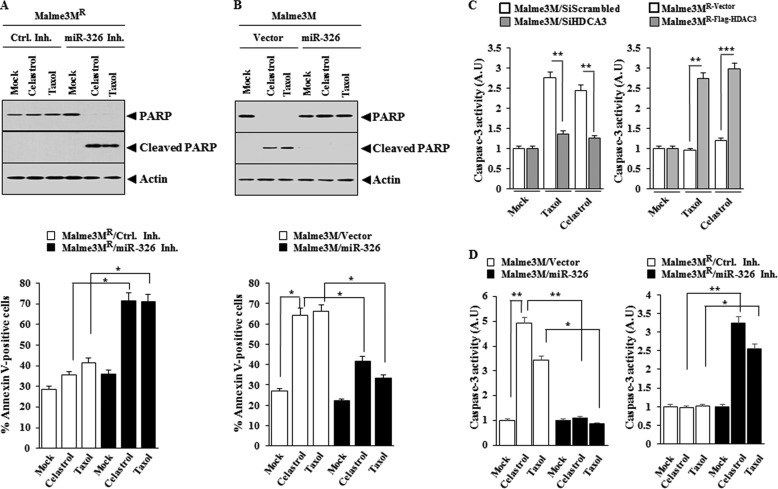
Because miR-326 forms a negative feedback loop with HDAC3, we examined the effect of miR-326 on the response to anti-cancer drugs. The miR-326 inhibitor enhances the cleavage of PARP and increases the proportion of apoptotic cells in Malme3MR cells in response to celastrol and Taxol (Fig. 13A). miR-326 prevents cleavage of PARP in response to celastrol and Taxol and decreases the apoptotic effect of celastrol and Taxol in Malme3M cells (Fig. 13B). The down-regulation of HDAC3 exerts a negative effect on caspse-3 activity in response to celastrol and Taxol in Malme3M cells (Fig. 13C). Malme3MR-HDAC3-FLAG cells show higher caspase-3 activity than Malme3MR-vector cells in response to celastrol and Taxol (Fig. 13C). miR-326 exerts a negative effect on caspase-3 activity in Malme3M cells in response to celastrol and Taxol (Fig. 13D). miR-326 inhibitor enhances caspase-3 activity in Malme3MR cells in response to celastrol and Taxol (Fig. 13D). Taken together, these results suggest that miR-326 regulates response to anti-cancer drugs by its effect on apoptosis.
FIGURE 13.
miR-326 regulates the apoptotic effect of anti-cancer drugs. A, indicated cancer cell line was transfected with control inhibitor or miR-326 inhibitor (50 nm each). 24 h after transfection, cells were treated with or without celastrol (1 μm) or Taxol (1 μm) for 24 h, followed by annexin V-FITC assays (lower panel) or Western blot analysis (upper panel). *, p < 0.05. B, same as A except that cells were transfected with control vector (1 μg) or miR-326 construct (1 μg). *, p < 0.05. C, Malme3M cells were transfected with the indicated siRNA (10 nm each). 24 h after transfection, cells were treated with celastrol (1 μm) or Taxol (1 μm) for 24 h. Cell lysates were subjected to caspase-3 activity assays (left panel). The indicated cancer cell line was treated with celastrol (1 μm) or Taxol (1 μm) for 24 h, followed by caspase-3 activity assays (right panel). **, p < 0.005; ***, p < 0.0005. D, Malme3M cells were transfected with control vector (1 μg) or miR-326 (1 μg). 24 h after transfection, cells were treated with celastrol (1 μm) or Taxol (1 μm) for 24 h, followed by caspase-3 activity assays (left panel). Malme3MR cells were transfected with the indicated inhibitor (50 nm each). 24 h after transfection, cells were treated with celastrol (1 μm) or Taxol (1 μm) for 24 h, followed by caspase-3 activity assays (right panel). *, p < 0.05; **, p < 0.005. Ctrl. Inh., control inhibitor.
miR-326 Enhances the Invasion and Migration Potential of Cancer Cells
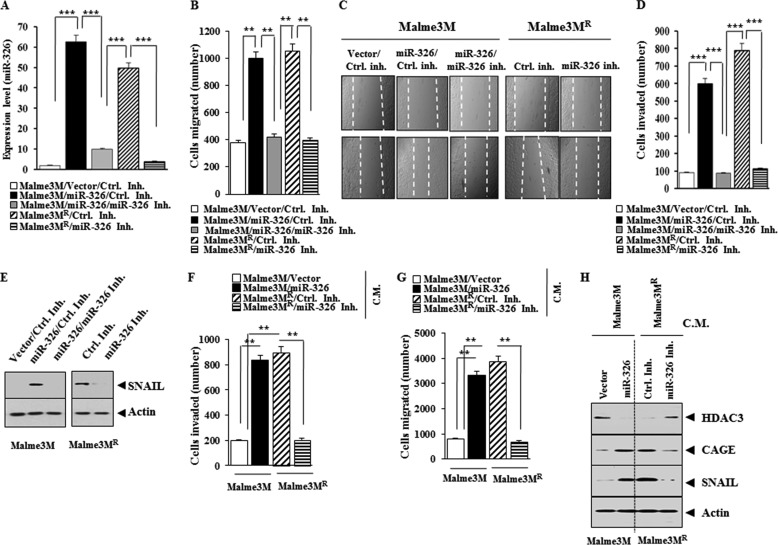
We examined the effect of miR-326 on the invasion and migration potential of cancer cells. The overexpression of miR-326 (Fig. 14A) enhances the migration (Fig. 14, B and C) and the invasion potential of Malme3M cells (Fig. 14D). miR-326 inhibitor decreases the migration (Fig. 14, B and C) and the invasion potential of Malme3MR cells (Fig. 14D). miR-326 specifically increases the expression of SNAIL in Malme3M cells, whereas miR-326 inhibitor decreases the expression of SNAIL in Malme3MR cells (Fig. 14E). The conditioned medium of Malme3M cells transfected with miR-326, when added to Malme3M cells, enhances the invasion (Fig. 14F) and migration potential (Fig. 14G) of Malme3M cells. The conditioned medium of Malme3MR cells transfected with the miR-326 inhibitor, when added to Malme3MR cells, decreases the invasion (Fig. 14F) and migration potential (Fig. 14G) of Malme3MR cells. The conditioned medium of Malme3M cells transfected with miR-326, when added to Malme3M cells, increases the expression of CAGE and SNAIL while decreasing the expression of HDAC3 (Fig. 14H). The conditioned medium of Malme3MR cells transfected with the miR-326 inhibitor, when added to Malme3MR cells, decreases the expression of CAGE and SNAIL while increasing the expression of HDAC3 (Fig. 14H). Taken together, these results suggest that resistance to anti-cancer drugs is correlated with the effect of miR-326 on the invasion and migration potential of cancer cells.
FIGURE 14.
miR-326 regulates the migration and invasion potential of cancer cells. A, indicated cancer cells were transfected with the indicated construct (1 μg) or inhibitor (50 nm). 48 h after transfection, qRT-PCR analysis was performed. B, same as A except that wound migration assay was performed. C, movement of cells into wound was shown for the indicated cancer cell lines at 0 and 48 h post-scratch (×40). Data were the means of three independent experiments, and the bars represent mean ± S.D. The broken lines indicate the boundary lines of scratch. D, same as B except that invasion assay was performed. ***, p < 0.0005. E, same as A except that Western blot analysis was performed. F, Malme3M or Malme3MR cells were transfected with the indicated construct (each at 1 μg) or inhibitor (50 nm each). 48 h after transfection, the conditioned medium was added to Malme3M or Malme3MR cells. The invasion potential of Malme3M or Malme3MR cells was determined by transwell assays. **, p < 0.005. C.M. denotes conditioned medium. G, same as F except that wound migration assays were performed. **, p < 0.005. H, conditioned medium obtained as in G was added to the Malme3M or Malme3MR cells. One hour after addition of the conditioned medium, Western blot analysis was performed. Ctrl. Inh., control inhibitor.
miR-326 Regulates the Metastatic Potential of Cancer Cells
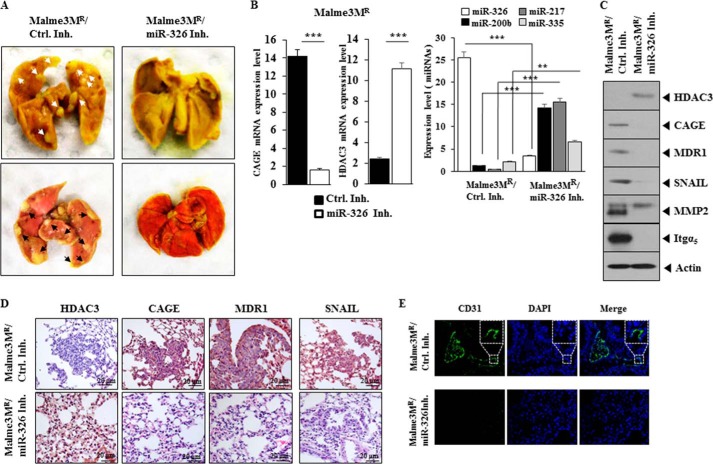
We next examined whether miR-326 would affect the metastatic potential of cancer cells. The in vivo injection of miR-326 inhibitor decreases the metastatic potential of Malme3MR cells (Fig. 15A). qRT-PCR analysis employing lung tumor tissue shows that miR-326 inhibitor increases the expression of HDAC3, miR-200b, miR-217, and miR-335 while decreasing the expression of CAGE (Fig. 15B). Western blot of lung tumor tissue lysates shows that miR-326 inhibitor decreases the expression of CAGE, SNAIL, MMP2, MDR1, and integrin α5 while increasing the expression of HDAC3 (Fig. 15C). Immunohistochemistry staining shows that miR-326 regulates the expression of HDAC3, CAGE, MDR1, and SNAIL (Fig. 15D). Immunohistochemistry staining shows that the miR-326 inhibitor decreases the angiogenic potential of Malme3MR cells, based on CD31 (PECAM-1) staining (Fig. 15E). This suggests that miR-326 regulates the recruitment of endothelial cells by Malme3MR cells. Taken together, these results suggest that miR-326 regulates the metastatic potential of cancer cells in a manner associated with the expression regulation of HDAC3 and CAGE.
FIGURE 15.
miR-326 regulates the metastatic potential of cancer cells. A, each experimental group consists of five athymic nude mice. Each figure shows a representative image of the mice in each experimental group. Control inhibitor (50 μm/kg) or miR-326 inhibitor (50 μm/kg) was intravenously injected five times over a total of 4 weeks. Arrows show the metastatic foci. The extent of lung metastases was quantified by staining with Bouin's solution. B, mRNAs isolated from lung tumor tissues were subjected to RT-PCR analysis (left panel). ***, p < 0.0005. miRNAs isolated from lung tumor tissues were subjected to qRT-PCR (right panel). **, p < 0.005; ***, p < 0.005. C, lung tumor tissue lysates isolated from mouse of each experimental group were subjected to Western blot analysis. D, immunohistochemistry staining of lung tumor tissue derived from Malme3MR cells treated with the indicated inhibitor was performed. Representative images from five animals from each experimental group are shown (magnification, ×400; Olympus). H&E staining was performed to check structural integrity. E, immunohistochemistry staining employing anti-CD31 was employed to determine the effect of miR-326 inhibitor on the angiogenic potential of Malme3MR cells. Representative images from five animals from each experimental group are shown (magnification, ×100; Olympus). DAPI staining was performed to stain nuclei. Ctrl. Inh., control inhibitor.
miR-326 Regulates the Tumorigenic Potential of Cancer Cells
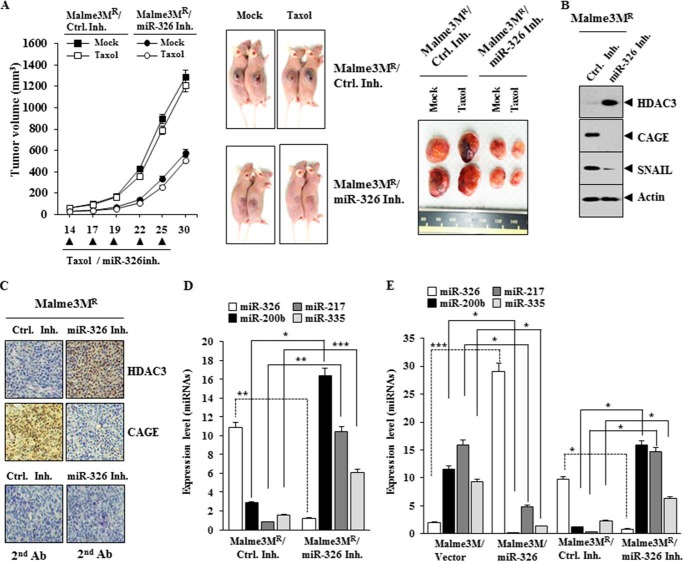
We examined whether anti-cancer drug resistance was related with the tumorigenic potential. miR-326 inhibitor exerts a negative effect on the tumorigenic potential of Malme3MR cells (Fig. 16A). This decreased tumorigenic potential by miR-326 inhibitor is associated with the increased expression of HDAC3 and the decreased expression of CAGE, SNAIL, MMP2, and integrin α5 (Fig. 16B). Immunohistochemistry staining also shows the regulatory role of miR-326 inhibitor on the expression of HDAC3 and CAGE (Fig. 16C). qRT-PCR analysis employing tumor tissue lysates shows that the miR-326 inhibitor increases the expression of miR-200b, miR-217, and miR-335 (Fig. 16D). The overexpression of miR-326 in Malme3M cells or the inhibition of miR-326 in Malme3MR cells shows that miR-326 indeed regulates the expression of miR-200b, miR-217, and miR-335 (Fig. 16E). Taken together, these results suggest that miR-326 regulates the tumorigenic potential of cancer cells in a manner associated with its regulation of multiple miRNAs and HDAC3.
FIGURE 16.
miR-326 regulates the tumorigenic potential of cancer cells. A, Malme3MR cells (1 × 10⁶) were injected into the dorsal flank area of athymic nude mice. Control inhibitor (40 μg/kg or 50 μm/kg) or miR-326 inhibitor (40 μg/kg or 50 μm/kg) was injected into each nude mouse after the tumor reached a certain size. Tumor volume was measured on the same day as injection of inhibitor. Five mice were used for the injection of each cell line. Each value represents an average obtained from five mice of each group. Data are expressed as mean ± S.D. B, tumor tissue lysates from each mouse of the experimental group were subjected to Western blot. C, immunohistochemistry staining of tumor tissue derived from Malme3MR cells treated with the indicated inhibitor was performed as described. Immunohistochemistry staining employing secondary antibody alone served as a negative control. Representative images from five animals from each experimental group are shown (magnification, ×400; Olympus). H&E staining was performed to check structural integrity. D, miRNAs isolated from tumor tissues were subjected to qRT-PCR analysis. *, p < 0.05; **, p < 0.005; ***, p < 0.0005. E, indicated cancer cells were transfected with the indicated construct (1 μg each) or inhibitor (50 nm each). 48 h after transfection, qRT-PCR analysis was performed. *, p < 0.05; ***, p < 0.0005. Ctrl. Inh., control inhibitor.
miR-326 Regulates the Tumor-induced Angiogenesis
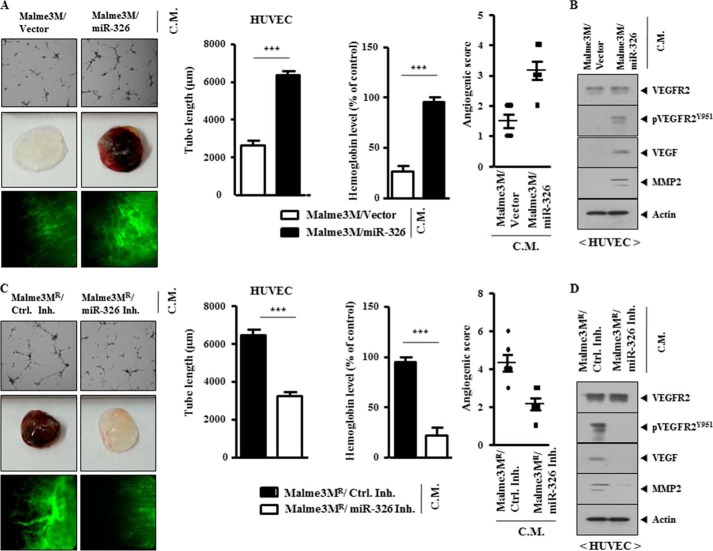
Tumor-induced angiogenesis involves new capillary growth from the existing vasculature. Tumor cells secrete VEGF, which in turn activates endothelia cells, and HDAC3 acts as a negative regulator of tumor-induced angiogenesis (35). This suggests that miR-326 would affect tumor-induced angiogenesis. The conditioned medium of Malme3M cells transfected with miR-326, but not with control vector, enhances the endothelial cell tube formation, when added to HUVECs (Fig. 17A). The conditioned medium of Malme3M cells transfected with miR-326, but not with control vector, enhances blood vessel formation when mixed with Matrigel for intravital microscopy (Fig. 17A). Matrigel plug assays also show that miR-326 enhances tumor-induced angiogenesis (Fig. 17A). The conditioned medium of Malme3M cells transfected with miR-326, but not with control vector, increases the expression of VEGF, MMP-2, and pVEGFRY951 in HUVECs (Fig. 17B). The conditioned medium of Malme3MR cells transfected with miR-326 inhibitor does not affect endothelial cell tube formation, when added to HUVECs (Fig. 17C). The conditioned medium of Malme3MR cells transfected with miR-326 inhibitor does not affect tumor-induced angiogenesis based on intravital microscopy and Matrigel plug assays (Fig. 17C). The conditioned medium of Malme3MR cells transfected with miR-326 inhibitor does not affect the expression of VEGF, MMP-2, or pVEGFRY951 in HUVECs (Fig. 17D). Taken together, these results suggest that miR-326 regulates the tumor-induced angiogenesis.
FIGURE 17.
miR-326 regulates the tumor-induced angiogenesis. A, Malme3M cells were transfected with the indicated construct (each at 1 μg). The conditioned medium obtained from each cell line was added to HUVECs for 8 h, followed by endothelial cell tube formation assays (upper panel). The conditioned medium was subjected to Matrigel plug assays as described (middle panel). Concentrated conditioned medium (10 μl) obtained from the indicated cancer cell line was mixed with 100 μl of Matrigel, and intravital microscopy was performed as described (bottom panel). ***, p < 0.0005. B, conditioned medium (C.M.) obtained from the indicated cells was added to HUVECs for 1 h, followed by Western blot analysis. C, same as A except that Malme3MR cells were transfected with the indicated inhibitor (50 nm each). ***, p < 0.0005. D, conditioned medium obtained from the indicated cells was added to HUVECs for 1 h, followed by Western blot analysis. Ctrl. Inh., control inhibitor.
DISCUSSION
Selective inhibition of HDAC3 protects beta cells from cytokine-induced apoptosis (36). In this study, we show that HDAC3 confers sensitivity to anti-cancer drugs in vitro and in vivo. It will be necessary to examine the effect of HDAC3 on the response to various anti-cancer drugs in other cancers besides hepatoma and melanoma.
The expression of HDAC1 and HDAC2 is higher in cancer cell lines resistant to anti-cancer drugs than in cancer cell lines sensitive to anti-cancer drugs (Fig. 1A). It is probable that HDAC1 and -2 may confer resistance to anti-cancer drugs. HDAC1 and -2 down-regulates the expression of E-cadherin (37), suggesting the relationship between epithelial-mesenchymal transition and anti-cancer drug resistance. It would be interesting to examine whether HDAC3 would affect the expression of HDAC1 and/or HDAC2.
SNAIL is involved in the Taxol resistance by up-regulating the expression of miR-125b through the SNAIL-activated Wnt/β-catenin/TCF4 axis (38). HDAC3 decreases the expression of SNAIL (Fig. 4G). It would be interesting to examine the effect of HDAC3 on the expression of miR-125b. The suppression or loss of miR-145 causes aberrant expression of HDAC2 and promotes hepatocellular tumorigenesis (39). It is probable that HDAC3 may induce the expression of miR-145 and thereby decrease the expression of HDAC2.
The effect of HDAC3 on the invasion and migration potential of cancer cells remains unknown. HDAC3 regulates the invasion (Fig. 4C) and migration potential of cancer cells (Fig. 4, E and F). These results suggest that the role of HDAC3 in anti-cancer drug resistance is closely related with its effect on the invasion and migration potential of cancer cells. It is reasonable that HDAC3 regulates the invasion and migration potential of cancer cells by forming a negative feedback loop with miR-125b.
Because miRNAs have the potential to repress mRNAs that encode transcription factors, which repress the same miRNAs, miRNAs are well suited to take part in the feedback regulatory loop (40). miR-22 itself is up-regulated by Akt and down-regulates PTEN levels (41). Feedback regulatory loop exists between miR-195 and MBD1 in neural stem cell differentiation (42). miRNA databases predict that miR-195 regulates the expression of cyclin D1 and VEGFA (Fig. 9B). Because CAGE functions downstream of miR-326 (Fig. 12A) and regulates the expression of cyclin D1 (33) and VEGFA (17), it is probable that miR-195 is involved in the anti-cancer drug resistance in association with the miR-326-HDAC3 feedback loop.
miR-193a represses the expression of multiple target genes such as AML1/ETO, DNMT3a, HDAC3, KIT, CCND1, and MDM2 directly (43). Database analyses also show that cyclin D1 is regulated by miR-193 (data not shown). Our results suggest that HDAC3 may regulate the expression of CAGE, cyclin D1, and VEGFA. It is probable that HDAC3 may increase the expression of miR-193, and it regulates the expression of CAGE, cyclin D1, and VEGFA.
miR-326 acts as tumor suppressor in gliomas by targeting Nin One-binding protein (44). The elevated levels of miR-326 in the mimic-transfected VP-16-resistant cell line, MCF-7/VP, down-regulates the expression of MRP-1 and sensitizes these cells to VP-16 and doxorubicin (45). miR-326 forms a feedback loop with Notch, and the overexpression of miR-326 reduces glioma cell tumorigenicity in vivo (46).
The overexpression of miR-200b reduces the expression of Notch1 in osteosarcoma cells lines (47). These reports suggest a close relationship between HDAC3 and Notch. In this study, we found that the expression of Notch1 is higher in SNU387R than in SNU387 cells.4 However, we do not see differential expression of Notch1 between Mame3MR and Malme3M cells.4 The overexpression of miR-326 increases the expression of Notch 1.4 The miR-326 inhibitor decreases the expression of Notch1 in SNU387R cells.4 ChIP assays show the binding of HDAC3 to the promoter sequences of Notch1 in SNU387 cells.4 This suggests the direct regulation of the expression of Notch1 by HDAC3.
Notch2 shows higher expression level in Malme3MR cells than in Malme3M cells.4 ChIP assays show the binding of HDAC3 to the promoter sequences of Notch2.4 These results suggest the role of Notch signaling in response to anti-cancer drugs.
The miR-326 promoter contains a binding site for YY1 (Fig. 12B). Reportedly, p300 and HDAC3 are recruited to the YY1-binding site of c-Myc to repress the expression of c-Myc. (48). Because HDAC3 binds to the YY1-binding site of the miR-326 promoter (Fig. 12C), it is reasonable that HDAC3 regulates the expression of miR-326 in association with YY1. It would be also interesting to examine whether miR-326 would form a positive feedback loop with c-Myc.
Recent findings suggest the involvement of miRNAs in chemo-resistance of cancer stem cells. The overexpression of miR-451 reduces chemo-resistance of cancer stem cells isolated from colon carcinoma cells (49). It would be interesting to examine the effects of miRNA-326 and HDAC3 on the ability of cancer stem cells isolated from anti-cancer drug-resistant cancer cells to self-renew and resist anti-cancer drugs.
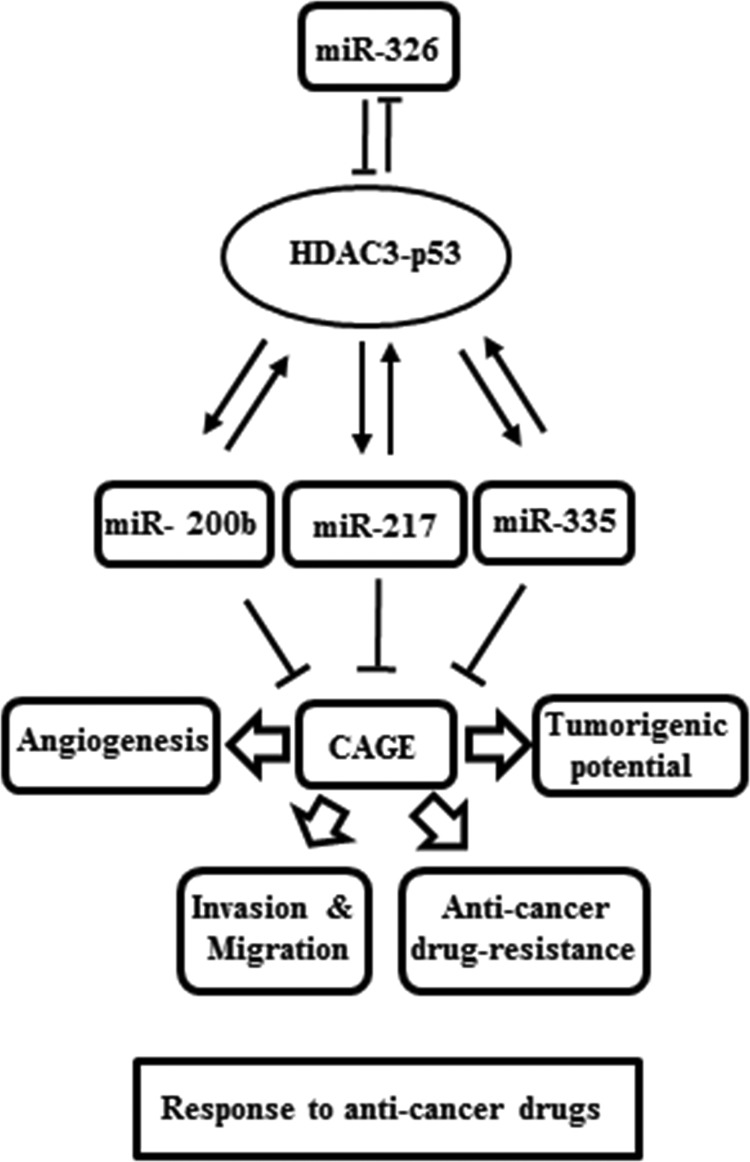
In this study, we provide the miR-326/HDAC3 axis as a novel regulator of the response to anti-cancer drugs (Fig. 18). We show miRNAs, such as miR-200b, miR-217, and miR-335, form a positive feedback loop with HDAC3 (Fig. 18). HDAC3 promoter sequences contain binding sites for various transcriptional regulators, such as SNAIL, YY1, and SP1 (personal observations). These miRNAs seem to exert indirect regulations on the expression of HDAC3 by negatively regulating the expression of these transcriptional regulators in Malme3M cells. HDAC3, in turn, binds to the promoter sequences of miR-326 to repress the expression of miR-326 in Malme3M cells. In Malme3MR cells, these transcriptional regulators would bind to the promoter sequences of HDAC3 to repress the expression of HDAC3. It would be interesting to identify more transcription factors that are regulated by these miRNAs. In conclusion, the up-regulation of HDAC3 by miR-326 inhibitor may serve as a clue for the development of anti-cancer therapeutics.
FIGURE 18.
Network of HDAC3-miRNAs involved in the regulation of the response to anti-cancer drugs.
This work was supported by National Research Foundation Grants 2012H1B8A2025495, 2014R1A2A2A01002448, and 2012R1A1A3009993, a grant from the BK21 Plus Program, and by National R&D Program for Cancer Control, Ministry for Health and Welfare, Republic of Korea Grant 1320160.
Y. Kim, H. Kim, H. Park, D. Park, H. Lee, Y. S. Lee, J. Choe, Y. M. Kim, and D. Jeoung, unpublished observations.
- HDAC
- histone deacetylase
- CAGE
- cancer-associated gene
- miRNA
- microRNA
- qRT-PCR
- quantitative real time-PCR
- HUVEC
- human umbilical vein endothelial cell
- MTT
- 3-(4,5-dimethylthiazol-2-yl)-2,5-diphenyltetrazolium bromide
- PARP
- poly(ADP-ribose) polymerase.
REFERENCES
- 1. Jin W., Liu Y., Xu S. G., Yin W. J., Li J. J., Yang J. M., Shao Z. M. (2010) UHRF1 inhibits MDR1 gene transcription and sensitizes breast cancer cells to anticancer drugs. Breast Cancer Res. Treat. 124, 39–48 [DOI] [PubMed] [Google Scholar]
- 2. To K. K., Polgar O., Huff L. M., Morisaki K., Bates S. E. (2008) Histone modifications at the ABCG2 promoter following treatment with histone deacetylase inhibitor mirror those in multidrug-resistant cells. Mol. Cancer Res. 6, 151–164 [DOI] [PMC free article] [PubMed] [Google Scholar]
- 3. Mahlknecht U., Emiliani S., Najfeld V., Young S., Verdin E. (1999) Genomic organization and chromosomal localization of the human histone deacetylase 3 gene. Genomics 56, 197–202 [DOI] [PubMed] [Google Scholar]
- 4. Li J., Wang J., Wang J., Nawaz Z., Liu J. M., Qin J., Wong J. (2000) Both corepressor proteins SMRT and N-CoR exist in large protein complexes containing HDAC3. EMBO J. 19, 4342–4350 [DOI] [PMC free article] [PubMed] [Google Scholar]
- 5. Zhang J., Kalkum M., Chait B. T., Roeder R. G. (2002) The N-CoR-HDAC3 nuclear receptor corepressor complex inhibits the JNK pathway through the integral subunit GPS2. Mol. Cell 9, 611–623 [DOI] [PubMed] [Google Scholar]
- 6. Chen L. F., Fischle W., Verdin E., Greene W. C. (2001) Duration of nuclear NF-κB action regulated by reversible acetylation. Science 293, 1653–1657 [DOI] [PubMed] [Google Scholar]
- 7. Mahlknecht U., Will J., Varin A., Hoelzer D., Herbein G. (2004) Histone deacetylase 3, a class I histone deacetylase, suppresses MAPK11-mediated activating transcription factor-2 activation and represses TNF gene expression. J. Immunol. 173, 3979–3990 [DOI] [PubMed] [Google Scholar]
- 8. Bardai F. H., D'Mello S. R. (2011) Selective toxicity by HDAC3 in neurons: regulation by Akt and GSK3β. J. Neurosci. 31, 1746–1751 [DOI] [PMC free article] [PubMed] [Google Scholar]
- 9. Uo T., Veenstra T. D., Morrison R. S. (2009) Histone deacetylase inhibitors prevent p53-dependent and p53-independent Bax-mediated neuronal apoptosis through two distinct mechanisms. J. Neurosci. 29, 2824–2832 [DOI] [PMC free article] [PubMed] [Google Scholar]
- 10. Kim H. C., Choi K. C., Choi H. K., Kang H. B., Kim M. J., Lee Y. H., Lee O. H., Lee J., Kim Y. J., Jun W., Jeong J. W., Yoon H. G. (2010) HDAC3 selectively represses CREB3-mediated transcription and migration of metastatic breast cancer cells. Cell. Mol. Life Sci. 67, 3499–3510 [DOI] [PMC free article] [PubMed] [Google Scholar]
- 11. Ott P. A., Chang J., Madden K., Kannan R., Muren C., Escano C., Cheng X., Shao Y., Mendoza S., Gandhi A., Liebes L., Pavlick A. C. (2013) Oblimersen in combination with temozolomide and albumin-bound paclitaxel in patients with advanced melanoma: a phase I trial. Cancer Chemother. Pharmacol. 71, 183–191 [DOI] [PubMed] [Google Scholar]
- 12. Chae S., Kim Y. B., Lee J. S., Cho H. (2012) Resistance to paclitaxel in hepatoma cells is related to static JNK activation and prohibition into entry of mitosis. Am. J. Physiol. Gastrointest. Liver Physiol. 302, G1016–G1024 [DOI] [PubMed] [Google Scholar]
- 13. Xu R., Nakano K., Iwasaki H., Kumagai M., Wakabayashi R., Yamasaki A., Suzuki H., Mibu R., Onishi H., Katano M. (2011) Dual blockade of phosphatidylinositol 3′-kinase and mitogen-activated protein kinase pathways overcomes paclitaxel-resistance in colorectal cancer. Cancer Lett. 306, 151–160 [DOI] [PubMed] [Google Scholar]
- 14. Xu R., Sato N., Yanai K., Akiyoshi T., Nagai S., Wada J., Koga K., Mibu R., Nakamura M., Katano M. (2009) Enhancement of paclitaxel-induced apoptosis by inhibition of mitogen-activated protein kinase pathway in colon cancer cells. Anticancer Res. 29, 261–270 [PubMed] [Google Scholar]
- 15. Calin G. A., Croce C. M. (2006) MicroRNA signatures in human cancers. Nat. Rev. Cancer 6, 857–866 [DOI] [PubMed] [Google Scholar]
- 16. Cheng W., Liu T., Wan X., Gao Y., Wang H. (2012) MicroRNA-199a targets CD44 to suppress the tumorigenicity and multidrug resistance of ovarian cancer-initiating cells. FEBS J. 279, 2047–2059 [DOI] [PubMed] [Google Scholar]
- 17. Chen Z., Ma T., Huang C., Zhang L., Lv X., Xu T., Hu T., Li J. (2013) miR-27a modulates the MDR1/P-glycoprotein expression by inhibiting FZD7/β-catenin pathway in hepatocellular carcinoma cells. Cell. Signal. 25, 2693–2701 [DOI] [PubMed] [Google Scholar]
- 18. Kim Y., Park D., Kim H., Choi M., Lee H., Lee Y. S., Choe J., Kim Y. M., Jeoung D. (2013) miR-200b and cancer/testis antigen CAGE form a feedback loop to regulate the invasion and tumorigenic and angiogenic responses of a cancer cell line to microtubule-targeting drugs. J. Biol. Chem. 288, 36502–36518 [DOI] [PMC free article] [PubMed] [Google Scholar]
- 19. Fabbri M., Garzon R., Cimmino A., Liu Z., Zanesi N., Callegari E., Liu S., Alder H., Costinean S., Fernandez-Cymering C., Volinia S., Guler G., Morrison C. D., Chan K. K., Marcucci G., Calin G. A., Huebner K., Croce C. M. (2007) MicroRNA-29 family reverts aberrant methylation in lung cancer by targeting DNA methyltransferases 3A and 3B. Proc. Natl. Acad. Sci. U.S.A. 104, 15805–15810 [DOI] [PMC free article] [PubMed] [Google Scholar]
- 20. Zhao J. J., Lin J., Lwin T., Yang H., Guo J., Kong W., Dessureault S., Moscinski L. C., Rezania D., Dalton W. S., Sotomayor E., Tao J., Cheng J. Q. (2010) microRNA expression profile and identification of miR-29 as a prognostic marker and pathogenetic factor by targeting CDK6 in mantle cell lymphoma. Blood 115, 2630–2639 [DOI] [PMC free article] [PubMed] [Google Scholar]
- 21. Yang H., Chen D., Cui Q. C., Yuan X., Dou Q. P. (2006) Celastrol, a triterpene extracted from the Chinese “Thunder of God Vine,” is a potent proteasome inhibitor and suppresses human prostate cancer growth in nude mice. Cancer Res. 66, 4758–4765 [DOI] [PubMed] [Google Scholar]
- 22. Kannaiyan R., Manu K. A., Chen L., Li F., Rajendran P., Subramaniam A., Lam P., Kumar A. P., Sethi G. (2011) Celastrol inhibits tumor cell proliferation and promotes apoptosis through the activation of c-Jun N-terminal kinase and suppression of PI3 K/Akt signaling pathways. Apoptosis 16, 1028–1041 [DOI] [PubMed] [Google Scholar]
- 23. Williams L. V., Veliceasa D., Vinokour E., Volpert O. V. (2013) miR-200b inhibits prostate cancer EMT, growth and metastasis. PLoS One 8, e83991. [DOI] [PMC free article] [PubMed] [Google Scholar]
- 24. Hummel R., Hussey D. J., Haier J. (2010) MicroRNAs: predictors and modifiers of chemo- and radiotherapy in different tumour types. Eur. J. Cancer 46, 298–311 [DOI] [PubMed] [Google Scholar]
- 25. Wang H., Li M., Zhang R., Wang Y., Zang W., Ma Y., Zhao G., Zhang G. (2013) Effect of miR-335 upregulation on the apoptosis and invasion of lung cancer cell A549 and H1299. Tumour Biol. 34, 3101–3109 [DOI] [PubMed] [Google Scholar]
- 26. Zhao W. G., Yu S. N., Lu Z. H., Ma Y. H., Gu Y. M., Chen J. (2010) The miR-217 microRNA functions as a potential tumor suppressor in pancreatic ductal adenocarcinoma by targeting KRAS. Carcinogenesis 31, 1726–1733 [DOI] [PubMed] [Google Scholar]
- 27. Scott G. K., Mattie M. D., Berger C. E., Benz S. C., Benz C. C. (2006) Rapid alteration of microRNA levels by histone deacetylase inhibition. Cancer Res. 66, 1277–1281 [DOI] [PubMed] [Google Scholar]
- 28. Zhang X., Zhao X., Fiskus W., Lin J., Lwin T., Rao R., Zhang Y., Chan J. C., Fu K., Marquez V. E., Chen-Kiang S., Moscinski L. C., Seto E., Dalton W. S., Wright K. L., Sotomayor E., Bhalla K., Tao J. (2012) Coordinated silencing of MYC-mediated miR-29 by HDAC3 and EZH2 as a therapeutic target of histone modification in aggressive B-Cell lymphomas. Cancer Cell 22, 506–523 [DOI] [PMC free article] [PubMed] [Google Scholar] [Retracted]
- 29. Suzuki H. I., Yamagata K., Sugimoto K., Iwamoto T., Kato S., Miyazono K. (2009) Modulation of microRNA processing by p53. Nature 460, 529–533 [DOI] [PubMed] [Google Scholar]
- 30. Zhang X., Wan G., Berger F. G., He X., Lu X. (2011) The ATM kinase induces microRNA biogenesis in the DNA damage response. Mol. Cell 41, 371–383 [DOI] [PMC free article] [PubMed] [Google Scholar]
- 31. Scarola M., Schoeftner S., Schneider C., Benetti R. (2010) miR-335 directly targets Rb1 (pRb/p105) in a proximal connection to p53-dependent stress response. Cancer Res. 70, 6925–6933 [DOI] [PubMed] [Google Scholar]
- 32. Tan Z., Jiang H., Wu Y., Xie L., Dai W., Tang H., Tang S. (2014) miR-185 is an independent prognosis factor and suppresses tumor metastasis in gastric cancer. Mol. Cell. Biochem. 386, 223–231 [DOI] [PubMed] [Google Scholar]
- 33. Por E., Byun H. J., Lee E. J., Lim J. H., Jung S. Y., Park I., Kim Y. M., Jeoung D. I., Lee H. (2010) The cancer/testis antigen CAGE with oncogenic potential stimulates cell proliferation by up-regulating cyclins D1 and E in an AP1- and E2F-dependent manner. J. Biol. Chem. 285, 14475–14485 [DOI] [PMC free article] [PubMed] [Google Scholar]
- 34. Kim Y., Park H., Park D., Lee Y. S., Choe J., Hahn J. H., Lee H., Kim Y. M., Jeoung D. (2010) Cancer/testis antigen CAGE exerts negative regulation on p53 expression through HDAC2 and confers resistance to anti-cancer drugs. J. Biol. Chem. 285, 25957–25968 [DOI] [PMC free article] [PubMed] [Google Scholar]
- 35. Park D., Park H., Kim Y., Kim H., Jeoung D. (2014) HDAC3 acts as a negative regulator of angiogenesis. BMB Rep. 47, 227–232 [DOI] [PMC free article] [PubMed] [Google Scholar]
- 36. El-Khoury V., Breuzard G., Fourré N., Dufer J. (2007) The histone deacetylase inhibitor trichostatin A downregulates human MDR1 (ABCB1) gene expression by a transcription-dependent mechanism in a drug-resistant small cell lung carcinoma cell line model. Br. J. Cancer 97, 562–573 [DOI] [PMC free article] [PubMed] [Google Scholar]
- 37. Aghdassi A., Sendler M., Guenther A., Mayerle J., Behn C. O., Heidecke C. D., Friess H., Büchler M., Evert M., Lerch M. M., Weiss F. U. (2012) Recruitment of histone deacetylases HDAC1 and HDAC2 by the transcriptional repressor ZEB1 downregulates E-cadherin expression in pancreatic cancer. Gut 61, 439–448 [DOI] [PubMed] [Google Scholar]
- 38. Liu Z., Liu H., Desai S., Schmitt D. C., Zhou M., Khong H. T., Klos K. S., McClellan S., Fodstad O., Tan M. (2013) miR-125b functions as a key mediator for snail-induced stem cell propagation and chemoresistance. J. Biol. Chem. 288, 4334–4345 [DOI] [PMC free article] [PubMed] [Google Scholar]
- 39. Noh J. H., Chang Y. G., Kim M. G., Jung K. H., Kim J. K., Bae H. J., Eun J. W., Shen Q., Kim S. J., Kwon S. H., Park W. S., Lee J. Y., Nam S. W. (2013) MiR-145 functions as a tumor suppressor by directly targeting histone deacetylase 2 in liver cancer. Cancer Lett. 335, 455–462 [DOI] [PubMed] [Google Scholar]
- 40. Kim J., Inoue K., Ishii J., Vanti W. B., Voronov S. V., Murchison E., Hannon G., Abeliovich A. (2007) A MicroRNA feedback circuit in midbrain dopamine neurons. Science 317, 1220–1224 [DOI] [PMC free article] [PubMed] [Google Scholar]
- 41. Bar N., Dikstein R. (2010) miR-22 forms a regulatory loop in PTEN/AKT pathway and modulates signaling kinetics. PLoS One 5, e10859. [DOI] [PMC free article] [PubMed] [Google Scholar]
- 42. Liu C., Teng Z. Q., McQuate A. L., Jobe E. M., Christ C. C., von Hoyningen-Huene S. J., Reyes M. D., Polich E. D., Xing Y., Li Y., Guo W., Zhao X. (2013) An epigenetic feedback regulatory loop involving microRNA-195 and MBD1 governs neural stem cell differentiation. PLoS One 8, e51436. [DOI] [PMC free article] [PubMed] [Google Scholar]
- 43. Li Y., Gao L., Luo X., Wang L., Gao X., Wang W., Sun J., Dou L., Li J., Xu C., Wang L., Zhou M., Jiang M., Zhou J., Caligiuri M. A., Nervi C., Bloomfield C. D., Marcucci G., Yu L. (2013) Epigenetic silencing of microRNA-193a contributes to leukemogenesis in t(8;21) acute myeloid leukemia by activating the PTEN/PI3K signal pathway. Blood 121, 499–509 [DOI] [PubMed] [Google Scholar]
- 44. Zhou J., Xu T., Yan Y., Qin R., Wang H., Zhang X., Huang Y., Wang Y., Lu Y., Fu D., Chen J. (2013) MicroRNA-326 Functions as a Tumor Suppressor in Glioma by Targeting the Nin One Binding Protein (NOB1). PLoS One 8, e68469. [DOI] [PMC free article] [PubMed] [Google Scholar]
- 45. Liang Z., Wu H., Xia J., Li Y., Zhang Y., Huang K., Wagar N., Yoon Y., Cho H. T., Scala S., Shim H. (2010) Involvement of miR-326 in chemotherapy resistance of breast cancer through modulating expression of multidrug resistance-associated protein 1. Biochem. Pharmacol. 79, 817–824 [DOI] [PubMed] [Google Scholar]
- 46. Kefas B., Comeau L., Floyd D. H., Seleverstov O., Godlewski J., Schmittgen T., Jiang J., diPierro C. G., Li Y., Chiocca E. A., Lee J., Fine H., Abounader R., Lawler S., Purow B. (2009) The neuronal microRNA miR-326 acts in a feedback loop with notch and has therapeutic potential against brain tumors. J. Neurosci. 29, 15161–15168 [DOI] [PMC free article] [PubMed] [Google Scholar]
- 47. Li Y., Zhang J., Zhang L., Si M., Yin H., Li J. (2013) Diallyl trisulfide inhibits proliferation, invasion and angiogenesis of osteosarcoma cells by switching on suppressor microRNAs and inactivating of Notch-1 signaling. Carcinogenesis 34, 1601–1610 [DOI] [PubMed] [Google Scholar]
- 48. Sankar N., Baluchamy S., Kadeppagari R. K., Singhal G., Weitzman S., Thimmapaya B. (2008) p300 provides a corepressor function by cooperating with YY1 and HDAC3 to repress c-Myc. Oncogene 27, 5717–5728 [DOI] [PubMed] [Google Scholar]
- 49. Bitarte N., Bandres E., Boni V., Zarate R., Rodriguez J., Gonzalez-Huarriz M., Lopez I., Javier Sola J., Alonso M. M., Fortes P., Garcia-Foncillas J. (2011) MicroRNA-451 is involved in the self-renewal, tumorigenicity, and chemoresistance of colorectal cancer stem cells. Stem Cells 29, 1661–1671 [DOI] [PubMed] [Google Scholar]


