

Abstract
High prevalence of hepatitis c virus (HCV) infection in some areas necessitates more investigations of the causative factors. Genetic factors that cause disruption in operation or secretion of interleukin 10 (IL-10), an anti-inflammatory cytokine, may play a role in the intensity of the disease. The aim of this study was to evaluate genetic variants of IL-10 gene polymorphisms in HCV patients and their relationship with HCV disease.
Fifty HCV patients and the same number of healthy individuals who were referred to hepatitis clinic in Mashhad, northeast of Iran, were recruited. Genomic DNA was extracted from whole blood. Genotyping for IL-10 gene promoter polymorphisms in three positions (−1082 G>A, −819 C>T and −592 C>A) was conducted by amplification refractory mutation system-polymerase chain reaction. Haplotype analysis was performed using PHASE software.
In a recessive analysis model of the −1082 position (GG vs. AA+AG), GG genotype was more common in patients (adjusted p=0.02; OR=4.66 [95% CI 1.31–16.35]). Also, ATA haplotype was more prevalent in HCV patients (adjusted p=0.061; OR=1.87 [95% CI 0.97–3.61]). Also, ATC/GCA diplotypes were more common in controls (adjusted p=0.002; adjusted OR=0.27 [95% CI 0.11–0.63]). Although we found a possible association between IL-10 promoter polymorphisms and HCV infection, certain genotypes or diplotypes may confer a higher risk or susceptibility for developing HCV infection.
Introduction
Hepatitis C virus (HCV) infection is a major cause of chronic hepatitis (7) and approximately 170 million people worldwide are infected with HCV (2,6). Infection of HCV stimulates a wide range of innate and acquired immune responses. Some 70–80% of patients with chronic HCV infection may also develop hepatic chronic disease, including fibrosis, hepatic cirrhosis, and hepatocellular carcinoma (24–26). Dysfunction of several factors such as cytokines has an important role in immune system deficiency. In addition, it is more evident that there is a close relationship between cytokine genes polymorphisms and HCV infection (12,20). Interleukin 10 (IL-10) is a potent anti-inflammatory and immune regulatory cytokine that is produced in liver cells, including hepatic, cooper, sinusoidal endothelial, hepatic satellite cells, monocytes, and macrophages (9,13,22,23,33). Chronic HCV infection is associated with fluctuation of alanine aminotransferase (ALT) levels, an indicator of liver disease in infected patients (12,19). IL-10, which plays an important role in the immune system against viral infection, is polymorphic and its allele frequencies have varied in different studies (4,8,32). Due to the importance of IL-10 in immune pathway, any defects in this gene can possibly make a person more susceptible to HCV infection. Therefore, the study of genetic changes, including mutations in the IL-10 gene, may help to dissect the genetic susceptibility of HCV infection (16). The IL-10 gene contains five exons on chromosomes 1q31 and q32, and several polymorphic sites have also been identified in the promoter region (14,15,29). Predominantly, single nucleotide polymorphisms (SNPs) at positions −1082 G>A, −819 C>T, and −592 C>A are the most common polymorphisms in the IL-10 gene promoter (29). Several studies on functional characteristics of these three SNPs of IL-10 gene showed their association with the production of different cytokines (11,18). A “G to A” nucleotide change at the −1082 position in the IL-10 gene may directly affect the production of IL-10. Additionally, HCV patients with polymorphisms (−1082 G>A, −819 C>T, and −592 C>A) and high production of IL-10 appear to have a poor response to interferon-alpha therapy (15,31). It is believed that genetic background has an important role in infection and thus progression of HCV. Since the polymorphisms may differ depending on the racial background, we tried to evaluate this hypothesis in our study. In the present study, we analyzed the genotype and haplotype distribution of the IL-10 promoter SNPs (−1082 G>A, −819 C>T, and −592 C>A) in HCV patients compared to a control group.
Materials and Methods
Study population
After ethical committee approval and obtaining informed written consent from the participants, 10 mL blood samples were collected from all participants, including patients who were suffering from chronic HCV (n=50) and 50 healthy control individuals whose test for HCV infection with enzyme-linked immunosorbent assay kits (Delaware Biotech, Inc., Wilmington, DE) was negative. HCV viral load test was carried out by real time polymerase chain reaction (PCR).
All factors that could affect the risk of HCV infection, including drug and alcohol addiction, transfusion, HIV infection, and tattoos, were considered to be included in the final analysis, when results were adjusted for confounders (Table 1).
Table 1.
Demographic and Risk Factors in Hepatitis C Virus Patients and Healthy Groups
| Characteristics | Patients | Controls | p-Value |
|---|---|---|---|
| M:F | 42:8 | 18:33 | <0.05 |
| Age (years; mean±SD) | 41.49±10.61 | 36.87±13.11 | 0.06 |
| Addiction | 21 (42%) | — | <0.05 |
| Alcohol | 19 (38%) | 1 (2%) | <0.05 |
| Transfusion | 14 (28%) | 9 (17%) | 0.06 |
| Tattoo | 11 (22%) | — | <0.05 |
| ALT (U/L, mean±SD) | 33.18±35.54 | 23.66±16.10 | 0.7 |
| Increased ALT* | 12 (24%) | 11 (22%) | 0.3 |
ALT, alanine aminotransferase; U/L, unit per liter. *>41 U/L for men and >31 U/L for women.
Biochemical assay
ALT levels were evaluated for both groups (patients and controls) with the Pars Azmoon kit (Pars Azmoon, Inc., Tehran, Iran). According to the kit instructions, ALT levels at 37°C of <31 U/L for women and <41 U/L for men were considered normal.
DNA extraction
Ten mL of whole blood was collected in EDTA tubes. Genomic DNA was extracted from the blood using a genomic DNA extraction Kit (GeNet Bio, Daejeon, Korea).
Genotyping technique
Genotyping for IL-10 gene promoter polymorphisms in three positions (−1082 G>A, −819 C>T, and −592 C>A) was conducted using the amplification refractory mutation system-polymerase chain reaction (ARMS-PCR) method. For this purpose, two allele-specific forward and one generic reverse primer were designed for each position. Forward allele specific primers for IL-10 −1082 G (5′-CTA CTA AGG CTT CTT TGG GAG-3′) and for IL-10 −1082 A (5′-ACT ACT AAG GCT TCT TTG GGA A-3′) were separately mixed to a reverse primer (5′-CAG TGC CAA CTG AGA ATT TGG-3′), and the PCR experiment was performed under the following conditions: 95°C for 3 min, followed by 35 cycles at 95°C for 45 sec, 58°C for 40 sec, 72°C for 1 min, and finally a 7 min extension at 72°C. PCR (96-well thermal cycler; Applied Biosystems) amplification for the IL-10 −1082 G>A position was performed in a 20 μL reaction volume containing 40 ng genomic DNA, 1.5 mM each dNTPs, 2.5 mM MgCl2, 1 μL of 10 pmol each primer, and 0.4 units of Taq polymerase (GeNet Bio) in 1× reaction buffer. The product size for the IL-10 −1082 G>A position was 258 bp. For the IL-10 −819 C and −592 C polymorphism positions, product sizes were 233 bp. Sequences of specific primers for these SNPs were as follows: for the IL-10 −819 T forward primer: 5′-CCC TTG TAC AGG TGA TGT AAC-3′; for the IL-10 position −592 A forward primer: 5′-ACC CTT GTA CAG GTG ATGT AAT-3′; and for the reverse primer for the two positions: 5′-AGG ATG TGT TCC AGG CTC CT-3′). All conditions including PCR program set-up for IL-10 −819 C>T and −592 C>A polymorphisms were performed with similar condition to the PCR program for the −1082 position. Finally, the amplified products were analyzed on 2% agarose gel.
HCV genotyping
HCV genotyping was performed according to the method described by Afshari et al. and Ohno et al. (3,17).
Statistical analysis
Statistical analysis was conducted using IBM SPSS Statistics for Windows v21 (IBM Corp., Armonk, NY). For determination of normality, data were assessed with the Kolmogorov–Smirnov test. Allele frequency and polymorphism distribution in the three positions of the IL-10 gene for patients and healthy controls were analyzed using the chi-square test. PHASE software v2.1 (28) was used for haplotype and diplotype analysis. A p-value of<0.05 was considered significant.
Results
Demographic data showed that in the patients group, 84% were males, with an age range of 16–61 years. In the control group, 36% were male, with an age range of 18–65 years. The mean age of patients and controls was 41.49±10.61 years (±SD) and 36.87±13.11 years (±SD) respectively (Table 1).
All samples were tested for Hardy–Weinberg equilibrium at each position. Genotypes of cases followed the Hardy–Weinberg equilibrium (p>0.05). However, a deviation was observed in controls. To rule out any genotyping errors, 5% of samples were re-genotyped and no technical issues were found. Positions −592 and −819 were tightly in linkage disequilibrium (LD); “A” at position −592 with “T” at position −819; Table 2). The genotypes and allele frequencies for the three SNPs are shown in Table 3.
Table 2.
Linkage Disequilibrium Map of IL-10 Gene Markers
| 1082 | 592 | 819 | |
|---|---|---|---|
| 1082 | 0.011 | 0.011 | |
| 592 | 0.011 | 1.000 | |
| 819 | 0.011 | 1.000 |
Table 3.
Distribution of Genotypes Frequency in Three Positions of IL-10 Gene Polymorphisms
| Control (n=50) N (%) | Patients (n=50) N (%) | p-Value crude | OR crude [95% CI] | p-Value adjusted* | OR adjusted*[95% CI] | |
|---|---|---|---|---|---|---|
| IL-10 locus 1082 G/A | ||||||
| AA | 6 (12) | 15 (30) | Ref | |||
| GG | 5 (10) | 15 (30) | 0.80 | 0.83 [0.23–3.33] | 0.8 | 0.83 [0.23–3.33] |
| GA | 39 (78) | 20 (40) | 0.04 | 4.87 [1.64–14.49] | 0.02 | 5.38 [1.28–22.57] |
| GG | 5 (10) | 15 (30) | 0.04 | 2.88 [1.06–7.81] | 0.02 | 4.66 [1.31–16.35] |
| AA/GA | 45 (90) | 35 (70) | ||||
| Allele frequency | ||||||
| G | 49 (49) | 50 (50) | 0.89 | 0.96 [0.55–1.67] | 0.89 | 0.96 [0.55–1.67] |
| A | 51 (51) | 50 (50) | ||||
| IL-10 locus −819 C/T(−592 C/A) | ||||||
| TT(AA) | 10 (19.6) | 16 (32) | Ref | |||
| CC | 6 (11.8) | 5 (10) | 0.37 | 1.92 [0.46–7.99] | 0.37 | 1.92 [0.46–7.99] |
| CT(CA) | 35 (68.6) | 29 (58) | 0.17 | 1.93 [0.76–4.90] | 0.17 | 1.93 [0.76–4.90] |
| TT(AA) | 10 (19.6) | 16 (35) | 0.16 | 1.93 [0.78–4.80] | 0.16 | 1.93 [0.78–4.80] |
| CC+CT(CA) | 41 (80.4) | 34 (68) | ||||
| Allele frequency | ||||||
| T(A) | 55 (55) | 61 (61) | 0.31 | 1.34 [0.76–2.34] | 0.31 | 1.34 [0.76–2.34] |
| C | 47 (47) | 39 (39) | ||||
Adjusted based on transfusion, tattoo, and addiction.
Genotype and allele frequency
We found higher frequencies of G allele and GG genotypes at position −1082 IL-10 genes in patients (G 50%; GG 30%) compared to healthy controls (G 49%; GG 10%; Table 3). On the other hand, genotype GA was dominant in the control group (78% for controls and 40% for patients; p=0.02; OR=5.38 [95% CI 1.28–22.57]). After adjusting for confounders, including transfusion, tattoo, and addiction (drug and alcohol), which might influence the risk of HCV infection, there was still a significant difference between cases and controls (adjusted p=0.02; OR=5.38 [95% CI 1.28–22.57]).
In a recessive model analysis (GG vs. AA+GA), GG was significantly higher in patients (30%) compared to controls (10%; p=0.04; OR=1.06–7.81 [95% CI 1.06–7.81]). This difference remained significant even after adjustment for confounders (adjusted p=0.02; OR=4.66 [95% CI 1.31–16.35]).
The distribution pattern of −592 and −819 CC genotypes was not significant for either HCV patients or controls (10% vs. 11.8% respectively). In addition, TT and AA genotypes at −592, −819 loci respectively were more frequent in patients compared to controls (32% vs. 19.6%). CT and CA were more frequent in controls (58% vs. 68.6% respectively). However, these differences were not statistically significant (p>0.05; Table 3).
Haplotype and diplotype distribution
In the present study, haplotype and diplotype analysis in three positions of the IL-10 gene (−592, −819, −1082) were conducted using PHASE software (Table 4). The results showed that the ATA haplotype had a higher frequency in patients compared to controls (27.3% vs. 16.7%). After adjusting for confounders, this difference remained nonsignificant (adjusted p=0.061; OR=1.87 [95% CI 0.97–3.61]). In addition, we analyzed the diplotype frequencies in patients and controls (Table 4). The ATC/GCA diplotype with a frequency of 48.1% in controls and 20% in patients was significantly different, and remained significant after adjusting for confounders (adjusted p=0.002; OR=0.27 [95% CI 0.11–0.63]).
Table 4.
Distribution of Haplotype and Diplotype Frequencies in Patient and Control Groups
| Locus | Controls (n=50) N (%) | Patients (n=50) N (%) | p-Value adjusted* | OR adjusted* | 95% CI |
|---|---|---|---|---|---|
| Haplotypes | |||||
| ATA | 18 (16.7) | 30 (27.3) | 0.061 | 1.87 | [0.97–3.61] |
| ATC | 43 (39.8) | 40 (36.4) | 0.6 | 0.86 | [0.5–1.49] |
| GCC | 10 (9.3) | 15 (13.6) | 0.31 | 1.55 | [0.66–3.61] |
| GCA | 37 (34.3) | 25 (22.7) | 0.61 | 0.56 | [0.31–1.03] |
| Diplotypes | |||||
| ATA/ATA | 1 (1.9) | 5 (9.1) | 0.13 | 5.3 | [0.59–46.95] |
| ATA/ATC | 12 (22.2) | 10 (18.2) | 0.60 | 0.78 | [0.30–1.99] |
| ATA/GCA | 4 (7.4) | 10 (18.2) | 0.10 | 2.77 | [0.81–9.47] |
| ATC/GCC | 5 (9.3) | 9 (16.4) | 0.27 | 1.91 | [0.59–6.14] |
| ATC/GCA | 26 (48.1) | 11 (20) | 0.002 | 0.27 | [0.11–0.63] |
| GCA/GCC | 5 (9.3) | 4 (7.3) | 0.71 | 0.77 | [0.19–3.03] |
Adjusted based on transfusion, tattoo, and addiction.
HCV genotypes
Genotypes of the HCV were only available for 60% of studied patients. HCV genotype frequencies were as follows: 1a: 37.5%, 3a: 34.44%, 1a/1b: 17.24%/3.44% of patients had type 2 virus genotypes. Figure 1 shows the relationship between genotypes of hepatitis virus and some risk factors.
FIG. 1.
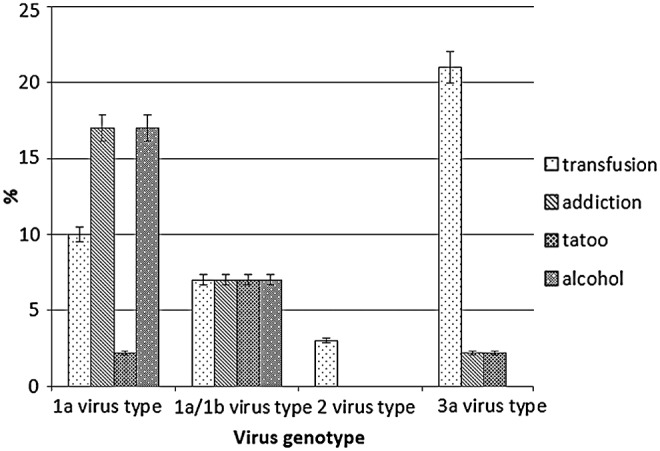
Relationship between virus genotype and common risk factors (alcohol, drug addiction, transfusion, and tattoo) in hepatitis C virus patients.
All participants in the present study were tested for HIV infection in which the results were negative for both patients and healthy controls. In the patients group, 42% of participants were drug addicted, while no addiction background was found in healthy controls. There was 38% alcohol addiction in the patients group compared to controls, which had only one case (2%). Twenty-eight percent of patients and 17% of controls had a history of blood transfusion. Other risk factors are listed in Table 1.
Biochemical results (ALT assay)
Biochemical test results showed an elevated level of ALT up to 33.18±35.54 U/L in patients, while in controls it was 23.66±16.10 U/L. However, the difference was not statistically significant. About 76% of patients and 78% of controls had ALT levels in the normal range. Figure 2 shows the proportion of risk factors in individuals (patients and controls) who had abnormal ALT levels.
FIG. 2.
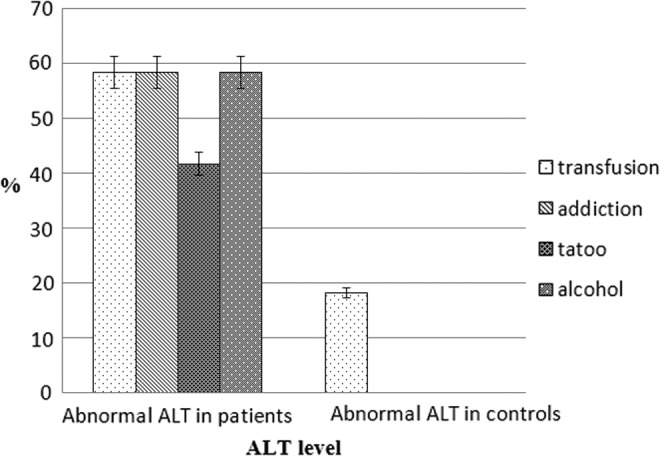
ALT levels in presence of common risk factors. ALT, alanine aminotransferase.
Discussion
Many studies on HCV infections have been conducted. The results of these studies indicate that genetic polymorphisms may influence hepatitis. Therefore, it is important to dissect the genetic backgrounds that may infer susceptibility to HCV infection or its outcome (4,7,16,27). Our results showed that the ATA haplotype was more common in patients. So there might be an association between this genetic variation and susceptibility to HCV infection. Nevertheless, this needs to be confirmed in a larger sample size.
Many studies with cytokine gene polymorphism have been conducted. For example, Kusumoto et al. studied IL-10 gene polymorphism in HCV patients, and their results showed that at three different positions of the IL-10 gene (−1082, −592, and −819), genotypes AA, CC, and CC were more common respectively (2). Part of our results was in agreement with their study, and we showed that the AA genotype in the −1082 position of IL-10 had a higher frequency in patients, but it was different for positions −592 and −819 of IL-10, where AA and TT genotypes were more prevalent in our patients. However, these differences were not significant.
Some studies showed similar results (4,10,21). For example, in two studies performed by Barrett et al. and Tso et al. (30) on IL-10 gene polymorphisms at these three loci, it was found that the most common diplotype in their studied patients was GCC/GCC. In addition, Tso et al. found that only 5% of cases had the GCC haplotype, whereas in our patients, the frequency of the GCC haplotype was 13.6%. Yee et al. divided patients into two groups of virologically sustained responders and nonresponders (NR), but we did not divide our patients on such a basis. They showed that the most frequent genotypes at positions −819 and −592 were CC and CA respectively.
Bouzgarrou et al. reported that among 100 patients with HCV infection, genotype GA at position −1082 had the highest frequency (43%) (5), but we did not find this in our patients. Abbas et al. worked with HCV patients with type 3 virus genotype and studied the relationship between three different SNPs at IL-10 gene positions (−1082, −592, and −819), and reported that GA in the −1082 position and AC in positions −592 and −819 were more common in their patients (1). Hence, the results were different from our study.
Our findings suggested a possible association between HCV infection and interleukin-10 polymorphisms (−1082 G>A, −819 C>T, and −592 C>A; p<0.05), when the results were analyzed in a recessive model (Table 2). On the other hand, the existence of the ATA haplotype with a higher frequency in HCV individuals (adjusted p=0.061) showed that people with this haplotype could be more at risk of HCV infection. In control groups, ATC/GCA diplotype (adjusted p=0.002) with a higher frequency may suggest that individuals with such genotype (diplotype) could have some degree of protection against HCV infection. The results remained significant even after adjusting for confounders (Table 3). However, a larger sample size and replication in other populations are required to confirm such association.
We acknowledge that, predictably, a notable number of patients had drug and alcohol addictions. However, we took this on board and adjusted our results for confounders. We also found that patients with history of transfusion were infected dominantly with 3a virus genotype (20.68%). In contrast, alcoholism and addiction in patients with type 1a virus were more prevalent. Considering that the required sample size was obtained using standard statistical formulas, we conducted our study on the recruited patients. However, it is suggested that future studies use a larger sample size, as this will help with better interpretation of the data and provide more reliable results.
Acknowledgments
This study was supported financially by Mashhad University of Medical Sciences, Mashhad, Iran (Grant number: 901012).
Author Disclosure Statement
No competing financial interests exist.
References
- 1.Abbas Z, Moatter T, Hussainy A, and Jafri W. Effect of cytokine gene polymorphism on histological activity index, viral load and response to treatment in patients with chronic hepatitis C genotype 3. World J Gastroenterol 2005;11:6656–6661 [DOI] [PMC free article] [PubMed] [Google Scholar]
- 2.Aborsangaya KB, Dembinski I, Khatkar S, Alphonse MP, Nickerson P, and Rempel JD. Impact of aboriginal ethnicity on HCV core-induced IL-10 synthesis: interaction with IL-10 gene polymorphisms. Hepatology 2007;45:623–630 [DOI] [PubMed] [Google Scholar]
- 3.Afshari R, Nomani H, Riyahi Zaniani F, et al. Genotype distribution of hepatitis C virus in Khorasan Razavi Province, Iran. Turk J Med Sci 2014;44. [DOI] [PubMed] [Google Scholar]
- 4.Barrett S, Collins M, Kenny C, Ryan E, Keane CO, and Crowe J. Polymorphisms in tumour necrosis factor-alpha, transforming growth factor-beta, interleukin-10, interleukin-6, interferon-gamma, and outcome of hepatitis C virus infection. J Med Virol 2003;71:212–218 [DOI] [PubMed] [Google Scholar]
- 5.Bouzgarrou N, Hassen E, Farhat K, et al. Combined analysis of interferon-gamma and interleukin-10 gene polymorphisms and chronic hepatitis C severity. Hum Immunol 2009;70:230–236 [DOI] [PubMed] [Google Scholar]
- 6.Chen SL, and Morgan TR. The natural history of hepatitis C virus (HCV) infection. Int J Med Sci 2006;3:47–52 [DOI] [PMC free article] [PubMed] [Google Scholar]
- 7.Edwards-Smith CJ, Jonsson JR, Purdie DM, Bansal A, Shorthouse C, and Powell EE. Interleukin-10 promoter polymorphism predicts initial response of chronic hepatitis C to interferon alfa. Hepatology 1999;30:526–530 [DOI] [PubMed] [Google Scholar]
- 8.Garidou L, Heydari S, Gossa S, and McGavern DB. Therapeutic blockade of transforming growth factor beta fails to promote clearance of a persistent viral infection. J Virol 2012;86:7060–7071 [DOI] [PMC free article] [PubMed] [Google Scholar]
- 9.Grove J, Daly AK, Bassendine MF, Gilvarry E, and Day CP. Interleukin 10 promoter region polymorphisms and susceptibility to advanced alcoholic liver disease. Gut 2000;46:540–545 [DOI] [PMC free article] [PubMed] [Google Scholar]
- 10.Kerr JR, McCoy M, Burke B, Mattey DL, Pravica V, and Hutchinson IV. Cytokine gene polymorphisms associated with symptomatic parvovirus B19 infection. J Clin Pathol 2003;56:725–727 [DOI] [PMC free article] [PubMed] [Google Scholar]
- 11.Knapp S, Hennig BJ, Frodsham AJ, et al. Interleukin-10 promoter polymorphisms and the outcome of hepatitis C virus infection. Immunogenetics 2003;55:362–369 [DOI] [PubMed] [Google Scholar]
- 12.Kusumoto K, Uto H, Hayashi K, et al. Interleukin-10 or tumor necrosis factor-alpha polymorphisms and the natural course of hepatitis C virus infection in a hyperendemic area of Japan. Cytokine 2006;34:24–31 [DOI] [PubMed] [Google Scholar]
- 13.Ladero JM, Fernandez-Arquero M, Tudela JI, et al. Single nucleotide polymorphisms and microsatellite alleles of tumor necrosis factor alpha and interleukin-10 genes and the risk of advanced chronic alcoholic liver disease. Liver 2002;22:245–251 [DOI] [PubMed] [Google Scholar]
- 14.Lio D, Caruso C, Di Stefano R, et al. IL-10 and TNF-alpha polymorphisms and the recovery from HCV infection. Hum Immunol 2003;64:674–680 [DOI] [PubMed] [Google Scholar]
- 15.Mangia A, Santoro R, Piattelli M, et al. IL-10 haplotypes as possible predictors of spontaneous clearance of HCV infection. Cytokine 2004;25:103–109 [DOI] [PubMed] [Google Scholar]
- 16.Morgan TR, Lambrecht RW, Bonkovsky HL, et al. DNA polymorphisms and response to treatment in patients with chronic hepatitis C: results from the HALT-C trial. J Hepatol 2008;49:548–556 [DOI] [PMC free article] [PubMed] [Google Scholar]
- 17.Ohno O, Mizokami M, Wu RR, et al. New hepatitis C virus (HCV) genotyping system that allows for identification of HCV genotypes 1a, 1b, 2a, 2b, 3a, 3b, 4, 5a, and 6a. J Clin Microbiol 1997;35:201–207 [DOI] [PMC free article] [PubMed] [Google Scholar]
- 18.Oleksyk TK, Thio CL, Truelove AL, et al. Single nucleotide polymorphisms and haplotypes in the IL10 region associated with HCV clearance. Genes Immun 2005;6:347–357 [DOI] [PubMed] [Google Scholar]
- 19.Paladino N, Fainboim H, Theiler G, et al. Gender susceptibility to chronic hepatitis C virus infection associated with interleukin 10 promoter polymorphism. J Virol 2006;80:9144–9150 [DOI] [PMC free article] [PubMed] [Google Scholar]
- 20.Pasha HF, Radwan MI, Hagrass HA, Tantawy EA, and Emara MH. Cytokines genes polymorphisms in chronic hepatitis C: impact on susceptibility to infection and response to therapy. Cytokine 2013;61:478–484 [DOI] [PubMed] [Google Scholar]
- 21.Perrey C, Pravica V, Sinnott PJ, and Hutchinson IV. Genotyping for polymorphisms in interferon-gamma, interleukin-10, transforming growth factor-beta 1 and tumour necrosis factor-alpha genes: a technical report. Transpl Immunol 1998;6:193–197 [DOI] [PubMed] [Google Scholar]
- 22.Persico M, Capasso M, Persico E, et al. Interleukin-10 −1082 GG polymorphism influences the occurrence and the clinical characteristics of hepatitis C virus infection. J Hepatol 2006;45:779–785 [DOI] [PubMed] [Google Scholar]
- 23.Ramos JA, Silva R, Hoffmann L, et al. Association of IL-10, IL-4, and IL-28B gene polymorphisms with spontaneous clearance of hepatitis C virus in a population from Rio de Janeiro. BMC Res Notes 2012;5:508. [DOI] [PMC free article] [PubMed] [Google Scholar]
- 24.Rehermann B. Hepatitis C virus versus innate and adaptive immune responses: a tale of coevolution and coexistence. J Clin Invest 2009;119:1745–1754 [DOI] [PMC free article] [PubMed] [Google Scholar]
- 25.Rehermann B, and Nascimbeni M. Immunology of hepatitis B virus and hepatitis C virus infection. Nat Rev Immunol 2005;5:215–229 [DOI] [PubMed] [Google Scholar]
- 26.Seeff LB. Natural history of chronic hepatitis C. Hepatology 2002;36:S35–46 [DOI] [PubMed] [Google Scholar]
- 27.Shin HD, Park BL, Kim LH, et al. Interleukin 10 haplotype associated with increased risk of hepatocellular carcinoma. Hum Mol Genet 2003;12:901–906 [DOI] [PubMed] [Google Scholar]
- 28.Stephens M, Smith NJ, and Donnelly P. A new statistical method for haplotype reconstruction from population data. Am J Hum Genet 2001;68:978–989 [DOI] [PMC free article] [PubMed] [Google Scholar]
- 29.Swiatek BJ. Is interleukin-10 gene polymorphism a predictive marker in HCV infection? Cytokine Growth Factor Rev 2012;23:47–59 [DOI] [PubMed] [Google Scholar]
- 30.Tso HW, Ip WK, Chong WP, Tam CM, Chiang AK, and Lau YL. Association of interferon gamma and interleukin 10 genes with tuberculosis in Hong Kong Chinese. Genes Immun 2005;6:358–363 [DOI] [PubMed] [Google Scholar]
- 31.Vidigal PG, Germer JJ, and Zein NN. Polymorphisms in the interleukin-10, tumor necrosis factor-alpha, and transforming growth factor-beta1 genes in chronic hepatitis C patients treated with interferon and ribavirin. J Hepatol 2002;36:271–277 [DOI] [PubMed] [Google Scholar]
- 32.Wilson EB, and Brooks DG. The role of IL-10 in regulating immunity to persistent viral infections. Curr Top Microbiol Immunol 2011;350:39–65 [DOI] [PMC free article] [PubMed] [Google Scholar]
- 33.Yee LJ, Tang J, Gibson AW, Kimberly R, Van Leeuwen DJ, and Kaslow RA. Interleukin 10 polymorphisms as predictors of sustained response in antiviral therapy for chronic hepatitis C infection. Hepatology 2001;33:708–712 [DOI] [PubMed] [Google Scholar]