

Abstract
The Oxford Classification of IgA Nephropathy (IgAN) identified mesangial hypercellularity (M), endocapillary proliferation (E), segmental glomerulosclerosis (S), and tubular atrophy/interstitial fibrosis (T) as independent predictors of outcome. Whether it applies to individuals excluded from the original study and how therapy influences the predictive value of pathology remain uncertain. The VALIGA study examined 1147 patients from 13 European countries that encompassed the whole spectrum of IgAN. Over a median follow-up of 4.7 years, 86% received renin–angiotensin system blockade and 42% glucocorticoid/immunosuppressive drugs. M, S, and T lesions independently predicted the loss of estimated glomerular filtration rate (eGFR) and a lower renal survival. Their value was also assessed in patients not represented in the Oxford cohort. In individuals with eGFR less than 30 ml/min per 1.73 m2, the M and T lesions independently predicted a poor survival. In those with proteinuria under 0.5 g/day, both M and E lesions were associated with a rise in proteinuria to 1 or 2 g/day or more. The addition of M, S, and T lesions to clinical variables significantly enhanced the ability to predict progression only in those who did not receive immunosuppression (net reclassification index 11.5%). The VALIGA study provides a validation of the Oxford classification in a large European cohort of IgAN patients across the whole spectrum of the disease. The independent predictive value of pathology MEST score is reduced by glucocorticoid/immunosuppressive therapy.
Keywords: glomerular diseases, IgA nephropathy, progression of chronic renal failure, proteinuria, renal pathology, risk factors
IgA nephropathy (IgAN) is the most common glomerulonephritis in the world, being particularly frequent in Asia, Australia, and Europe.1 Although large multicenter cohorts of patients have been investigated in China,2 data from Europe have been mostly limited to single-center studies.3, 4, 5 Therefore, this collaborative study aimed to create a large European database of patients with IgAN to include clinical, laboratory, and histological data followed over a prolonged time frame.
The study was initially aimed to validate the Oxford Classification of IgAN in a European cohort (VALIGA). The Oxford Classification identified four pathological features (mesangial hypercellularity M, endocapillary hypercellularity E, segmental glomerulosclerosis S, and tubular atrophy/interstitial fibrosis T, resulting in a MEST score) that predicted renal outcome independently of clinical indicators at the time of renal biopsy and during follow-up.6, 7 These findings were valid both in adults and children.8 The limited number of patients (265 cases) and their heterogeneous origin (from 11 countries in four continents) indicated a need for validation in other cohorts. Several validation studies have addressed this (reviewed in Roberts9); however, most of the studies have serious limitations of either small cohort size or clinical features, which were likely to confound the results.10, 11, 12, 13, 14, 15, 16, 17, 18, 19 The inclusion criteria of the Oxford study, ⩾0.5 g/day initial proteinuria, ⩾30 ml/min per 1.73 m2 estimated glomerular filtration rate (eGFR) at renal biopsy, and ⩾1 year available follow-up were chosen to ensure that a sufficient number of hard outcome events occurred within a limited follow-up. This enabled the independent value of pathology to be tested, avoiding overrepresentation of individuals with advanced scarring and excluding rare forms of IgAN with rapidly progressive course that might add excess heterogeneity. By design, the Oxford study did not include the whole spectrum of cases encountered in clinical practice. It could not address, for instance, the great proportion of the IgAN population presenting with normal renal function and minimal proteinuria, a common scenario where the need for renal biopsy is still debated. Similarly, the opposite end of the spectrum was not included—that is, patients with low GFR who may be expected to show irreversible scarring at renal biopsy, likely beyond response to immunosuppressive treatment, and at a point where evaluation of risks against benefits may cast doubts on renal biopsy need. Last, the diverse ethnic origin of the Oxford cohort made the impact of ethnicity difficult to assess. We therefore took advantage of the large European collaboration provided by the Immunonephrology Working Group of the ERA-EDTA to investigate whether the Oxford classification is valid and applies across the spectrum of IgAN disease presentation and diverse management.
The VALIGA study includes 1147 patients from 13 European Countries with unrestricted criteria at entry, except biopsy-proven primary IgAN and adequate histology material available for review. This produced the largest single cohort reported in the worldwide literature of patients with IgAN. It was designed to address whether the Oxford pathology indicators continue to have independent predictive value, across the full clinical spectrum of IgAN disease and despite different therapeutic approaches.
RESULTS
Clinical features at presentation and during follow-up
VALIGA reports data on 1147 patients with primary IgAN (Table 1) from 55 centers in 13 Countries (Supplementary Figure 1S and 2S online). All patients were resident in Europe, and 97.5% were Caucasian. Patients' mean age was 36±16 years, 174 (15%) were children, and 73% were male. At renal biopsy, the mean eGFR was 75±34 ml/min per 1.73 m2. Patients belonged mostly to stages 1, 2, and 3 chronic kidney disease (CKD; 33, 30 and 28% respectively), whereas 9% were in stage 4 or stage 5. Median proteinuria at renal biopsy was 1.3 (interquartile range, IQ 0.6–2.6) g/day; 20% of patients had mild proteinuria <0.5 g/day, 20% had proteinuria ⩾0.5 and <1 g/day, 39% had proteinuria ⩾1 and <3 g/day, and 21% had proteinuria ⩾3 g/day. The mean arterial pressure (MAP) was 98±13 mm Hg, and 65% of the patients were hypertensive and/or receiving antihypertensive medications.
Table 1. Baseline characteristics of the study cohort of 1147 patients with IgA nephropathy (IgAN).
| Total number | 1147 |
|---|---|
| Age (years) | 36±16 |
| Pediatric subjects (% <18 years old) | 15 |
| Male (%) | 73 |
| Ethnicity (% Caucasian/African/Asian/other) | 97.5/0.5/0.5/1.5 |
| eGFR (ml/min per 1.73m2) | 73±30 |
| CKD stage 1 or 2*, 3, 4, 5 (%) | 60, 28, 7, 2 |
| MAP (mm Hg) | 98±13 |
| SBP (mm Hg) | 131±23 |
| DBP (mm Hg) | 81±12 |
| Hypertensive subjects (%) | 65 |
| Proteinuria (g/day) | 1.3 (0.6–2.6) |
| Proteinuria g/day (%)<0.5, ⩾0.5 <1, ⩾1 <3, ⩾3 | 20, 20, 39, 21 |
| Before biopsy immunosuppressive treatments | 10 |
| Before biopsy nonimmunosuppressive treatments | |
| Prior tonsillectomy (%) | 4 |
| Prior RASB (%) | 39 |
Abbreviations: CKD, chronic kidney disease; DBP, diastolic blood pressure; eGFR, estimated glomerular filtration rate; MAP, mean arterial blood pressure; SBP, systolic blood pressure.
Results are expressed as mean±s.d., median (interquartile range), or percent. Hypertensive patients and proteinuria units: see Materials and Methods and definitions. RASB: renin–angiotensin system blockade by angiotensin-converting enzyme inhibitors and/or angiotensin receptors blockers.
CKD stages 1 and 2 were grouped in one only category owing to inaccuracy of MDRD measure of eGFR in stages 1 and 2.
Before renal biopsy, 39% of VALIGA patients had received renin–angiotensin system blockade (RASB) and 10% glucocorticoids and/or other immunosuppressive drugs.
Patients were followed up for a median of 4.7 (IQ, 2.4–7.9) years (Table 2). Time-average (TA) MAP was 96±9 mm Hg. The median number of antihypertensive medications received during follow-up was 1.0 (IQ 0.7–2.0); 86% of patients received RASB. TA proteinuria was 0.8 (IQ 0.4–1.6) g/day. During follow-up, 43% of patients received oral glucocorticoids, 16% received intravenous ‘pulse' methylprednisolone, and 13% received fish oil; 4% of patients underwent tonsillectomy.
Table 2. Follow-up data and clinical outcome of IgAN patients enrolled.
| Follow-up data | |
|---|---|
| Duration of follow-up: median (IQ; years) | 4.7 (2.4–7.9) |
| TA-MAP (mm Hg) | 96±9 |
| TA-SBP (mm Hg) | 129±14 |
| TA-DBP (mm Hg) | 79±8 |
| Median number of antihypertensive drugs | 1.0 (0.8–2.0) |
| TA proteinuria (g/day) | 0.8 (0.4–1.6) |
| TA proteinuria <0.5, ⩾0.5 <1, ⩾1 <1.5, ⩾1.5 <2, ⩾2 (%) | 29, 28, 25, 9, 19 |
| Immunosuppression | |
| Oral corticosteroids (%) | 43 |
| Intravenous ‘pulse' methylprednisolone (%) | 16 |
| Other immunosuppression (%) | 16 |
| Any immunosuppression (%) | 46 |
| Nonimmunosuppressive treatments | |
| RASB (%) | 86 |
| Fish oil (%) | 13 |
| Tonsillectomy (%) | 5 |
| Clinical outcome data | |
| Rate of decline in renal function (ml/min per 1.73 m2/year) | −1.8±7.5 |
| 50% decrease in eGFR (%) | 14 |
| ESRD (<15 ml/min per 1.73 m2) (%) | 12 |
| 50% decrease in eGFR or ESRD (%) | 16 |
Abbreviations: DBP, diastolic blood pressure; eGFR, estimated glomerular filtration rate; ESRD, end-stage renal disease; IgAN, IgA nephropathy; MAP, mean arterial blood pressure; RASB, renin–angiotensin system blockade; SBP, systolic blood pressure; TA, time average (see text for definition).
Results are expressed by mean±s.d., median (interquartile range), or percent as appropriate. Means and medians are time-averaged (see Materials and Methods).
The rate of decline in renal function was 1.8±7.5 ml/min per 1.73 m2/year. End-stage renal disease (ESRD) developed in 135 patients (12%) (Table 2). The renal function survival from the combined end point of 50% reduction in eGFR or ESRD was 74% at 10 years and was significantly better in children than in adults (83% compared with 73%, P<0.001).
A significant association was observed between data at renal biopsy (eGFR, MAP, proteinuria), during follow-up (TA-MAP and TA-proteinuria), and the outcomes (data not shown). Notably, in the VALIGA cohort, TA proteinuria <0.5 g/day was a significant marker of better outcome than follow-up proteinuria between 0.5 and 1.0 g/day (Figure 1).
Figure 1.

Predictive value in kidney survival* of time-average proteinuria. *Combined end point of 50% decrease in estimated glomerular filtration rate (eGFR) and/or end-stage renal disease (ESRD). All comparisons were statistically significant (P<0.05). Time-average proteinuria <0.5 g/day vs. 0.5–0.9 g/day: P<0.001. Time-average proteinuria 0.5–0.9 g/day vs. 1.0–1.4 g/day: P=0.001. Time-average proteinuria 1.0–1.4 g/day vs. 1.5–1.9 g/day: P=0.04.
Central pathology review and clinicopathological correlations
Twenty-eight percent of renal biopsies showed diffuse mesangial hypercellularity (M1), 11% showed endocapillary hypercellularity (E1), 70% showed segmental glomerulosclerosis (S1), and 21% showed tubular atrophy/interstitial fibrosis (T1 or T2). As T2 lesions were infrequent (3.6%), T2 and T1 lesions were combined to increase the statistical power. Arterial intimal thickening was detected in 28% of biopsies. Only 11% showed cellular/fibrocellular crescents and 7% showed necrosis, without a significant association between these two features.
The frequency of MEST scores varied according to particular clinical settings at renal biopsy—for example, in patients with advanced CKD, and according to the level of baseline proteinuria (Figure 2).
Figure 2.

MEST score distribution in the VALIGA cohort of patients with IgA nephropathy (IgAN). The whole cohort (A); patients with advanced chronic kidney disease (estimated glomerular filtration rate <30 ml/min per 1.73m2) (B); patients with proteinuria <0.5 g/day (C), ⩾0.5, and <1 g/day (D); patients with proteinuria ⩾1 and <3 g/day (E); and patients with proteinuria >3 g/day (F). Renal biopsies were scored according to Oxford classification: mesangial score >0.5 (M1), any endocapillary hypercellularity (E1), any segmental sclerosis (S1), tubular atrophy, and interstitial fibrosis (T1 and T2), arterial intimal thickening (present), any crescent (present).
M, S, and T scores were strongly associated with proteinuria, MAP, and eGFR at the time of biopsy (Supplementary Table 1S online). E score was associated with proteinuria only (P<0.002).
Correlations between pathology lesions and outcome
Within the VALIGA cohort, the value of the MEST score to predict the rate of renal function decline, as well as survival without ESRD, or 50% reduction in initial GFR was verified (Table 3). The exception was the E lesion, which did not predict any of the outcomes when addressing the entire cohort. In particular, the E lesion was not predictive in the subgroup that did not receive immunosuppression, as it was in the original study. Table 3 shows the univariate and multivariate results for the M, S, and T lesions using either linear regression (rate of renal function decline) or Cox regression (survival from a combined event). All univariate and multivariate comparisons were significant, except for the multivariate value of S using linear regression (although significant using the survival model) and the multivariate value of M using survival (although significant using the linear model). The effect sizes of pathology findings were reduced after adjustment for clinical variables (for example, the hazard ratios (HRs) for the S and T lesions fell from 4.1 and 5.6 to 1.8 and 2.6, respectively).
Table 3. Correlations between pathological features and outcomes.
|
Rate of renal function decline |
Survival from renal failure or 50% drop in eGFR |
|||
|---|---|---|---|---|
| Univariate (ml/min per 1.73 m2/year) | Multivariate ß (s.d.)a | Univariate hazard ratio (95% CI) | Multivariate hazard ratio (95% CI)a | |
| Mesangial proliferation | ||||
| M0 | −1.29±7.49 | 1 | 1 | |
| M1 | −3.02±7.32 | −0.9 (0.5) | 2.3 (1.7–3.0) | 1.3 (0.9–1.7) |
| P<0.001 | P=0.04 | P<0.001 | P=0.12 | |
| Segmental glomerulosclerosis | ||||
| S0 | −1.15±5.46 | 1 | 1 | |
| S1 | −2.03±8.18 | −0.1 (0.5) | 4.1 (2.6–6.5) | 1.8 (1.1–2.9) |
| P=0.03 | P=0.85 | P<0.001 | P=0.02 | |
| Tubular atrophy/interstitial fibrosis | ||||
| T0 | −1.36±7.29 | 1 | 1 | |
| T1–2 | −3.28±7.97 | −1.4 (0.6) | 5.6 (4.2–7.5) | 2.6 (1.8–3.6) |
| P<0.001 | P=0.01 | P<0.001 | <0.001 | |
Abbreviations: CI, confidence interval; eGFR, estimated glomerular filtration rate.
Mesangial score >0.5 (M1), any endocapillary hypercellularity (E1), any segmental sclerosis (S1), tubular atrophy, and interstitial fibrosis (T1 and T2).
Multivariate models are adjusted for initial eGFR, follow-up blood pressure, and proteinuria.
Subgroup of patients with minimal proteinuria at renal biopsy
The VALIGA cohort included 219 patients with IgAN and initial proteinuria <0.5 g/day, a subgroup not included in the original Oxford study (Supplementary Table 2S online). At the time of renal biopsy, the mean age of these patients was 32±17 years and 27% were children. Initial eGFR was 90±26 ml/min per 1.73 m2. All MEST lesions were significantly less frequent in this subgroup compared with the remaining cohort: M1 (15%), E1 (5%), S1 (50%), and T1/2 (6% Figure 2). Initial and follow-up MAP values were lower than the whole group. Immunosuppression and RASB were given to 21 and 71% of these patients, respectively. Their rate of progression was −1.2±6.6 ml/min per 1.73 m2/year, and only 5% reached the combined outcome of 50% reduction in renal function and/or ESRD. The only significant MEST score predicting this outcome at univariate analysis was endocapillary proliferation (E1); P=0.04, HR 5.2 (1.1–25.9). No MEST score predicted renal outcome in multivariate analysis, even when age was included in the multivariate model.
In this cohort of patients with initial low proteinuria, we calculated the risk of developing higher levels of proteinuria during the follow-up as a surrogate end point. Both M and E scores significantly influenced progression to levels of proteinuria ⩾1 and ⩾2g/day (Figure 3). Mesangial hypercellularity was significantly associated with the development of proteinuria ⩾1g/day, P=0.012, HR 2.5 (1.2–5.1), and proteinuria ⩾2g/day, P=0.01, HR 4.1 (1.4–12.0). Endocapillary hypercellularity was significantly associated with the development of proteinuria ⩾1 g/day, P=0.018, HR 2.8 (1.2–6.8), and proteinuria ⩾2 g/day, P=0.029, HR 4.2 (1.2–15.0). The HR of developing proteinuria ⩾1 and ⩾2 g/day, with either M1 or E1, adjusted for MAP and RASB were 2.3 (1.3–4.0), P=0.004, and 3.5 (1.5–8.4), P=0.005, respectively.
Figure 3.

Impact of M and E scores on surrogate marker of kidney survival in low-grade proteinuria categories*. *Measured as change in grade of proteinuria from <0.5 to ⩾1 g/day (left panel) and to ⩾2 g/day (right panel) in patients with IgAN and mesangial hypercellularity (M1) or endocapillary hypercellularity (E1), compared with those without these lesions (M0 and E0). The hazard ratios (HRs) of developing proteinuria ⩾1 and ⩾2 g/day, with either M1 or E1, adjusted for mean arterial blood pressure (MAP) and the use of renin–angiotensin system (RAS) blockers, were 2.3 (1.3–4.0), P=0.004, and 3.5 (1.5–8.4), P=0.005, respectively.
Subgroup of patients with reduced renal function (<30 ml/min per 1.73 m2) at renal biopsy
The VALIGA cohort included 99 patients who were not included in the original Oxford study because of a low initial eGFR (Supplementary Table 3S online). Their age at biopsy was 49±16 years, which was significantly higher than the cohort mean (P<0.001). They presented with a greater initial proteinuria (2.4 g/day) and MAP (108±16 mm Hg) and displayed M1, S1, and T1-2 lesions more frequently compared with those with an initial eGFR ⩾30 ml/min per 1.73 m2, being detected in 41, 92, and 77% of the cases, respectively (Figure 1). Only T1–2 correlated with proteinuria at renal biopsy in this group (P=0.04).
These individuals had a higher blood pressure during follow-up despite receiving more antihypertensive drugs compared with the rest of the cohort (P<0.001). RASB was used in almost all patients (91%). Immunosuppressive drugs were also used more frequently (60% vs. 44%, P=0.004). The clinical outcome of patients with eGFR <30 ml/min per 1.73 m2 was significantly worse than in the remaining patients, with a survival from a combined event of only 50% at 5 years as opposed to 90% (P<0.001).
M1 and T1–2 were associated with a lower survival from a combined event using univariate analysis. This significance was maintained in a multivariate model including five variables (S and E were excluded, as only eight patients presented with S0 and 11 with E1) and adjusted for initial eGFR, TA-MAP, and TA-proteinuria: M1 was associated with an HR of a combined event of 2.3 (1.2–4.2), P=0.009. Results did not change when age was included in the multivariate model.
Correlations between pathology and outcome in patients with or without glucocorticorticoid/immunosuppressive therapy
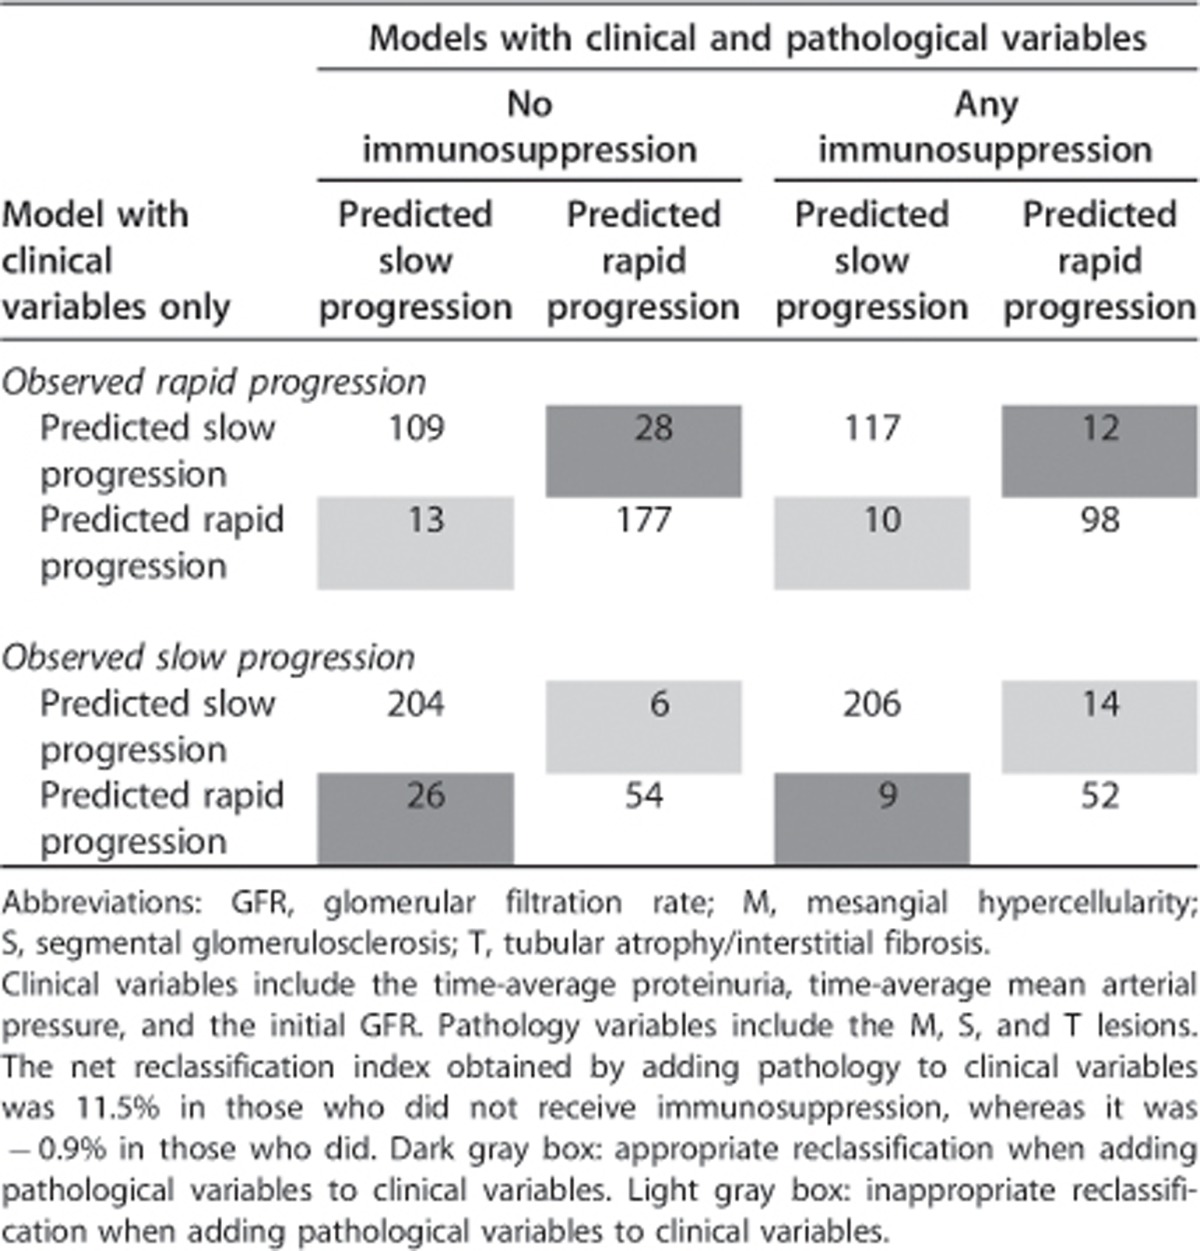
In the VALIGA cohort, 523 patients (46%) received glucocorticoid/immunosuppressive therapy and 622 (54%) did not. Those who received such treatment had a lower initial eGFR (70±32 vs. 76±29 ml/min per 1.73 m2, P=0.002) and higher initial proteinuria (1.9, IQ 1.0–3.5 vs. 0.9, IQ 0.4–1.9 g/day, P<0.001). Otherwise, they had similar age, sex, ethnicity, and MAP (data not shown). However, individuals who received immunosuppression also had a greater prevalence of MEST lesions (M1, 32% E1, 13% S1, 78%, and T1/2, 25%) compared with untreated individuals (M1, 24% E1, 9% S1, 63% and T1–2 18%, P<0.05 for all comparisons). The net reclassification index obtained by adding pathology to clinical variables was 11.5% (Table 4, P<0.001) in those who did not receive immunosuppression, whereas it was −0.9% (P=0.72) in those who did. To further address the impact of glucocorticoid/immunosuppressive therapy on the predictive value of pathology, we derived ROC curves using clinical, pathological, and clinicopathological models in treated and untreated individuals separately (Supplementary Figure 3S online). The areas under the curve in those without steroid/immunosuppressive therapy were 0.65, 0.72, and 0.75 with logistic models using pathology (M, S, T) or clinical (initial eGFR, TA-MAP, and TA proteinuria) variables, or both, respectively. In those who received immunosuppression, the areas under the curve were 0.57, 0.68, and 0.69, respectively. Hence, the added value of pathology was evident in those who did not receive glucocorticoid/immunosuppressive treatment, as the predictive value of pathology was reduced in those treated by immunosuppressive therapy.
Table 4. Net reclassification index using pathology in addition to clinical variables.
DISCUSSION
The VALIGA collaborative study has provided the largest reported cohort of patients with IgAN, unique in that the clinical and pathology data of the enrolled patients were categorized according to common criteria and centrally reviewed. The 1147 patients with IgAN represent the full spectrum of clinical presentations of this common but still challenging renal disease, encompassing, as in real clinical practice, its variety in age, histologic renal damage, renal function, proteinuria, blood pressure, and treatments. These patients were followed up for an average of 4.7 years, which is a reasonable duration, given their multicenter and international origin, thus providing a sufficient follow-up period to analyze renal functional decline and clinical outcomes.
The VALIGA cohort does not depict the ‘natural history' of IgAN, but rather the ‘nowadays history' of this disease in Europe, as a large majority of patients were treated with RASB, and almost half of them were treated with steroid/immunosuppressive therapy. Moreover, almost 40% of patients had received RASB and 10% received corticosteroids before the renal biopsy. Early European randomized controlled trials in IgAN showed benefits of RASB,20, 21 corticosteroids,22, 23, 24 and immunosuppressants,25 leading to the widespread use of these drugs in Europe, particularly in proteinuric cases, commonly considered at risk for progression.26 Even taking into account patient selection bias, it is clear that the functional decline in the VALIGA cohort is slower than that reported in previous European studies,27, 28 presumably at least in part because most of those patients did not receive RASB or immunosuppressive treatments. The VALIGA data set thus provided the opportunity to explore the renal pathology risk factors of IgAN across the full clinical spectrum of disease and under current management practices.
In the VALIGA cohort, mesangial hypercellularity, segmental sclerosis, and tubular atrophy/interstitial fibrosis were confirmed to have a predictive value independent of clinical data at renal biopsy and follow-up. Hence, the MST criteria were fully validated. As expected, histological signs of chronic and irreversible damage had the strongest association with unfavorable outcome; however, features of active renal disease also showed significant predictive value.
Endocapillary hypercellularity, observed in only 11% of patients, did not independently predict clinical outcome in the whole cohort. This was the same finding as in the Oxford Classification study,6 as well as in a multicenter North American study.12 In the latter two, there was an interaction of endocapillary hypercellularity with steroid/immunosuppressive therapy; however, this was not the case in the VALIGA cohort. A number of factors may influence this point. The frequency of endocapillary hypercellularity was significantly associated with proteinuria at renal biopsy and was found to be a risk factor for progression in patients with low proteinuria (<0.5 g/day), suggesting that endocapillary hypercellularity may have a particular prognostic value in early phases of IgAN. From the published validation studies, endocapillary hypercellularity was rarely found to be a risk factor for progression, with the exception of reports in cohorts of patients who did not receive steroid or cytotoxic therapy.29, 30 We speculate that the widespread use of RASB and even corticosteroids before renal biopsy might have influenced the lack of correlation in VALIGA patients between endocapillary hypercellularity and outcome.
Mesangial hypercellularity was confirmed to be a significant factor for progression in the full spectrum of IgAN enrolled in VALIGA, including patients with initial eGFR <30 ml/min per 1.73 m2 and patients with mild proteinuria at renal biopsy (<0.5 g/day). This appears to be a very sensitive pathology marker, as it was also an independent predictor of the surrogate end point measure of increased risk of worsening proteinuria to 1 or 2 g/day, a well-accepted risk factor for progression.26 The value of mesangial hypercellularity as an independent risk for progression is debated. It was not validated in relatively small groups of patients with IgAN, in which more advanced CKD stages were frequent.10, 12 On the contrary, in a large Chinese cohort, in which the criteria for renal biopsy also included mild cases,2 mesangial hypercellularity was found frequently and was an independent predictor of progression. Hence, in spite of different ethnicities, in large cohorts of Chinese and European patients mesangial hypercellularity was validated as a significant factor affecting progression. In VALIGA patients who received steroid/immunosuppressive therapy, the predictive value of M1 was lost, suggesting that mesangial hypercellularity may be a steroid-responsive lesion amenable to such therapy, as reported in studies from Japan.31, 32
Segmental sclerosis and tubular atrophy/interstitial fibrosis were also confirmed in the VALIGA cohort as risk factors for poor prognosis, in agreement with almost all previous validation studies. This is perhaps not surprising, particularly when the end point considered is survival without ESRD, as these lesions represent a more chronic and late stage of IgAN renal damage. Notably, in patients with proteinuria <0.5 g/day and well-preserved GFR, 71% of whom were treated by RASB, mesangial and/or endocapillary hypercellularity were more predictive of outcome than segmental sclerosis and the rarely detected tubular atrophy/interstitial fibrosis. This observation may suggest the advantage of an early renal biopsy in subjects suspected to have IgAN, although the risks of a renal biopsy and the cost–benefit ratio have not been assessed in this specific context.
Crescents were found in a minority of cases, and their presence, as defined in the Oxford cohort, was not found to be of prognostic value. This conclusion is similar to several other observations in large cohorts of Asian patients.2, 33 It may be that in presence of crescents more detailed case-by-case analysis is needed, including the presence of associated lesions and the clinical context. Moreover, crescents may respond to immunosuppressive therapy, and hence their prognostic value could be reduced by treatment.
The large number of cases enrolled in VALIGA allowed a subanalysis of the MEST scores in selected cohorts of patients presenting with different clinical features or receiving various treatments. In the VALIGA cohort, the MST scores were strongly associated with outcome only in patients who did not receive steroid/immunosuppressive drugs, whereas this effect was blunted in those who received this treatment. There is a risk of over-interpreting the data from the VALIGA cohort, as well as the Oxford and other recently published studies, as all are retrospective series with uncontrolled doses, time of initiation, and durations of therapies. Reports on studies that include repeated renal biopsies have shown the possibility of improvement of certain histological lesions, including mesangial and endocapillary hypercellularity, and crescents.33, 34 A study from Korea, which evaluated patients with IgAN who received steroid/immunosuppressive treatment, found no predictive value of MEST scores,34 whereas the Oxford scoring system was fully validated in a nontreated cohort from France.29 This was very similar to our VALIGA data where the predictive value of the pathology features in addition to the clinical data was evident only in patients who did not receive steroid/immunosuppressive treatment.
In conclusion, the VALIGA study has provided a validation of the Oxford MEST score classification in a large European cohort of patients with IgAN. The analysis of the full spectrum of renal pathology features and clinical conditions represented in this relevant cohort indicated that the MEST score has to be considered in the light of both the clinical features, including levels of proteinuria and GFR values, and the treatments given before renal biopsy. It also demonstrated that the postbiopsy therapeutic maneuvers are likely to modulate some of the pathology risk factors.
MATERIALS AND METHODS
VALIGA is an European multicenter retrospective study of patients with biopsy-proven primary IgAN with a follow-up >1 year or who reached ESRD in less than 1 year. Renal biopsy review required ⩾8 glomeruli. All centers had ethical board approval.
Clinical spreadsheets recorded past history and baseline data (within 3 months of the renal biopsy). Each renal biopsy was scored by the local pathologist according to the Oxford classification. Biopsy slides were rescored by the Pathology review center in Oxford, UK, where the pathologists were blinded to clinical and local pathology data. Centrally reviewed data were used for statistical analysis.
Clinical data set and definitions
Children were subjects aged <18 years at biopsy. To provide consistency between measurements in adults and children, proteinuria was expressed in g per 24 h per 1.73 m2 in children and g per 24 h in adults. In children, blood pressure was adjusted for gender and age, as in the original report.8 To replicate the Oxford study, eGFR was estimated using the 4-variable MDRD formula in adults35 and the Schwartz formula in children (constant K=0.55)36 with a maximum eGFR set at 120 ml/min per 1.73 m2, as the accuracy of eGFR for higher values is low37 and also as small variations in creatinine can have a disproportionate impact on the rate of renal function decline. ESRD was defined as eGFR <15 ml/min per 1.73 m2. MAP was diastolic blood pressure plus a third of systolic blood pressure. For each child, the standard deviation score for MAP was calculated and used to normalize MAP to adult values.8, 38 Average MAP and proteinuria were determined for each 6-month period of observation. TA MAP and TA proteinuria represent the average of each period's mean. Immunosuppressive treatment was considered as intent to treat regardless of the type or duration of therapy. RASB indicated treatment with either angiotensin-converting enzyme inhibitor or angiotensin receptor blocker or both. Adults with SBP ⩾140 mm Hg or DBP ⩾90 mm Hg or those on antihypertensive drugs were considered to be hypertensive, and children with MAP exceeding the 95th percentile for height, sex and age or on antihypertensive drugs were considered to be hypertensive.
Pathology review
Renal biopsies were scored according to the Oxford Classification: mesangial hypercellularity, M0/M1 (< or equal to >50% of glomeruli with >4 mesangial cells/area); endocapillary hypercellularity, E0/E1 (present/absent); segmental glomerulosclerosis, S0/S1 (present/absent); tubular atrophy/interstitial fibrosis, T0/T1/T2 (<25%, 25–50%, >50%). In addition, arterial intimal thickening and extracapillary proliferation with cellular or fibrocellular crescents were categorized as present/absent according to the Oxford report.6, 7
Outcomes
Two clinical outcomes were considered to evaluate the predictive value of renal pathology variables, the rate of renal function decline (slope of eGFR) and survival from a 50% reduction in renal function, or ESRD. In patients with an initial proteinuria <0.5 g/day, increases in proteinuria to ⩾1 or to ⩾2 g/day were considered surrogate outcomes, which is indicative of a poor long-term outcome in comparison with the same cohorts whose proteinuria did not increase during follow-up.23
Statistical methods
Normally distributed variables were expressed as mean±s.d. and compared using Student's t-test, one-way analysis of variance, or Pearson's test. Nonparametric variables were expressed as median, interquartile ranges (IQ) and compared either by Mann–Whitney, Kruskal–Wallis, or Spearman's test. Categorical variables were expressed in percentages and compared using the Pearson χ2 test.
The rate of renal function decline was determined by fitting a straight line through available data for eGFR using the principle of least squares. This was plotted and visually examined for each patient. Obvious outliers were censored. Univariate analysis followed by multiple linear regression was used to determine independent predictors of slope. Survival analysis using Cox regression was performed to test the association between each pathology finding and a combined event (50% reduction in renal function or ESRD) to increase the rate of events and to permit a valid multivariate analysis. To allow comparison with the original study, the same multivariate models were adopted, and these include a model using pathology variables only (M, S, and T), one with clinical variables only (initial eGFR, time average MAP and proteinuria), and a final model including both pathological and clinical features. We validated the same multivariate models from the original Oxford classification study. These did not include the E lesion, as it had showed a strong interaction with therapy and was only predictive when considering individuals who did not receive immunosuppression. The exposure to immunosuppressive treatments (glucocorticoids or immunosuppressive drugs) was considered as presence versus absence.
To further assess how pathology adds predictive value, we determined the net reclassification index.39 First, we dichotomized the rate of renal function decline into a rapid or slow observed progression based on the median slope. Second, rapid or slow predicted progressions were determined for each individual using two logistic models, one with clinical variables only and another with both clinical and pathology variables. Finally, we assessed the number of individuals who were reclassified, appropriately or not, going from the regression model with clinical variables only to the one with both clinical and pathological variables. The net reclassification index is calculated using probabilities (P) of reclassification as follows: net reclassification index=P(correct reclassification | rapid progression) – P(incorrect reclassification | rapid progression)+P(correct reclassification | slow progression) – P(incorrect reclassification | slow progression). We also calculated the area under the receiver-operating characteristic curves (c-statistic) for these models using logistic regression.
All P-values were two-tailed, and values less than 0.05 were considered statistically significant. Confidence intervals included 95% of predicted values. Analyses were carried out using the SPSS software (version 11, SPSS, Chicago, IL).
Acknowledgments
The study was granted by the first research call of the European Renal Association-European Dialysis and Transplant Association (ERA-EDTA) in 2009.
Appendix
VALIGA centers lists
NEPHROLOGISTS
Tesar V, Maixnerova D (Prague, Czech Republic), Lundberg S (Stockholm, Sweden), Gesualdo L (Foggia-Bari, Italy), Emma F, Fuiano L (Rome, Italy), Beltrame G, Rollino C (Turin, Italy), Coppo R, Amore A, Camilla R, Peruzzi L (Turin, Italy), Praga M (Madrid, Spain), Feriozzi S, Polci R (Viterbo, Italy), Segoloni G, Colla L (Turin, Italy), Pani A, Angioi A, Piras D (Cagliari, Italy), Feehally J (Leicester, United Kingdom), Cancarini G, Ravera S (Brescia, Italy), Durlik M (Warsaw, Poland), Moggia E (Cuneo, Italy), Ballarin J (Barcelona, Spain), Di Giulio S (Rome, Italy), Pugliese F (Rome, Italy), Caliskan Y (Istanbul, Turkey), Locatelli F, Del Vecchio L (Lecco, Italy), Wetzels JFM, Peters H (Nijmigen, The Netherlands), Berg U (Huddinge, Sweden), Carvalho F (Lisbon, Portugal), Maggio M (Lodi, Italy), Wiecek A (Katowice, Poland), Ots-Rosenberg M (Tartu, Estonia), Magistroni R (Modena, Italy), Topaloglu R, Bilginer Y (Ankara, Turkey), D'Amico M (Como, Italy), Stangou M (Thessaloniki, Greece), Giacchino F (Ivrea, Italy), Goumenos D, Kalliakmani P, Gerolymos M (Patras, Greece), Galesic K (Zagreb, Croatia), Geddes C (Glasgow, United Kingdom), Siamopoulos K, Balafa O (Ioannina, Greece), Galliani M (Rome, Italy), Stratta P, Quaglia M (Novara, Italy), Bergia R, Cravero R (Biella, Italy), Salvadori M, Cirami L (Florence, Italy), Fellstrom B, Kloster Smerud H (Uppsala, Sweden), Ferrario F, Stellato T (Monza, Italy), Egido J, Martin C (Madrid, Spain), Floege J, Eitner F (Aachen, Germany), Lupo A, Bernich P (Verona, Italy), Menè P (Rome, Italy), Morosetti M (Ostia, Italy), van Kooten C, Rabelink T, Reinders MEJ (Leiden, The Netherlands), Boria Grinyo JM (Barcelona, Spain), Cusinato S, Benozzi L (Borgomanero, Italy), Savoldi S, Licata C (Ciriè, Italy), Mizerska Wasiak M (Warsaw, Poland), Martina G, Messuerotti A (Chivasso, Italy), Dal Canton A, Esposito C, Migotto C (Pavia, Italy), Triolo G, Mariano F (Turin, Italy), Pozzi C (Cinisello B., Italy), Boero R (Turin, Italy).
PATHOLOGISTS
Mazzucco G (Turin, Italy), Giannakakis C (Rome, Italy), Honsova E (Prague, Czech Republic), Sundelin B (Stockholm, Sweden), Di Palma AM (Foggia-Bari, Italy), Ferrario F (Monza, Italy), Gutiérrez E (Madrid, Spain), Asunis AM (Cagliari, Italy), Barratt J (Leicester, UK), Tardanico R (Brescia, Italy), Perkowska-Ptasinska A (Warsaw, Poland), Arce Terroba J (Barcelona, Spain), Fortunato M (Cuneo, Italy), Ozluk Y, Kilicaslan I (Istanbul, Turkey), Steenberger E (Nijmigen, The Netherlands), Soderberg M (Huddinge, Sweden), da Costa Ferreira AC (Lisbon, Portugal), Riispere Z (Tartu, Estonia), Furci L (Modena, Italy), Orhan D (Ankara, Turkey), Kipgen D (Glasgow, UK), Casartelli D (Lecco, Italy), Galesic Ljubanovic D (Zagreb, Croatia), Bertoni E (Florence, Italy), Cannata Ortiz P (Madrid, Spain), Groene HJ (Heidelberg, Germany), Stoppacciaro A (Rome, Italy), Bajema I, Bruijn J (Leiden, The Netherlands), Fulladosa Oliveras X (Barcelona, Spain), Maldyk J (Warsaw, Poland), Ioachim E (Ioannina, Greece).
All the authors declared no competing interests.
Footnotes
SUPPLEMENTARY MATERIAL
Table S1. Comparison of clinical data at renal biopsy in patients vs. MEST scores.
Table S2. Baseline and follow-up clinical data and MEST score of VALIGA subgroup of patients with IgA nephropathy, identified by initial proteinuria<0.5 g/day.
Table S3. Baseline and follow-up clinical data and MEST score of VALIGA subgroup of patients, identified by initial eGFR <30 ml/min per 1.73 m2.
Figure S1. European Centers participating in the VALIGA study.
Figure S2. List of the Centers of the VALIGA study.
Figure S3. Added value of pathology variables in predicting the rate of renal function decline in IgAN patients who never received steroid/immunosuppressive drugs (left panel) and who received steroid/immunosuppression (right panel).
Supplementary material is linked to the online version of the paper at http://www.nature.com/ki
Supplementary Material
References
- D'Amico G. The commonest glomerulonephritis in the world: IgA nephropathy. Q J Med. 1987;64:709–727. [PubMed] [Google Scholar]
- Zeng CH, Le W, Ni Z, et al. A multicenter application and evaluation of the Oxford classification of IgA nephropathy in adult Chinese patients. Am J Kidney Dis. 2012;60:812–820. doi: 10.1053/j.ajkd.2012.06.011. [DOI] [PubMed] [Google Scholar]
- Manno C, Strippoli GF, D'Altri C, et al. A novel simpler histological classification for renal survival in IgA nephropathy: a retrospective study. Am J Kidney Dis. 2007;49:763–775. doi: 10.1053/j.ajkd.2007.03.013. [DOI] [PubMed] [Google Scholar]
- Berthoux F, Mohey H, Laurent B, et al. Predicting the risk for dialysis or death in IgA nephropathy. J Am Soc Nephrol. 2011;22:752–761. doi: 10.1681/ASN.2010040355. [DOI] [PMC free article] [PubMed] [Google Scholar]
- Maixnerova D, Bauerova L, Skibova J, et al. The retrospective analysis of 343 Czech patients with IgA nephropathy: one centre experience. Nephrol Dial Transplant. 2012;27:1492–1498. doi: 10.1093/ndt/gfr482. [DOI] [PubMed] [Google Scholar]
- Cattran DC, Coppo R, Cook HT, et al. The Oxford classification of IgA nephropathy: rationale, clinicopathological correlations, and classification. Kidney Int. 2009;76:534–545. doi: 10.1038/ki.2009.243. [DOI] [PubMed] [Google Scholar]
- Roberts IS, Cook HT, Troyanov S, et al. The Oxford classification of IgA nephropathy: pathology definitions, correlations, and reproducibility. Kidney Int. 2009;76:546–556. doi: 10.1038/ki.2009.168. [DOI] [PubMed] [Google Scholar]
- Coppo R, Troyanov S, Camilla R, et al. The Oxford IgA nephropathy clinicopathological classification is valid for children as well as adults. Kidney Int. 2010;77:921–927. doi: 10.1038/ki.2010.43. [DOI] [PubMed] [Google Scholar]
- Roberts IS. Oxford classification of immunoglobulin A nephropathy: an update. Curr Opin Nephrol Hypertens. 2013;22:281–286. doi: 10.1097/MNH.0b013e32835fe65c. [DOI] [PubMed] [Google Scholar]
- Alamartine E, Sauron C, Laurent B, et al. The use of the Oxford classification of IgA nephropathy to predict renal survival. Clin J Am Soc Nephrol. 2011;6:2384–2388. doi: 10.2215/CJN.01170211. [DOI] [PMC free article] [PubMed] [Google Scholar]
- Edstrom Halling S, Soderberg MP, Berg UB, et al. Predictors of outcome in paediatric IgA nephropathy with regard to clinical and histopathological variables (Oxford classification) Nephrol Dial Transplant. 2012;27:715–722. doi: 10.1093/ndt/gfr339. [DOI] [PubMed] [Google Scholar]
- Herzenberg AM, Fogo AB, Reich HN, et al. Validation of the Oxford classification of IgA nephropathy. Kidney Int. 2011;80:310–317. doi: 10.1038/ki.2011.126. [DOI] [PubMed] [Google Scholar]
- Kang SH, Choi SR, Park HS, et al. The Oxford classification as a predictor of prognosis in patients with IgA nephropathy. Nephrol Dial Transplant. 2012;27:252–258. doi: 10.1093/ndt/gfr295. [DOI] [PubMed] [Google Scholar]
- Kataoka H, Ohara M, Shibui K, et al. Overweight and obesity accelerate the progression of IgA nephropathy: prognostic utility of a combination of BMI and histopathological parameters. Clin Exp Nephrol. 2012;16:706–712. doi: 10.1007/s10157-012-0613-7. [DOI] [PubMed] [Google Scholar]
- Lee H, Yi SH, Seo MS, et al. Validation of the Oxford classification of IgA nephropathy: a single-center study in Korean adults. Korean J Intern Med. 2012;27:293–300. doi: 10.3904/kjim.2012.27.3.293. [DOI] [PMC free article] [PubMed] [Google Scholar]
- Moriyama T, Nakayama K, Iwasaki C, et al. Severity of nephrotic IgA nephropathy according to the Oxford classification. Int Urol Nephrol. 2012;44:1177–1184. doi: 10.1007/s11255-011-0109-5. [DOI] [PubMed] [Google Scholar]
- Shi SF, Wang SX, Jiang L, et al. Pathologic predictors of renal outcome and therapeutic efficacy in IgA nephropathy: validation of the Oxford Classification. Clin J Am Soc Nephrol. 2011;6:2175–2184. doi: 10.2215/CJN.11521210. [DOI] [PMC free article] [PubMed] [Google Scholar]
- Shima Y, Nakanishi K, Hama T, et al. Validity of the Oxford classification of IgA nephropathy in children. Pediatr Nephrol. 2012;27:783–792. doi: 10.1007/s00467-011-2061-0. [DOI] [PubMed] [Google Scholar]
- Yau T, Korbet SM, Schwartz MM, et al. The Oxford classification of IgA nephropathy: a retrospective analysis. Am J Nephrol. 2011;34:435–444. doi: 10.1159/000332223. [DOI] [PubMed] [Google Scholar]
- Praga M, Gutiérrez E, González E, et al. Treatment of IgA nephropathy with ACE inhibitors: a randomized and controlled trial. J Am Soc Nephrol. 2003;14:1578–1583. doi: 10.1097/01.asn.0000068460.37369.dc. [DOI] [PubMed] [Google Scholar]
- Coppo R, Peruzzi L, Amore A, et al. IgACE: a placebo-controlled, randomized trial of angiotensin-converting enzyme inhibitors in children and young people with IgA nephropathy and moderate proteinuria. J Am Soc Nephrol. 2007;18:1880–1888. doi: 10.1681/ASN.2006040347. [DOI] [PubMed] [Google Scholar]
- Pozzi C, Bolasco PG, Fogazzi GB, et al. Corticosteroids in IgA nephropathy: a randomised controlled trial. Lancet. 1999;353:883–887. doi: 10.1016/s0140-6736(98)03563-6. [DOI] [PubMed] [Google Scholar]
- Pozzi C, Andrulli S, Del Vecchio L, et al. Corticosteroid effectiveness in IgA nephropathy: long-term results of a randomized, controlled trial. J Am Soc Nephrol. 2004;15:157–163. doi: 10.1097/01.asn.0000103869.08096.4f. [DOI] [PubMed] [Google Scholar]
- Manno C, Torres DD, Rossini M, et al. Randomized controlled clinical trial of corticosteroids plus ACE-inhibitors with long-term follow-up in proteinuric IgA nephropathy. Nephrol Dial Transplant. 2009;24:3694–3701. doi: 10.1093/ndt/gfp356. [DOI] [PubMed] [Google Scholar]
- Ballardie FW, Roberts IS. Controlled prospective trial of prednisolone and cytotoxics in progressive IgA nephropathy. J Am Soc Nephrol. 2002;13:142–148. doi: 10.1681/ASN.V131142. [DOI] [PubMed] [Google Scholar]
- Reich HN, Troyanov S, Scholey JW, et al. Remission of proteinuria improves prognosis in IgA nephropathy. J Am Soc Nephrol. 2007;18:3177–3183. doi: 10.1681/ASN.2007050526. [DOI] [PubMed] [Google Scholar]
- Alamartine E, Sabatier JC, Guerin C, et al. Prognostic factors in mesangial IgA glomerulonephritis: an extensive study with univariate and multivariate analyses. Am J Kidney Dis. 1991;18:12–19. doi: 10.1016/s0272-6386(12)80284-8. [DOI] [PubMed] [Google Scholar]
- D'Amico G. Natural history of idiopathic IgA nephropathy: role of clinical and histological prognostic factors. Am J Kidney Dis. 2000;36:227–237. doi: 10.1053/ajkd.2000.8966. [DOI] [PubMed] [Google Scholar]
- El Karoui K, Hill GS, Karras A, et al. Focal segmental glomerulosclerosis plays a major role in the progression of IgA nephropathy. II. Light microscopic and clinical studies. Kidney Int. 2011;79:643–654. doi: 10.1038/ki.2010.460. [DOI] [PubMed] [Google Scholar]
- Chakera A, MacEwen C, Bellur SS, et al. Prognostic value of endocapillary proliferation in IgA nephropathy patients with minimal immunosuppression Mod Pathol 201326385A23060122 [Google Scholar]
- Shima Y, Nakanishi K, Kamei K, et al. Disappearance of glomerular IgA deposits in childhood IgA nephropathy showing diffuse mesangial proliferation after 2 years of combination/prednisolone therapy. Nephrol Dial Transplant. 2011;26:163–169. doi: 10.1093/ndt/gfq387. [DOI] [PubMed] [Google Scholar]
- Katafuchi R, Ninomiya T, Nagata M, et al. Validation study of Oxford Classification of IgA nephropathy: the significance of extracapillary proliferation. Clin J Am Soc Nephrol. 2011;6:2806–2813. doi: 10.2215/CJN.02890311. [DOI] [PMC free article] [PubMed] [Google Scholar]
- Hotta O, Furuta T, Chiba S, et al. Regression of IgA nephropathy: a repeat biopsy study. Am J Kidney Dis. 2002;39:493–502. doi: 10.1053/ajkd.2002.31399. [DOI] [PubMed] [Google Scholar]
- Choi S, Lee D, Jeong KH, et al. Prognostic relevance of clinical and histological features in IgA nephropathy treated with steroid and angiotensin receptor blockers. Clin Nephrol. 2009;72:353–359. doi: 10.5414/cnp72353. [DOI] [PubMed] [Google Scholar]
- Levey AS, Bosch JP, Lewis JB, et al. A more accurate method to estimate glomerular filtration rate from serum creatinine: a new prediction equation. Modification of Diet in Renal Disease Study Group. Ann Intern Med. 1999;130:461–470. doi: 10.7326/0003-4819-130-6-199903160-00002. [DOI] [PubMed] [Google Scholar]
- Work DF, Schwartz GJ. Estimating and measuring glomerular filtration rate in children. Curr Opin Nephrol Hypertens. 2008;17:320–325. doi: 10.1097/MNH.0b013e3282fb77f2. [DOI] [PubMed] [Google Scholar]
- Miller WG. Estimating equations for glomerular filtration rate in children: laboratory considerations. Clin Chem. 2009;55:402–403. doi: 10.1373/clinchem.2008.122218. [DOI] [PubMed] [Google Scholar]
- Wühl E, Witte K, Soergel M, et al. German Working Group on Pediatric Hypertension. Distribution of 24-h ambulatory blood pressure in children: normalized reference values and role of body dimensions. J Hypertens. 2002;20:1995–2007. doi: 10.1097/00004872-200210000-00019. [DOI] [PubMed] [Google Scholar]
- Pencina MJ, D‘Agostino RB, Sr, D‘Agostino RB, Jr, et al. Evaluating the added predictive ability of a new marker: from area under the ROC curve to reclassification and beyond. Stat Med. 2008;27:157–172. doi: 10.1002/sim.2929. [DOI] [PubMed] [Google Scholar]
Associated Data
This section collects any data citations, data availability statements, or supplementary materials included in this article.