

Abstract
Background:
Death is uncommon in thyroid cancer patients, and the factors important in predicting survival remain inadequately studied. The objective of this study was to assess prognostic effects of patient, tumor, and treatment factors and to determine prognostic groups for thyroid cancer survival.
Methods:
Using data from the Surveillance, Epidemiology, and End Results Program (SEER), we evaluated overall and disease-specific survival (DSS) in 43 392 well-differentiated thyroid cancer patients diagnosed from 1998 through 2005. Multivariable analyses were performed using Cox proportional hazards regression, survival trees, and random survival forest. Similar analyses were performed using National Cancer Data Base data, with overall survival (OS) evaluated in 131 484 thyroid cancer patients diagnosed from 1998 through 2005. Relative importance of factors important to survival was assessed based on the random survival forest analyses.
Results:
Using survival tree analyses, we identified 4 distinct prognostic groups based on DSS (P < .0001). The 5-year DSS of these prognostic groups was 100%, 98%, 91%, 64%, whereas the 10-year survival was 100%, 96%, 85%, and 50%. Based on random survival forest analyses, the most important factors for DSS were SEER stage and age at diagnosis. For OS, important prognostic factors were similar, except age at diagnosis demonstrated marked importance relative to SEER stage. Similar results for OS were found using National Cancer Data Base data.
Conclusion:
This study identifies distinct prognostic groups for thyroid cancer and illustrates the importance of patient age to both disease-specific and OS. These findings have implications for patient education and thyroid cancer treatment.
Thyroid cancer is now one of the 10 most common cancers in the United States (1). Although a prevalent cancer, death in thyroid cancer patients is uncommon. In 2014, there were estimated to be 62 980 new cases of thyroid cancer and only 1890 deaths from thyroid cancer (2). However, despite most patients having an excellent prognosis, there is heterogeneity in outcome with some patients faring poorly (3–5). Understanding which patients are at risk for a poor outcome is key to applying appropriate treatment plans and long-term surveillance.
Because mortality is low in thyroid cancer patients, the correlates of survival and the relative importance of these correlates are difficult to assess with single or even multi-institutional studies. The benefit of more intensive treatment vs less and the role of race, sex, and age in prognosis remain controversial (6–12). The development of comprehensive prognostic groups is important because it will allow tailoring of treatment intensity.
To identify prognostic groups; to determine the role of age and other patient, tumor, and treatment variables in survival; and to establish the unique interactions between these variables, we performed analyses based on survival trees, random forest, and Cox proportional hazards regression on 43 392 well-differentiated thyroid cancer patients diagnosed from 1998 through 2005 affiliated with the Surveillance, Epidemiology, and End Results Program (SEER). Similar analyses were performed on 131 484 well-differentiated thyroid cancer patients affiliated with the National Cancer Data Base (NCDB) from 1998 through 2005. We hypothesized that age and stage would be the primary factors determining outcome and that race, sex, and treatment would have a minimal role in predicting overall survival (OS).
Subjects and Methods
Data source and study population
Data were collected from the SEER of the National Cancer Institute, which provides information on cancer incidence and survival statistics among the U.S. population. It is the only comprehensive source of population-based cancer data in the United States that includes stage of cancer at time of diagnosis and patient survival data. Its inclusive cancer registries cover 28% of the U.S. population (13). The study cohort included 43 392 well-differentiated thyroid cancer patients (papillary, follicular, and Hurthle cell cancer) from SEER diagnosed from 1998 through 2005. The median follow-up for this cohort was 7.5 years.
The NCDB data were obtained from the NCDB Participant User File. The NCDB is a joint project of the Commission on Cancer of the American College of Surgeons and the American Cancer Society. Larger than any other U.S. cancer registry, it captures 70% of all cancers in the United States (14). Data are coded and reported according to established protocols. Data undergo integrity checks, internal monitoring, and quality review (15).
The NCDB study cohort included 131 484 well-differentiated thyroid cancer patients diagnosed from 1998 through 2005. The median follow-up for this cohort was 6.7 years.
Institutional review board approval was not required because this study involved research using publicly available data and could not be tracked to human subjects.
Measures
SEER cohort
Age at diagnosis was analyzed as a continuous variable and as a categorical variable (≤30, 31–40, 41–50, 51–60, 61–70, 71–80, and ≥81 years). Race was categorical comprising white, black, and other (Asian, American Indian/Alaska Native, Native Hawaiian, and Pacific Islander), and ethnicity was divided into non-Hispanic and Hispanic. Household income and percent education level less than a high school diploma were assigned based on county of residence at the time of diagnosis matched to the 2000 U.S. Census data. The rural-urban continuum variable was created by matching the patient's state and county Federal Information Processing Standard code at the time of diagnosis to files published by the U.S. Department of Agriculture Economic Research Service. Tumor characteristics included histology, stage, and tumor size. Histology was categorized into papillary, follicular, and Hurthle cell cancer. Tumor stage was categorized into localized, regional, and distant metastases. Localized includes tumors confined to the thyroid or into the capsule but not beyond. Regional includes direct extension to blood vessels, nerves, muscles, thyroid cartilage, etc and tumor described as fixed to adjacent tissues. It also includes regional lymph node involvement. Distant includes distant lymph nodes and extension to bone, mediastinal tissues, etc (13). Tumor size was categorized as ≤1, 1.1–2, 2.1–4, and >4 cm. Treatment was classified as total thyroidectomy, lobectomy, radioactive iodine (RAI), and no RAI. Overall survival was defined as the time interval from diagnosis to death or time of censoring. Disease-specific survival (DSS) was defined as the time interval from diagnosis to death from thyroid cancer or time of censoring.
NCDB cohort
The same patient characteristics were included as in the SEER cohort. Additionally, the NCDB dataset included details on health insurance. Health insurance was divided into private/government, Medicaid, Medicare, and not insured. Demographic data were derived at the zip code level instead of county level. Staging differed because the NCDB cohort uses American Joint Committee on Cancer Tumor Nodes Metastasis staging instead of SEER stage. Treatment variables were compiled with surgery and RAI included. The NCDB data were analyzed in a secondary analysis.
Statistical analysis
We performed 2 sets of similar analyses for each of the endpoints OS and DSS. Survival tree analysis was used to construct distinct prognostic groups, such that within each group, patients have similar outcome but differ between groups (16–19). The terminology of trees is graphic; a tree T has a root that is the top node, and observations are passed down the tree, with decisions being made at each node (also called daughters) until a terminal node or leaf is reached. Each nonterminal node (also called internal node or parent node) contains a question on which a split is based.
In the tree paradigm, the covariate space is partitioned recursively in a binary fashion. The partitioning is intended to increase within-node homogeneity, where homogeneity is determined by the outcome variable. There are 3 basic elements for constructing a tree. These are 1) tree growing, 2) finding the right-sized tree, and 3) testing. The first element is aimed at addressing the question how and why a parent node is split into daughter nodes. Binary splits, phrased in terms of the covariates, are used to partition the predictor space. Each split depends upon the value of a single covariate. For ordered (continuous or categorical) covariates, Xj, only splits resulting from questions of the form “Is Xj ≤c?” for a fixed value c are considered, thereby allowing at most n − 1 splits for a sample of size n. For nominal covariates, no constraints on possible subdivisions are imposed. Thus, for a nominal covariate with M categories, there are 2M−1 − 1 splits to examine.
Our analyses began with the entire patient cohort and found the best split into 2 groups based on a variable that makes the resultant 2 groups most homogeneous within themselves. For the censored survival endpoints, within-group homogeneity was measured using deviance based on a proportional hazards model for each group (17). The 2 groups were again partitioned (each group being split on the same or other variables), thereby creating a tree structure. At each step to select the best split, the tree-growing paradigm examined every possible cutoff point for each prognostic variable. This process was continued until the groups reached a minimum size (<20 patients in each group). Because the resulting tree was overgrown (thereby overfitting the data), a subtree was chosen using cost-complexity pruning (17, 20, 21). The final tree contained terminal groups with similar survival. Ten- and 5-year survival rates were calculated as summary measures for each terminal group. Although the above method ensures that left and right terminal groups from the same parent are significantly different in terms of survival, it is possible that terminal groups from distinct parents may have similar survival. Therefore, further amalgamation of terminal groups with similar survival was performed. For amalgamation, we first ordered the terminal groups based on hazard ratio (HR) of a terminal group relative to the leftmost terminal group of the final tree. The monotone ordering was then coded as a single ordered covariate, and the survival tree algorithm was used again to form the final prognostic groups (21).
Next, we performed random survival forest analyses of our data (22–24). Random survival forest is an ensemble of unpruned survival trees, induced from bootstrap samples of the data, using random feature selection in the tree induction process. Correlation reduction is achieved by the random feature selection. At each step of the splitting process, instead of evaluating all allowable splits on all variables, as is done with growing a single tree, a subset of the covariates are drawn at random. We grew 500 trees in the forest. Survival predictions for each patient were made by averaging the predictions across all trees in the forest. Furthermore, as a byproduct of the forest, we obtained a collection of variables that were frequently used in the forest, with the frequency of uses indicative of the importance of these variables. The frequencies were used to rank the variables in terms of their relative importance to survival (22).
Finally, Cox proportional hazards regression analyses were performed on this patient cohort using the same variables used in the tree and forest analyses. Results obtained using proportional hazards analyses were compared with those generated by survival tree and random survival forest.
All analyses were performed using the statistical software R and SAS. Specifically, for growing the survival tree and random survival forest, we used the rpart and randomForestSRC packages in R, respectively (24, 25). For Cox regression, we used PROC PHREG in SAS.
Results
Table 1 shows the descriptive data and results from the Cox proportional hazard regression analyses for the association of patient, tumor, and treatment characteristics with DSS and OS. The majority (77%) of patients were women, 83% white and 87% non-Hispanic. Most patients had low risk disease with 32% having tumor size ≤1 cm, 63% with localized disease and 96% without distant metastases. The most common histopathology (89%) was papillary thyroid cancer. There was a positive association between age and survival. Older patient age was significantly associated with worse DSS and worse OS (Table 1). Distant metastases was an important predictor for both DSS (adjusted HR [AHR] 29, 95% confidence interval [CI] 22.9–36.7) and OS (AHR 4.9, 95% CI 4.4–5.5), compared with localized stage. Tumor size was an important predictor for DSS (compared with tumor size ≤1 cm, AHR for tumor size 2.1–4 cm was 2.2 [95% CI 1.7–2.9], and AHR for >4 cm was 4.4 [95% CI 3.3–5.8]).
Table 1.
Cox Proportional Hazard Regression for Association of Patient, Tumor, and Treatment Characteristics With OS and DSS Results Based on SEER
| n (%) | Adjusted HR (95% CI)a |
||
|---|---|---|---|
| DSS | OS | ||
| Patient characteristics | |||
| Age, y | |||
| <30 | 5901 (13.6) | Ref. | Ref. |
| 31–40 | 8934 (20.6) | 1.7 (0.8–3.7) | 1.8 (1.3–2.5) |
| 41–50 | 10 653 (24.6) | 4.9 (2.5–9.6) | 3.6 (2.7–4.9) |
| 51–60 | 8500 (19.6) | 17.5 (9.2–33.1) | 8.3 (6.3–10.9) |
| 61–70 | 5072 (11.7) | 30.1 (15.9–56.8) | 17.6 (13.3–23.1) |
| 71–80 | 3323 (7.6) | 48.9 (25.9–92.3) | 38.2 (29.1–50.2) |
| >81 | 1009 (2.3) | 80.0 (41.7–153.5) | 77.7 (58.5–103.2) |
| Sex | |||
| Female | 33 261 (76.7) | 0.8 (0.7–0.9) | 0.6 (0.6–0.7) |
| Male | 10 131 (23.3) | Ref. | Ref. |
| Race | |||
| White | 36 004 (83.0) | Ref. | Ref. |
| Black | 2720 (6.3) | 0.8 (0.6–1.1) | 1.3 (1.1–1.5) |
| Other | 4344 (10.0) | 1.0 (0.8–1.2) | 0.9 (0.8–1.0) |
| Hispanic origin | |||
| No | 37 610 (86.7) | Ref. | Ref. |
| Yes | 5782 (13.3) | 1.0 (0.8–1.2) | 0.9 (0.8–1.0) |
| Household income | |||
| >$46 000 | 22 585 (52.1) | ||
| $35 000–$45,999 | 16 398 (37.8) | ||
| $30 000–$35 000 | 2507 (5.8) | ||
| <$30 000 | 1902 (4.4) | ||
| Percentage with no high school degree | |||
| <14% | 10 357 (23.9) | ||
| 14%–19.9% | 15 716 (36.2) | ||
| 20%–28.9% | 8122 (18.7) | ||
| >29% | 9197 (21.2) | ||
| Rural-urban continuum | |||
| Metro | 39 186 (90.3) | ||
| Other | 4206 (9.7) | ||
| Tumor characteristics | |||
| Histology | |||
| Papillary | 38 603 (89.0) | Ref. | Ref. |
| Follicular | 3232 (7.5) | 1.2 (1.0–1.4) | 1.1 (1.0–1.2) |
| Hurthle cell | 1547 (3.6) | 1.1 (0.8–1.4) | 0.9 (0.8–1.0) |
| Stage | |||
| Localized | 27 267 (62.8) | Ref. | Ref. |
| Regional | 14 526 (33.5) | 5.5 (4.4–6.8) | 1.6 (1.5–1.8) |
| Distant | 1599 (3.7) | 29.0 (22.9–36.7) | 4.9 (4.4–5.5) |
| Tumor size, cm | |||
| <1.0 | 13 661 (31.5) | Ref. | Ref. |
| 1.1–2.0 | 10 969 (25.3) | 1.2 (0.9–1.6) | 0.9 (0.8–1.9) |
| 2.1–4.0 | 10 616 (24.5) | 2.2 (1.7–2.9) | 1.0 (0.9–1.1) |
| >4.0 | 4585 (10.6) | 4.4 (3.3–5.8) | 1.4 (1.2–1.6) |
| Treatment | |||
| Surgery | |||
| TT | 21 071 (48.6) | Ref. | Ref. |
| L | 2553 (5.9) | 0.6 (0.4–0.9) | 1.0 (0.9–1.1) |
| RAI | |||
| No | 23 624 (54.4) | Ref. | Ref. |
| Yes | 19 768 (45.6) | 0.8 (0.7–0.9) | 0.8 (0.7–0.8) |
Abbreviations: L, lobectomy; Ref., reference; TT, total thyroidectomy.
Adjusted HRs based on a multivariable Cox proportional hazards regression model using only complete cases (n = 43 392). Income, education, and rural/urban were not included in the multivariable model.
Figure 1 shows the survival tree for DSS based on SEER data. At each level of the tree, we show the best splitter (covariate with cutoff point). Circles denote terminal groups in the tree. Within each terminal group, the first percentage denotes the 5-year DSS rate and the second percentage denotes the 10-year DSS rate, respectively. For each terminal group, we also report the ratio of the crude number of events (numerator) to the total number of patients in that terminal group (denominator). The tree was initially split by stage: localized or regional vs distant. For patients with distant metastases, age ≥52 years was a significant predictor of DSS (5- and 10-year DSS in patients ≥52 years vs ≤51 years were 64% vs 95% and 50% vs 93%, respectively). There are 4 prognostic groups. Group I (red) contains patients ≤63 years old with localized disease or patients ≤48 years with regional disease. Group II (blue) contains patients 49 to 63 years of age with regional disease or ≥64 years of age with localized disease. Group III (green) includes patients ≥64 years of age with regional disease or ≤51 years of age with distant disease. Group IV (gold) contains patients ≥52 years of age with distant disease.
Figure 1.
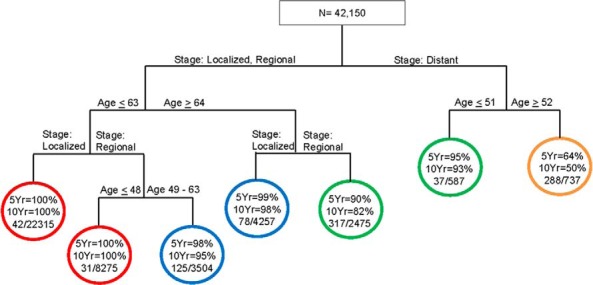
Survival tree for DSS based on the SEER cohort.
Figure 2 shows the survival tree for OS based on SEER data. For each terminal group, 5- and 10-year OS rates are presented. The first split in the tree was by age ≤61 vs ≥62 years. All subsequent splits were based on age, sex, and SEER stage. There were 4 distinct prognostic groups for SEER OS. Group I (red) consist of female patients ≤49 years of age. Group II (blue) includes male patients ≤49 years of age, patients 50 to 61 years of age with localized/regional disease, or female patients 62–70 years of age with localized/regional disease. Group III (green) includes female patients 71 to 75 years of age with localized/regional disease and male patients 62–75 years of age with localized/regional disease. Group IV (gold) includes patients 50–61 years of age with distant disease, patients 62–75 years of age with distant disease, patients ≥76 years of age with localized/regional disease, or patients ≥76 years of age with distant disease.
Figure 2.

Survival tree for OS based on the SEER cohort.
Based on the amalgamation method described earlier, we identified 4 final prognostic groups for DSS as well as OS. Figure 3A shows the Kaplan-Meier curves for the 4 prognostic groups based on DSS. The 5- and 10-year DSS rates of these prognostic groups are as follows: group I, 100% and 100%; group II, 98% and 96%; group III, 91% and 85%; and group IV, 64% and 50%, respectively.
Figure 3.
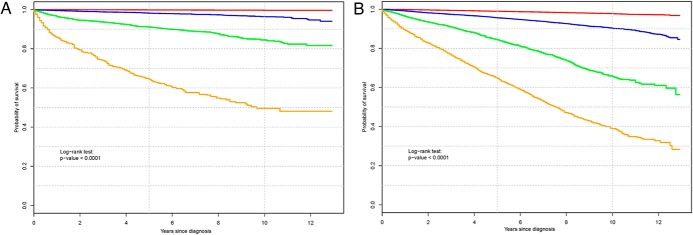
A, Kaplan-Meier curves for the 4 distinct prognostic groups based on DSS. Group I (red) contains patients ≤63 years old with localized disease or patients ≤48 years old with regional disease. Group II (blue) contains patients 49 to 63 years old with regional disease or ≥64 years old with localized disease. Group III (green) includes patients ≥64 years old with regional disease or ≤51 years old with distant disease. Group IV (gold) contains patients ≥52 years old with distant disease. B, Kaplan-Meier curves for the 4 distinct prognostic groups based on OS. Group I (red) consists of female patients ≤49 years old. Group II (blue) includes male patients ≤49 years old, patients 50 to 61 years old with localized/regional disease, or female patients 62 to 70 years old with localized/regional disease. Group III (green) includes female patients 71 to 75 years old with localized/regional disease and male patients 62 to 75 years old with localized/regional disease. Group IV (gold) includes patients 50 to 61 years old with distant disease, patients 62 to 75 years old with distant disease, patients ≥76 years old with localized/regional disease, or patients age ≥76 years old with distant disease.
Figure 3B shows the Kaplan-Meier curves for the 4 prognostic groups based on OS. The 5- and 10-year OS rates of these prognostic groups are as follows: group I, 99% and 98%; group II, 96% and 90%; group III, 84% and 66%; and group IV, 65% and 39%, respectively.
Figure 4A illustrates the relative importance of each of the patient, tumor, and treatment variables to DSS based on the random survival forest analysis. Tumor stage (1.00) and patient age at diagnosis (0.97) were most important in determining DSS. The relative importance of tumor size was 0.32. All other variables had a smaller role in predicting DSS because their relative importance was <0.03.
Figure 4.

A, Relative importance of each of the patient, tumor, and treatment variables to DSS based on the random survival forest analysis of the SEER cohort. B, Relative importance of each of the patient, tumor, and treatment variables to OS based on the random survival forest analysis of the SEER cohort. C, Relative importance of each of the patient, tumor, and treatment variables to OS based on the random survival forest analysis of the NCDB cohort.
Figure 4B illustrates the relative importance of each of the patient, tumor, and treatment variables to OS based on the random survival forest analysis. Patient age at diagnosis was most important in determining OS (1.00). The relative importance of stage was far lower at 0.13 and sex at 0.06. All other variables had a much smaller role in predicting OS with relative importance <0.04.
Results from analysis of the NCDB cohort for OS were similar to those from the SEER cohort, with age at diagnosis being the primary determinant for OS (variable importance 1.00). Figure 4C shows the relative importance of each of the patient, tumor, and treatment variables to OS based on the random survival forest analyses on the NCDB cohort.
Discussion
Strengths of this study include the large cohorts of patients; the exhaustive set of patient, tumor, and treatment variables; and the novel methodology. The survival tree and random survival forest methodology used in this study allowed us to naturally define prognostic groups, identify factors most important in predicting survival, and assess interactions between these factors. Although traditional methodologies such as Cox proportional hazards regression allow for assessment of prognostic factors, these methods are not naturally adept at prognostic stratification or assessment of relative importance. Discovery of interactions is also difficult using Cox regression because interactions have to be specified a priori. Use of this novel methodology allowed for an important advance in the thyroid cancer field.
Moreover, the large sample sizes allowed us to construct distinct prognostic groups incorporating all potential known correlates of survival. We found that relative to other patient, tumor, and treatment variables, age is the single most important factor that strongly correlates with outcome for both DSS and OS. Stage is an important determinant for DSS but has less relative importance than age in OS.
Unlike most malignancies, age is incorporated into the thyroid cancer staging systems (26, 27). With the American Joint Committee on Cancer Tumor Nodes Metastasis staging, patients <45 years old are stage I unless they have distant metastases when they are stage II. In patients ≥45 years old, tumor size, lymph node metastases, extrathyroidal extension, and distant metastases are incorporated into staging (26). Recent studies have challenged the rigid age cutoff of 45 years. A German study found that when all-cause mortality was compared in patients with well-differentiated thyroid cancer vs the general population, there was a moderate decline in survival in patients 45 to 59 years old and a significant decline in those over age 60 (28). Another study found that starting at age 40, there is a steady decline in the OS of thyroid cancer patients (9). Furthermore, a recent study has developed a nomogram for predicting probability of death from thyroid cancer with increasing age associated with increased cumulative incidence of death (29). Our study supports these findings, suggesting a positive continuous association between age and survival.
Our study emphasizes the importance of age at diagnosis and tumor stage for DSS, because the relative importance of the other patient, tumor, and treatment variables are dwarfed in comparison. Even though death is uncommon in thyroid cancer patients, the SEER cohort sample size allowed us to identify distinct prognostic groups ranging in 10-year DSS between 50% and 100%, and 10-year OS between 39% and 98%, and to determine the age cutoffs most relevant to prognosis. Results from the Cox regression analysis demonstrate that instead of a threshold effect, age has an approximate linear effect on survival. Our data suggest that age should be considered in a continuous manner instead of with the rigid cutoff of <45 vs ≥45 years old. With increasing age, there is a decline in both DSS and OS.
We conducted a parallel analysis of the NCDB data cohort, because this offered a sample size close to 3 times larger than SEER and exhibited more granular data, with inclusion of health insurance and demographic data derived from zip codes. Using this cohort as confirmatory testing, we have again shown that in older patients, only age and tumor characteristics determine OS, whereas in younger patients, additional clinical and nonclinical factors such as insurance and sex influence prognosis. In general, similar results were found as with SEER data, with age being the overwhelming determinant of OS.
There is controversy regarding the role of sex in thyroid cancer outcome. Some studies have found that male sex is associated with a worse prognosis in younger thyroid cancer patients and others that after controlling for disease severity, male sex does not affect survival (9–12, 30). The survival tree methodology we used allowed us to evaluate interactions between variables. Interestingly, compared with age and stage, the relative importance of sex was small. Sex did play a role in OS, both with SEER and NCDB data, but the importance was diminished compared with the importance of age. For example, male patients aged 62 to 75 years with local or regional stage compared similarly to female patients aged 71 to 75 years with same stage (5-year survival 84% vs 86%, 10-year survival 64% vs 68%). In the NCDB cohort, sex affected outcome only in certain subgroups of patients ≤62 years old. The reason for these sex-specific differences in OS is unclear but may be related to general differences in male vs female life expectancy. Alternatively, others have speculated that estrogen may be protective in younger female patients with thyroid cancer (10, 31).
Our model included a comprehensive set of patient, tumor, and treatment variables and allowed us to prioritize the importance of specific variables in regard to outcome. Previous studies found a relationship between race and thyroid cancer outcome (9). Moreover, recent studies demonstrated controversy in regard to appropriate treatment intensity for thyroid cancer patients (6, 7). However, in this current study, treatment, education, income, rural-urban continuum, race, ethnicity, etc played a minor role in survival.
To obtain a more comprehensive understanding of thyroid cancer outcome, we used both DSS and OS data. Although DSS data are considered the gold standard, some believe that it may underestimate cancer-related deaths (32). It has been shown that death certificate errors can lead to mistakes in the estimation of DSS (32). Also, by using OS for a cancer with a low rate of cancer-specific death, the relative importance of the cancer diagnosis is more evident.
A known limitation of this study is the lack of data on cancer recurrence. Thyroid cancer recurrence is more common than death from thyroid cancer, and the factors that influence recurrence may differ from those that influence survival (33). In addition, inherent to all large national cancer registries, although there is a breadth of information, some details are not available or are clustered together with other variables such as extrathyroidal extension and lymph node metastases, both included within the SEER stage regional. Finally, although treatments are included in the analysis, this is not a randomized control trial, and therefore, the conclusions on the role of treatment are more limited. Despite limitations, similarities of results with SEER and NCDB support the importance of the findings.
This study has clear implications for patients and healthcare providers. The survival tree model offers a new staging tool that will help providers assign individual patients to the appropriate prognostic group and then recommend treatments/monitoring intensity appropriately. With distinct prognostic groups created, our study can be used to inform patients of prognosis and to tailor treatment regimens, with the most aggressive management reserved for higher-risk patients. Similarly, our study results can be used to determine clinical trial eligibility, with better estimates of which patients have greater opportunity for survival benefit.
Acknowledgments
Brittany Gay assisted with manuscript preparation.
M.R.H. is funded by 1K07CA154595-03. M.B. is funded by 1R21CA152775-02. M.P. is funded by 5T32DK7245-37.
M.R.H. and M.B. had full access to all of the data in the study and take responsibility for the integrity of the data and the accuracy of the data analysis. Some of the data used in this study are derived from a deidentified NCDB file. The American College of Surgeons and the Commission on Cancer have not verified and are not responsible for the analytic or statistical methodology employed or the conclusions drawn from these data by the investigators.
Disclosure Summary: The authors have no conflicts of interest to disclose.
Footnotes
- AHR
- adjusted HR
- CI
- confidence interval
- DSS
- disease-specific survival
- HR
- hazard ratio
- NCDB
- National Cancer Data Base
- OS
- overall survival
- RAI
- radioactive iodine
- SEER
- Surveillance, Epidemiology, and End Results Program.
References
- 1. Common cancer types. National Cancer Institute at the National Institutes of Health website. http://www.cancer.gov/cancertopics/types/commoncancers Accessed July 6, 2014
- 2. The American Cancer Society. Available at: www.cancer.org Accessed July 2, 2014
- 3. Hundahl SA, Fleming ID, Fremgen AM, Menck HR. A National Cancer Data Base report on 53,856 cases of thyroid carcinoma treated in the U.S., 1985–1995 [see comments]. Cancer. 1998;83(12):2638–2648 [DOI] [PubMed] [Google Scholar]
- 4. Jung TS, Kim TY, Kim KW, et al. Clinical features and prognostic factors for survival in patients with poorly differentiated thyroid carcinoma and comparison to the patients with the aggressive variants of papillary thyroid carcinoma. Endocr J. 2007;54(2):265–274 [DOI] [PubMed] [Google Scholar]
- 5. Jonklaas J, Sarlis NJ, Litofsky D, et al. Outcomes of patients with differentiated thyroid carcinoma following initial therapy. Thyroid. 2006;16(12):1229–1242 [DOI] [PubMed] [Google Scholar]
- 6. Haymart MR, Banerjee M, Stewart AK, Koenig RJ, Birkmeyer JD, Griggs JJ. Use of radioactive iodine for thyroid cancer. JAMA. 2011;306(7):721–728 [DOI] [PMC free article] [PubMed] [Google Scholar]
- 7. Haymart MR, Banerjee M, Yang D, et al. Variation in the management of thyroid cancer. J Clin Endocrinol Metab. 2013;98(5):2001–2008 [DOI] [PMC free article] [PubMed] [Google Scholar]
- 8. Haymart MR, Banerjee M, Yang D, Stewart AK, Koenig RJ, Griggs JJ. The role of clinicians in determining radioactive iodine use for low-risk thyroid cancer. Cancer. 2013;119(2):259–265 [DOI] [PMC free article] [PubMed] [Google Scholar]
- 9. Johnston LE, Tran Cao HS, Chang DC, Bouvet M. Sociodemographic predictors of survival in differentiated thyroid cancer: results from the SEER database. ISRN Endocrinol. 2012;2012:384707. [DOI] [PMC free article] [PubMed] [Google Scholar]
- 10. Jonklaas J, Nogueras-Gonzalez G, Munsell M, et al. The impact of age and gender on papillary thyroid cancer survival. J Clin Endocrinol Metab. 2012;97(6):E878–E887 [DOI] [PMC free article] [PubMed] [Google Scholar]
- 11. Oyer SL, Smith VA, Lentsch EJ. Sex is not an independent risk factor for survival in differentiated thyroid cancer. Laryngoscope. 2013;123(11):2913–2919 [DOI] [PubMed] [Google Scholar]
- 12. Nilubol N, Zhang L, Kebebew E. Multivariate analysis of the relationship between male sex, disease-specific survival, and features of tumor aggressiveness in thyroid cancer of follicular cell origin. Thyroid. 2013;23(6):695–702 [DOI] [PMC free article] [PubMed] [Google Scholar]
- 13. Surveillance, Epidemiology, and End Results Program. National Cancer Institute website. www.seer.cancer.gov Accessed July 2, 2014
- 14. American College of Surgeon Cancer Programs. American College of Surgeons website. http://www.facs.org/cancer/ncdb/ Accessed January 13, 2014
- 15. Bilimoria KY, Stewart AK, Winchester DP, Ko CY. The National Cancer Data Base: a powerful initiative to improve cancer care in the United States. Ann Surg Oncol. 2008;15(3):683–690 [DOI] [PMC free article] [PubMed] [Google Scholar]
- 16. Banerjee M, George J, Song EY, Roy A, Hryniuk W. Tree-based model for breast cancer prognostication. J Clin Oncol. 2004;22(13):2567–2575 [DOI] [PubMed] [Google Scholar]
- 17. LeBlanc M, Crowley J. Relative risk trees for censored survival data. Biometrics. 1992;48(2):411–425 [PubMed] [Google Scholar]
- 18. Banerjee M, Noone AM. Tree-based methods for survival data. In: Biswas A, Datta S, Fine JP, Segal MR, ed. Statistical Advances in the Biomedical Sciences. Hoboken, NJ: Wiley; 2008:265–285 [Google Scholar]
- 19. Banerjee M, Ding Y, Noone AM. Identifying representative trees from ensembles. Stat Med. 2012;31(15):1601–1616 [DOI] [PubMed] [Google Scholar]
- 20. Breiman L, Frieman JH, Olshen RA, Stone CJ. Classification and Regression Trees. Belmont, CA: Wadsworth; 1984 [Google Scholar]
- 21. LeBlanc M. Tree-based methods for prognostication stratification. In: Crowley J, ed. Handbook of Statistics in Clinical Oncology. New York, NY: Marcel Drekker; 2001:457–472 [Google Scholar]
- 22. Breiman L. Random forests. Machine Learning. 2001;45:5–32 [Google Scholar]
- 23. Ishwaran H, Kogalur UB, Blackstone EH, Lauer MS. Random survival forests. Ann Appl Statist. 2008;2:841–860 [Google Scholar]
- 24. Ishwaran H, Kogalur UB. Random Survival Forest. R Package [computer program]. Version 3.2.2. http://cran.r-project.org; 2008 [DOI] [PMC free article] [PubMed]
- 25. Therneau TM, Atkinson EJ. An Introduction to Recursive Partitioning Using the RPART Routines. http://cran.r-project.org/web/packages/rpart/vignettes/longintro.pdf Accessed July 2, 2014
- 26. Edge S, Byrd DR, Compton CC, Fritz AG, Greene FL, Trotti A, eds. AJCC Cancer Staging Manual. 7th ed New York, NY: Springer-Verlag; 2010 [Google Scholar]
- 27. Hay ID, Bergstralh EJ, Goellner JR, Ebersold JR, Grant CS. Predicting outcome in papillary thyroid carcinoma: development of a reliable prognostic scoring system in a cohort of 1779 patients surgically treated at one institution during 1940 through 1989. Surgery. 1993;114(6):1050–1057; discussion 1057–1058 [PubMed] [Google Scholar]
- 28. Verburg FA, Mäder U, Tanase K, et al. Life expectancy is reduced in differentiated thyroid cancer patients ≥45 years old with extensive local tumor invasion, lateral lymph node, or distant metastases at diagnosis and normal in all other DTC patients. J Clin Endocrinol Metab. 2013;98(1):172–180 [DOI] [PubMed] [Google Scholar]
- 29. Yang L, Shen W, Sakamoto N. Population-based study evaluating and predicting the probability of death resulting from thyroid cancer and other causes among patients with thyroid cancer. J Clin Oncol. 2013;31(4):468–474 [DOI] [PubMed] [Google Scholar]
- 30. Hsieh SH, Chen ST, Hsueh C, Chao TC, Lin JD. Gender-Specific Variation in the Prognosis of Papillary Thyroid Cancer TNM Stages II to IV. Int J Endocrinol. 2012;2012:379097. [DOI] [PMC free article] [PubMed] [Google Scholar]
- 31. Cady B, Sedgwick CE, Meissner WA, Wool MS, Salzman FA, Werber J. Risk factor analysis in differentiated thyroid cancer. Cancer. 1979;43(3):810–820 [DOI] [PubMed] [Google Scholar]
- 32. Hoel DG, Ron E, Carter R, Mabuchi K. Influence of death certificate errors on cancer mortality trends. J Natl Cancer Inst. 1993;85(13):1063–1068 [DOI] [PubMed] [Google Scholar]
- 33. Hollenbeak CS, Boltz MM, Schaefer EW, Saunders BD, Goldenberg D. Recurrence of differentiated thyroid cancer in the elderly. Eur J Endocrinol. 2013;168(4):549–556 [DOI] [PubMed] [Google Scholar]