

Abstract
Context:
Thyroid growth is regulated by TSH and requires mammalian target of rapamycin (mTOR). Thyroid cancers frequently exhibit mutations in MAPK and/or phosphoinositol-3-kinase-related kinase effectors.
Objective:
The objective of the study was to explore the contribution of RET/PTC, RAS, and BRAF to mTOR regulation and response to mTOR inhibitors.
Methods:
PCCL3 cells conditionally expressing RET/PTC3, HRASG12V, or BRAFV600E and human thyroid cancer cells harboring mutations of these genes were used to test pathways controlling mTOR and its requirement for growth.
Results:
TSH/cAMP-induced growth of PCCL3 cells requires mTOR, which is stimulated via protein kinase A in a MAPK kinase (MEK)- and AKT-independent manner. Expression of RET/PTC3, HRASG12V, or BRAFV600E in PCCL3 cells induces mTOR but does not entirely abrogate the cAMP-mediated control of its activity. Acute oncoprotein-induced mTOR activity is regulated by MEK and AKT, albeit to differing degrees. By contrast, mTOR was not activated by TSH/cAMP in human thyroid cancer cells. Tumor genotype did not predict the effects of rapamycin or the mTOR kinase inhibitor AZD8055 on growth, with the exception of a PTEN-null cell line. Selective blockade of MEK did not influence mTOR activity of BRAF or RAS mutant cells. Combined MEK and mTOR kinase inhibition was synergistic on growth of BRAF- and RAS-mutant thyroid cancer cells in vitro and in vivo.
Conclusion:
Thyroid cancer cells lose TSH/cAMP dependency of mTOR signaling and cell growth. mTOR activity is not decreased by the MEK or AKT inhibitors in the RAS or BRAF human thyroid cancer cell lines. This may account for the augmented effects of combining the mTOR inhibitors with selective antagonists of these oncogenic drivers.
Control of thyroid follicular cell growth and thyroid hormone biosynthesis is regulated primarily by TSH, acting via cAMP. TSH-induced cell growth requires concomitant ligand-activated tyrosine kinase receptor signaling, either through the action of insulin, IGF-1 or epithelial growth factor, for maximal effect (1, 2). Mutations of genes encoding signaling proteins activated by these ligands play prominent roles in the pathogenesis of thyroid neoplasia. For example, autonomously functioning thyroid adenomas are associated with activating mutations of TSHR (thyrotropin receptor) (3) or GSP, the gene encoding the Gsα subunit of the heterotrimeric G protein that couples TSHR to adenylyl cyclase (4). By contrast, gene recombinations that constitutively activate the tyrosine kinase receptors RET or TRK, activating point mutations of RAS genes and of BRAF occur in a nonoverlapping manner in papillary thyroid cancer (PTC), suggesting that effectors signaling along the MAPK pathway play a central role in the pathogenesis of this disease. Roger and coworkers have proposed a model to explain this dual control of thyroid cell growth, whereby tyrosine kinase receptor signaling is required for cyclin D3 biosynthesis, whereas cAMP signaling activates cyclin-dependent kinase-4, thus enabling the assembly and activation of the cyclin D3/cyclin-dependent kinase-4 holoenzyme, leading to Rb phosphorylation and cell cycle progression (5, 6).
The mitogenic response exerted by TSH-cAMP on thyroid follicle cells requires mammalian target of rapamycin (mTOR) (7–9). mTOR is a Ser/Thr kinase belonging to the phosphoinositol-3-kinase-related kinase (PI3K) family of signaling proteins. It regulates protein translation, cell size, proliferation, and survival. mTOR exists in two distinct multiprotein complexes: mammalian target of rapamycin complex 1 (mTORC1; mTOR-raptor), which is strongly inhibited by rapamycin, and mammalian target of rapamycin complex 2 (mTORC2; mTOR-rictor), which is not directly affected by the drug. Because rapamycin is not able to bind rictor, it has been used to probe the biological functions of mTORC1 (10). Upon activation, mTORC1 increases mRNA translation via activation of p70 S6 kinase (S6K) and inhibition of eukaryotic translation initiation factor 4E binding protein 1 (4EBP1). In mammalian cells, mTOR plays an important role in signaling pathways that respond to growth factors and nutrients (11). Extracellular signals, such as growth factors and hormones, modulate mTORC1 complex activity primarily through the activation of MAPK and PI3K. Components of these two signaling cascades are interconnected and converge on the common mTOR axis. mTOR activity is constricted by negative regulation of the PI3K pathway via S6K. Moreover, when mTOR is assembled into the mTORC2 complex, it directly phosphorylates and activates AKT, thus placing AKT upstream and downstream of the mTOR signaling network (12). In many cancers the mTORC2-dependent activation of AKT provides a mechanism of resistance to rapalogs (12). Recently a number of mTOR kinase inhibitors (reviewed in reference 13) that block both the mTORC1 and mTORC2 complexes have been developed and in some cases have greater efficacy than rapalogs (14). The existence of a link between mTOR inhibition and ERK activation adds additional complexity to the regulation of the mTOR/S6K pathway (15–17).
In immortalized nontransformed rat thyroid cell lines, TSH induces mTOR activity through protein kinase A (PKA) (6, 8). However, most thyroid cancers partially or completely lose the dependence on TSH and cAMP for growth, and likely for mTOR activity (18). Despite this, human PTCs have increased levels of p70S6K, consistent with higher TOR activity (19, 20). mTOR is a critical effector in the MAPK and PI3K signaling networks, which are deregulated in thyroid cancer. As mentioned, mutations of RET, RAS, and BRAF are found in approximately 70% of PTCs (21, 22). Germline PTEN mutations or the down-regulation of phosphatase and tensin homolog deleted on chromosome 10 (PTEN) expression occurs in approximately 40% of well-differentiated thyroid carcinomas and in greater than 50% of highly malignant thyroid cancers (23, 24), whereas point mutations and/or copy number changes of PIK3CA and AKT1 are found in anaplastic thyroid cancers and in metastatic thyroid cancers, respectively (25–27). Moreover, coexisting mutations of the PI3K and MAPK pathways have been reported in anaplastic thyroid carcinomas (26).
It is conceivable that many thyroid cancers, as part of the development of oncogene addiction, may have switched upstream control of mTOR activity from TSH-cAMP-PKA to either RAS-RAF-MAPK and/or PI3K/AKT. Here we compared the pathways controlling mTOR activity in PCCL3 cells before and immediately after expression of key thyroid oncoprotein drivers and found that this was indeed the case. We then explored the signaling pathways playing regulatory roles upstream of mTOR in a large panel of human thyroid cancer cell lines harboring endogenous mutations in these same genes. We found that the cancer cell genotype failed to predict for signaling dependence of mTOR. Accordingly, mTORC1 inhibition with rapamycin or a mTOR kinase inhibitor decreased cell growth with variable efficiency, which was not predicted by genotype, with the possible exception of PTEN loss of function, consistent with findings in other cell lineages (28–30). Feedback adaptations to monotherapy with rapalogs, as well as other targeted monotherapies, point to the need for combination therapies with selective MAPK and PI3K pathway inhibitors, which elicited enhanced growth inhibitory effects in all of the thyroid cancer cell lines we tested.
Materials and Methods
Reagents
Rapamycin was from Calbiochem or EMD Chemicals Inc and was dissolved in dimethyl sulfoxide (DMSO) at concentration of 1 mM. U0126 was purchased from Promega and was dissolved in DMSO at a concentration of 10 mM. Stock solutions were diluted to the desired concentrations with growth media just before use. KT5720, an inhibitor of PKA, was purchased from Tocris Bioscience. Fluoromethylketone, an inhibitor of ribosomal S6 kinase (RSK) was purchased from Axon Medchem. AKT inhibitor was provided by Merck Research Laboratories, Merck & Co and is a non-ATP-competitive, PH domain-dependent inhibitor of AKT1 (EC50 3.5 nM) and AKT2 (EC50 42 nM) with less potency against AKT3 (EC50 1900 nM) (31). The MAPK kinase (MEK) inhibitor AZD6244 and mTOR inhibitor AZD8055 were provided by Astra Zeneca. Bovine TSH, insulin, apotransferrin, hydrocortisone, doxycycline, BSA, and 8-bromoadenosine-cAMP (8-Br-cAMP) were from Sigma.
Rabbit polyclonal antibodies against phosphorylated (p) AKT (S473), total AKT, pRSK1 (S380), total RSK1, prS6 (S235/236), total ribosomal S6 protein (rS6), p4EBP1 (Thr37/46), total 4EBP1, and pMEK were from Cell Signaling Technology. The following antibodies were purchased from Santa Cruz Biotechnology, Inc: S6K (sc-8418), ERK (sc-94), pERK1/2 (sc-7383), Harvey rat sarcoma viral oncogene homolog (HRAS) (sc-520), and RET (sc-167). Mouse monoclonal antibodies against α-tubulin and Myc (4A6) were from Sigma and Upstate Technology, respectively. The phosphorylated form of pS6kinase (pS6K) (T389) was from Epitomics, Inc.
Cell lines
The human thyroid cancer cell lines (described in Supplemental Table 1) FRO, WRO, 8505C, C643, KTC-1, Cal62, Hth83, Hth104, and SW1736 were maintained in RPM-I 1640 supplemented with 10% fetal bovine serum (FBS), 2 mmol/L L-glutamine, and 100 U/mL penicillin/streptomycin. TPCI and OCUT-2 cells were grown in DMEM with high glucose containing 5% FBS. FTC-133 cells were grown in DMEM-HG F12 supplemented with 10% FBS. BHT-101 were maintained in MEM supplemented with 20% FBS. PCCL3 RET/PTC3–5, HRAS-25, and BRAF 9.6 are derived from well-differentiated, nontransformed rat thyroid PCCL3 cells and conditionally express RET/PTC3, HRASG12V, and BRAFV600E, respectively, in a doxycycline-dependent manner (32–34). To induce oncogenic RET/PTC3, HRASG12V, and BRAFV600E, cells were exposed to doxycycline (1 μg/mL) for 24 hours. The PCCL3 cells were propagated in Coon's/H4 + serum (Supplemental Table 2) and the stably transfected derivatives of PCCL3 cells in Coon's/H4 + serum with G418 (300 μg/mL) and hygromycin (114 μg/mL).
Western blotting
Cells were lysed at 4°C using a buffer A (20 mmol/L Tris HCl, pH 7.5; 150 mmol/L NaCl; 1% Triton X-100; 10 mmol/L sodium fluoride; 1 mmol/L EDTA; 1 mmol/L EGTA) or buffer B (9 mM Tris, pH 7.5; 3.6 mM EGTA; 4.5 mM EDTA; 1% Triton X-100) containing protease inhibitor cocktail, phosphatase inhibitor cocktail 1, and cocktail 2 (Sigma). Protein yield was quantified by a Bradford assay (Bio-Rad Laboratories). The total protein lysates were denatured by boiling in Laemli sample buffer and β-mercaptoethanol. Equivalent amounts of protein (30 μg) were separated by SDS-PAGE gel electrophoresis and blotted onto a nitrocellulose membrane (Amersham Biosciences), and loading was confirmed by staining membranes with Ponceau-S (Sigma). Blots were probed with the indicated primary antibodies and then with species-specific horseradish peroxidase-conjugated secondaries. Antigens were revealed by an enhanced chemiluminescence detection kit (ECL; Amersham GE Healthcare, British Technology).
Bromo-deoxyuridine (BrdU) uptake assay
Cells were incubated with BrdU (BD Sciences) for 24 hours, collected by trypsinization, and fixed with 70% ethanol. Cells were then incubated with 2 N HCl to denature DNA and neutralized with 0.1 mol/L sodium borate (pH 8.5). After labeling with fluorescein isothiocyanate-conjugated anti-BrdU antibody (fluorescein isothiocyanate BrdU flow kits; BD Pharmingen), the percentage of BrdU-positive cells was determined by a fluorescence-activated cell sorting analysis (Coulter EPICS; Beckman Coulter).
Growth curves
PCCL3 and human thyroid carcinoma cells (60 000/well) were seeded in triplicate into six-well plates. The next day the cells were incubated with 8-Br-cAMP 1 mM + vehicle (DMSO 0.1%), rapamycin 20 nM, KT-5720 10 μM, or vehicle using the indicated media. Cells were collected by trypsinization and counted every 2 days. For combination experiments, vehicle (DMSO) and/or rapamycin and/or AZD6244 and/or AZD8055 and/or AKT1/2 inhibitor was added at the indicated concentration and incubated for the indicated time. Growth media containing the inhibitors alone or in combination were changed every 24 hours. The cells were collected by trypsinization and counted every day. Cell viability was assessed by trypan blue dye exclusion in a Vi-CELL cell viability analyzer (Beckman Coulter, Inc).
Tumor xenografts
Female Hsd-Athymic Nude-Foxn1nu mice (Harlan Laboratories) of approximately 5–6 weeks of age were injected sc in the right flank with 2 × 10⁶ Hth83 or BHT101 cells suspended in PBS. Treatment was initiated when tumor volume approached approximately 150 mm3 for Hth83 or approximately 400 mm3 for BHT101 as estimated by measuring the length and width with calipers (width2 × length × 0.52). Tumor-bearing mice were randomly assigned into four groups consisting of a control group (vehicle only), an AZD8055 group, an AZD6244 group, and a combination group. Mice were weighed at the start of treatment and every other day during the course of therapy. AZD8055 and AZD6244 were dissolved in a mixture of 0.5% hydroxypropyl-methylcellulose (Sigma-Aldrich) and 0.1% polysorbate 80 (Tween-80; Sigma-Aldrich) to concentrations of 20 mg/kg and 25 mg/kg, respectively. Treatments were administered by oral gavage in a volume of approximately 100 μL using a sterile animal feeding needle. A dose of AZD8055 was 20 mg/kg once daily and a dose of AZD6244 was 25 mg/kg once daily. Tumor volume was measured every other day with calipers. After 24 days of treatment or when the tumor became larger than 2000/mm3 mice were humanely killed. After euthanasia the tumors were dissected out and a representative fragment fixed in paraformaldehyde with the remainder flash frozen for subsequent protein isolation. All animal experiments were performed in accordance with a protocol approved by the Institutional Animal Care and Use of Committee of Memorial Sloan Kettering Cancer Center.
Statistical analysis
All data are presented as mean ± SD. Statistical significance was determined without the assumption of equal variance using Welch's modification of the t test. To account for multiple testing, statistical significance was determined using the Holm-Sidak method, with α = 5%. The interactions between AZD8055 and AZD6244 were evaluated by calculating combination index (CI) using CompuSyn program (ComboSyn). The CI equal to 1 means additive effect, CI above 1 means antagonism, and CI below 1 means synergism (20).
Results
cAMP/TSH induces mTOR activity via PKA in PCCL3 cells, which is required for growth stimulation
As shown in Figure 1A, PCCL3 cells grow only in the presence of TSH or cAMP, and this TSH/cAMP dependency was abolished by treatment with the mTORC1 inhibitor, rapamycin, or with the PKA inhibitor, KT5720. To better understand the signaling pathways involved in cAMP-mediated mTOR activation, we evaluated the phosphorylation status of mTOR substrates after exposure to the cAMP analog, 8-bromoadenosine-cAMP, in combination with different concentrations of the PKA inhibitor, KT5720. As shown in Figure 1B, cAMP induced the phosphorylation of AKT, S6K, and ribosomal S6 protein (rS6) as well as 4EBP1, and this was inhibited by KT5720 in a dose-dependent manner. We observed similar inhibitory effects of KT5720 on the phosphorylation of mTOR substrates in cells continuously exposed to TSH (Figure 1C). This suggests that TSH-mediated mTOR activation occurs through cAMP in a PKA-dependent manner. Because both the MAPK and PI3K pathways may converge to activate mTOR, we next examined the relative contribution of MEK and AKT1/2 in regulating TSH/cAMP-induced mTOR activity in PCCL3 cells. As shown in Figure 1, D and E, neither the MEK inhibitor U0126 (Figure 1E) nor the AKT 1/2 inhibitor alone (Figure 1D) prevented cAMP induction of mTOR signaling, indicating that cAMP/TSH-induced mTOR activation is dependent on PKA but not to a significant extent on MEK-ERK or AKT.
Figure 1.

TSH-induced growth requires mTOR, whose activity is regulated via PKA in a MEK- and AKT-independent manner. A, Effects of rapamycin and the PKA inhibitor KT5720 on TSH or cAMP-induced cell growth of PCCL3 cells. Cells were grown in Coon's/H3 + serum for 24 hours and then treated with 10 mIU/mL TSH (H4) or 8-Br-cAMP (1 mM) with or without rapamycin (20 nM) and/or the PKA inhibitor KT5720 (10 μM). Data represent the mean ± SD of triplicate cell counts at the indicated time points. B and C, PKA inhibition blocks cAMP- or TSH-induced mTOR signaling. B, Cells were incubated in Coon's/H3 + serum for 48 hours, incubated for a further 24 hours in Coon's/H2 − serum, and then treated for 60 minute with 1 mM 8-Br-cAMP alone or after a 30-minute pretreatment with the indicated concentrations of KT5720. C, Cells were plated in Coon's/H4 + serum for 24 hours and then incubated for 30 minutes with the indicated concentrations of KT5720. D and E, cAMP induction of mTOR does not require MEK or AKT activation. D, Cells were grown as in panel B and pretreated with rapamycin (20 nM) and/or AKT1/2 inhibitor (1 μM) for 30 minutes before the addition of 1 mM 8-Br-cAMP. E, Cells were grown as in panel B pretreated with rapamycin (20 nM) and/or U0126 (25 μM) for 30 minutes prior to the addition of 8-Br-cAMP for 60 minutes. Cells were lysed in buffer A and lysates analyzed by Western blotting with the indicated antibodies. Please see Supplemental Table 2 for details on culture media used in these experiments. Densitometry results for the Western blots can be found in Supplemental Figure 4.
Rapamycin suppresses DNA synthesis induced by RET/PTC3, HRASG12V, and BRAFV600E in rat PCCL3 cells
RET/PTC, RAS, and BRAF mutations are highly prevalent in thyroid cancer and are believed to be involved in tumor initiation. We next examined whether mTOR also mediates the growth-promoting effects of these oncoproteins in PCCL3 cells. As shown in Figure 2A, doxycycline-inducible expression of all three oncoproteins induced DNA synthesis at 24 hours in a rapamycin-sensitive manner, indicating a requirement for mTORC1 activation. Accordingly, mTOR activity as determined by phosphorylation of the S6 kinase was also markedly increased after oncogene expression, and this was inhibited by rapamycin. Because cell proliferation induced by these oncoproteins requires MAPK and/or PI3K signaling, we next examined the relative contribution of MEK and AKT on mTOR activation in these cells (Figure 2B). RET/PTC3-, HRASG12V-, and BRAFV600E-stimulated mTOR involves both AKT and MEK pathways because each inhibitor alone only partially inhibited the phosphorylation of S6K, albeit to varying degrees, and in all cases combining AKT and MEK inhibitors produced a more profound blocked in oncogene-induced S6K phosphorylation compared with the monotherapy. rS6 phosphorylation was also partially blocked by both MEK and AKT inhibitors, consistent with oncogene-induced activation of S6K being dependent on both pathways. The degree by which each inhibitor reduced rS6 phosphorylation varied between lines and differed between rS6 phosphorylation sites. The latter is likely due to input to rS6 from effectors other than mTOR, which likely varies between cell lines (35). Pretreatment of PCCL3 cells with the PKA antagonist KT5720 did not impair BRAF induction of rS6 or 4EBP1 phosphorylation (Supplemental Figure 1A). Accordingly, PKA inhibition by KT5720 did not block oncoprotein-induced DNA synthesis (Supplemental Figure 2). BRAFV600E, RET/PTC3, and HRASG12V induced 4EBP1 phosphorylation, but this was only modestly inhibited by rapamycin. By contrast, treatment with the allosteric AKT antagonist decreased p4EBP1 in all three cell lines.
Figure 2.

Rapamycin inhibits DNA synthesis induced by RET/PTC3, HRASG12V, or BRAFV600E in rat PCCL3 cells. A, PCCL3 cells modified to express the indicated oncoprotein in a doxycycline-inducible manner were grown in Coon's/H4 + serum and then switched to Coon's/H3 + serum (without TSH) with the indicated serum concentrations for 3 days. Cells were then incubated with 10 μg/mL BrdU for 24 hours with or without 1 μg/mL of doxycycline in the presence or absence of 20 nM rapamycin for 24 hours. BrdU incorporation was analyzed by fluorescence-activated cell sorter. Data represent mean ± SD of six wells. *, P < .05; **, P < .01; ***, P < .001; §, P > .5. B, PCCL3 cells were incubated in Coon's/H3 + serum for 48 hours and then in Coon's − serum for 24 hours. They were then incubated in Coon's − serum with or without 1 μg/mL doxycycline (Dox) for 24 hours. Two hours prior to collection, cells were treated with 20 nM rapamycin, with or without a 30-minute pretreatment with 25 μM U0126 and/or 1 μM AKT1/2 inhibitor (AKTi). Cells were lysed in buffer A and lysates analyzed by Western blotting with the indicated antibodies. Please see Supplemental Table 2 for details on culture media used in these experiments. Densitometry results for the Western blots can be found in Supplemental Figure 5.
We next examined the effects of cAMP on mTOR activity in PCCL3 cells after conditional expression of BRAF or RET/PTC1 for 1 (not shown) or 4 days (Supplemental Figure 1B). rS6 phosphorylation was induced by each of the oncoproteins as well as by cAMP alone. Interestingly, the combination of both stimuli showed additive effects on mTOR activity as determined by prS6 immunoblotting. Taken together, these data indicate that after short-term expression of BRAF or RET/PTC, mTOR activity retains some cAMP responsiveness. This is of interest, in view of the almost universal loss of cAMP responsiveness seen in human cancer cell lines harboring these mutations, as discussed below.
cAMP effects on growth and mTOR activation in human thyroid cancer cell lines
Human thyroid cancer cells lose dependence on TSH for growth. Indeed, expression of the TSH receptor is very low or absent in most thyroid cancer cell lines. As opposed to its growth-promoting effects on normal thyroid cells, treatment of thyroid cancer cell lines with cAMP has been previously shown to have either no effect or to inhibit cell growth (18). As shown in Figure 3A, treatment with 8-Br-cAMP profoundly inhibited the growth of SW1736 and Cal62 cells. After exposure to 8-Br-cAMP, the phosphorylation status of mTOR substrates did not change in any of the cell lines analyzed, either in the presence of normal serum or after serum starvation for 48 hours (Figure 3B), indicating that mTOR in these cells is regulated in a cAMP/PKA-independent manner and that other signaling pathways are likely responsible for controlling its activity.
Figure 3.

cAMP effects on cell growth and mTOR activation in human thyroid cancer cell lines. A, The indicated cells were plated in triplicate in media containing 10% serum. The next day the cells were incubated with 1 mM 8-Br-cAMP or vehicle (0.1% DMSO) for the indicated times prior to cell counting. Data represent the mean ± SD. *, P < .05; **, P < .001. B, The indicated cells were plated in 60-mm dishes and grown in media containing 10% serum (left) or 0.1% BSA (right) for 48 hours and then with 1 mM 8-Br-cAMP for 1 hour. Cells were lysed in buffer A lysates Western blotted with the indicated antibodies. Densitometry results for the Western blots shown in this figure can be found in Supplemental Figure 6.
Rapamycin effects on growth of human thyroid cancer cell lines
Next we tested the effects of rapamycin on the growth of 12 human thyroid cancer cell lines, all but two of which had mutations of genes encoding MAPK and/or PI3K effectors (Figure 4). A rapamycin dose-response curve at 72 hours showed that the growth-inhibitory effect was maximal at 10–20 nM in all cell lines tested (not shown). Rapamycin inhibited the growth of most of these thyroid cancer cell lines, the extent of which was not explainable based on the mutation status of RET, RAS, BRAF, or PIK3CA. However, FTC133 cells, which are PTEN null, were exquisitely sensitive to rapamycin, consistent with data in other cell lineages with PTEN loss of function (29, 30). Treatment with rapamycin for 96 hours resulted in an increase of cells in the G1 phase of the cell cycle in 8 of 10 cell lines analyzed, with a maximal effect in FTC133 cells (not shown). No sub-G1 peak was noted in any cell line. By contrast, the cell cycle distribution in WRO and BHT101 cells was unaffected by rapamycin exposure.
Figure 4.
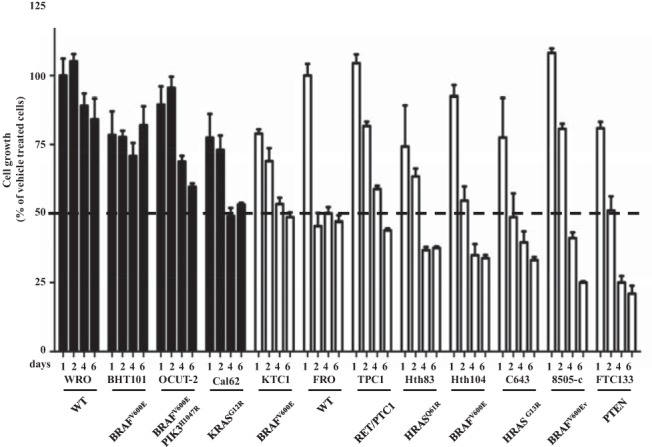
Effect of rapamycin on growth of human thyroid cancer cell lines. The indicated cell lines were grown in media with 10% serum for 24 hours and then incubated with 20 nM rapamycin or vehicle and counted at the indicated times. Bars represent the percentage growth inhibition of the indicated cell lines, with vehicle-treated cells being 100%. Cell lines inhibited by 50% or greater or 50% or less by 6 days are shown in open or black bars, respectively.
Effect of MEK and AKT inhibitors on mTOR activity and growth of human thyroid cancer cell lines harboring PTEN, BRAF, or RAS mutations
Because mTOR integrates growth and survival signals from key oncogenic drivers, we next examined whether mTOR kinase activity and the output of the mTOR pathway were preferentially responsive to inhibitors blocking signals activated by the driver oncoproteins in each cell line (Figure 5). As a readout of mTOR kinase activity, we used pS6K, whereas the mTOR output was determined by the prS6 and 4EBP1 proteins. In the FTC-133 cells, which are homozygous for a PTEN p.R130* mutation, the pS6K and prS6 levels were potently inhibited by the AKT1/2 kinase inhibitor, whereas the MEK inhibitor had no effect (Figure 5B). Despite lacking activity on mTOR substrates, the MEK inhibitor showed modest growth-inhibitory properties in this line, which also showed the greatest sensitivity to growth inhibition by rapamycin (Figure 4) and the intermediate sensitivity to the AKT inhibitor (Figure 5A).
Figure 5.

Effect of concurrent MEK, AKT, and mTORC1 inhibition on cell growth and signaling in human thyroid cancer cell lines. A, The indicated cells were plated overnight in six-well plates in media with 10% serum and then treated with vehicle, 20 nM rapamycin, 500 nM AZD6244, or 1 μM AKT1/2 inhibitor (AKTi) alone or in combination. Data represent the mean ± SD of triplicate cell counts at the indicated time points. B, Western blots of lysates from cells incubated in media with 0.1% BSA for 48 hours and then DMSO, rapamycin (20 nM), U0126 (25 μM), or AKT1/2 inhibitor (1 μM) alone or in combination for 2 hours. Densitometry results for the Western blots show in this figure can be found in Supplemental Figure 7.
As might be predicted, MEK inhibition was associated with greater growth suppression compared with the AKT1/2 inhibitor in the BRAF mutant cell lines Hth104 and BHT101 (Figure 5A). However, MEK inhibition did not impair S6K phosphorylation in either of these cell lines or the phosphorylation at S240/244 prS6 or of p4EBP1. MEK inhibition did reduce rS6 phosphorylation at serine 235/236 in BHT101 cells. This is may be a result of direct phosphorylation of this residue by RSK (34, 35). Consistent with this result, the RSK antagonist fluoromethylketone inhibited serine 235/6 phosphorylation (Supplemental Figure 3).
In C643 cells, which harbor a HRAS mutation, MEK or AKT1/2 inhibition alone had virtually no effect on the S6K or rS6 phosphorylation, whereas the combination of both agents was effective in decreasing mTOR activity. However, other effectors may contribute to mTORC1 activity in this cell line. Indeed, the addition of rapamycin further inhibited the phosphorylation of its substrates and markedly increased the growth-inhibitory effects of MEK and AKT1/2 inhibitors.
AZD8055 and AZD6244 effects on growth and signaling in human thyroid cancer cell lines
Rapamycin efficacy as a growth inhibitor is blunted as a result of mTORC2-mediated phosphorylation and the activation of AKT via the insulin/insulin receptor (12, 36). Because mTOR kinase inhibitors prevent the activation of this feedback pathway, we proceeded to test the activity of the ATP competitive mTOR inhibitor AZD8055 in thyroid cancer cell lines. Incubation with AZD8055 produced a marked decrease in pS6K in all cell lines tested and, in contrast to rapamycin, also reduced pAKT(Y473) levels. AZD8055 did not reduce pERK and in some cases evoked a modest increase (eg, Hth83 cells). Combining AZD8055 and AZD6244 resulted in a marked reduction in pS6K, prS6, pAKT, pMEK, and pERK (Figure 6A). Overall, AZD8055, as a single agent, was more effective than rapamycin, partially in cell lines resistant to the mTORC1 inhibitor (ie, BHT101, Cal62, KTC1) (Figure 6B).
Figure 6.

Effect of concurrent MEK and mTORC1/2 inhibition on cell growth and signaling in human thyroid cancer cell lines. A, Cells were incubated in media with 0.1% BSA for 48 hours and then incubated with DMSO, AZD8055 (500 nM), or AZD6244 (100 nM) alone or in combination for 2 hours. Cell lysates were Western blotted with the indicated antibodies. B, The indicated cells were plated overnight in six-well plates in media with 10% serum and then treated with vehicle or the indicated concentration of AZD8055 and/or AZD6244. Top, Mean ± SD of triplicate cell counts at the indicated time points. Bottom, CI at the indicated concentrations of AZD8055 and AZD6244. C and D, Mice harboring xenographs of the indicated cell lines were treated with vehicle, AZD6244 (25 mg/kg · d), or AZD8055 (20 mg/kg·d) alone or in combination. C, Tumor volume at the indicated times. *, P < .003 for comparison between AZD6244 and the combination. D, Western blots of tumor lysates removed 6 hours after receiving the final dose of compound. Please see Supplemental Table 2 for details on culture media used in these experiments. Densitometry results for the Western blots can be found in Supplemental Figure 8.
We next examined the efficacy of the AZD8055/AZD6244 combination in vivo. Treatment of mice harboring xenografts of the HRAS mutant Hth83 or the BRAF mutant BHT101 cells with AZD8055 and/or AZD6244 showed that the combination was more effective than either agent alone, particularly in BHT101 cells (Figure 6C). Western blots for pS6K, prS6, pAKT, pMEK, and pERK confirmed that the combination inhibited all three signaling pathways (mTOR, AKT, and MAPK). Notably, the inhibition of mTOR effectors was greater with the combination than with the mTOR kinase inhibitor alone (Figure 6D).
Discussion
Thyroid cell proliferation is regulated by TSH-cAMP signaling acting synergistically with other growth factors, particularly those belonging to the IGF family. Moreover, TSH-mediated mitogenesis requires mTOR activity both in vitro (8) and in vivo (37). However, the effectors that transduce signals from TSHR to mTOR remain incompletely characterized and the data to date conflicting (1, 6, 7, 37–39, 41). In thyroid cancer cell lines, mTORC1 activity has also been shown to play a role in controlling cell growth, particularly in cells with genetic alterations of the PI3K pathway (42). However, most thyroid cancers and cancer cell lines do not have PTEN, PIK3CA, or AKT1 mutations, and the effector pathway(s) mediating mTOR activation and dependency for growth has not, to our knowledge, been previously explored.
In the present study, we show that thyroid cancer cells switch the signaling control upstream of mTOR away from the TSH/cAMP/PKA dependency seen in nontransformed thyroid cells. Consistent with previous observations in other differentiated rat thyroid cell lines, we found that mTOR activity is induced by cAMP/TSH in PCCL3 cells and that this activation is required for TSH-dependent cell growth (8). TSH-induced mTOR activation is PKA dependent and does not require MAPK and/or AKT. We did observe an increase in pS473AKT after cAMP addition. Prior studies on the effects of cAMP on AKT activity show conflicting results (9, 43–47). This may be dependent on cell type and culture conditions, but the primary differences are likely due to the kinetics of regulation. In particular, Lou et al (46) found that forskolin inhibits pAKT with a nadir at 10 minutes, followed by recovery 60 minutes after exposure.
Most likely our results reflect a rebound from the inhibitory effects of cAMP because we used a 60-minute time point. Although a positive cross talk between TSH/cAMP and PI3K/ERK pathways has been reported to mediate mTOR activation (2, 39, 43), we have found that cAMP-induced activation of mTOR was not significantly blocked by AKT or MEK inhibitors. Accordingly, TSH-induced mitogenic effects were primarily PKA dependent and did not require MEK or AKT activation. The molecular mechanisms of mTOR stimulation by TSH/cAMP in PCCL3 cells have been investigated in detail by Blancquaert et al (6), who also found that this takes place in the absence of AKT/ERK activation. PRAS40 is a substrate of PI3K, which phosphorylates it at T246, leading to its dissociation from mTOR. This favors mTOR activation by allowing it to bind to its substrates. Moreover, Blancquaert et al proposed that PRAS40 may be a direct substrate of PKA, based on its ability to phosphorylate T246 and other sites in vitro (6), providing one plausible mechanism for the activation of mTOR by TSH-cAMP signaling.
Some of the mitogenic effects of cAMP in normal thyroid cells are exerted via exchange proteins activated by cAMP activation of the G protein Rap1 (49–51). Rap1 in turn activates BRAF and hence MAPK signaling. To our knowledge the contribution of Rap1 to mTOR activation in thyroid cells has not been explored, and this was not an objective of our study. However, the fact that MEK inhibition had no effect on cAMP-induced mTOR activity suggests that canonical signaling by Rap1 does not mediate this effect.
Unlike wild-type thyrocytes, we found that thyroid cancer cells do not grow in response to TSH, forskolin, or cAMP, as also shown by others (18). Moreover, they do not require PKA for mTOR activity. Despite this, we and others have found that basal mTOR/S6K/rS6 activity is high in most thyroid cancer cell lines (20), which is also the case in human thyroid cancer tissue specimens (19), indicating that mTOR is under control of other inputs. Likely candidates include the PI3K and MAPK pathways because both are frequently deregulated in thyroid tumorigenesis. Indeed, constitutive PI3K activation in mice lacking PTEN results in goiter formation, which is not further accentuated by TSH hyperstimulation (52). This effect requires mTORC1 activity because it is inhibited by the rapamycin analog RAD001 (38). The comparison of TSH-cAMP dependency of mTOR signaling in nontransformed vs cancer cell lines could also be affected by the species difference because rat and human thyroid cells respond differently to TSH stimulation (53). Santoro et al (54) showed that clonal selection of PCCL3 cells stably expressing RET/PTC1 did indeed become TSH independent for growth, supporting the validity of our observations.
Consistent with this, we found that conditional the expression of the oncoproteins RET/PTC, HRASG12V, and BRAFV600E in PCCL3 cells induced mTOR activity in a MEK- and AKT-dependent manner and that mTOR was required for DNA synthesis induced by all three thyroid oncoproteins. Interestingly, the expression of BRAF or RET/PTC for 24 or 96 hours in PCCL3 cells did not abrogate the ability of cAMP to activate mTOR. This indicates that the switch from cAMP-dependent to cAMP-independent control of mTOR activity does not happen as a short-term consequence of oncoprotein activation. This was an unexpected finding because we previously showed that the acute expression of RET/PTC3 impairs adenylyl cyclase activity and cAMP-induced DNA synthesis (34). Most human thyroid cancer cell lines harboring mutations of genes encoding MAPK and/or PI3K effectors are unresponsive to cAMP/TSH, suggesting events taking place during tumor evolution, not yet identified, may play a role in rendering mTOR activity, and presumably its mitogenic effects, unresponsive to PKA control. This is also consistent with what is seen in the clinic because patients with advanced forms of papillary thyroid cancer and all anaplastic thyroid cancers entirely lose TSH dependence for growth.
Altogether these findings suggest that, regardless of the genetic mutation status, mTOR may represent a suitable target for pharmacological intervention in thyroid cancers in which mTOR signaling and/or the pathways linked to it are deregulated. Clinical studies of other cancers using mTOR inhibitors as monotherapy have been disappointing (55), with the possible exception of advanced renal cell carcinomas (56), neuroendocrine tumors (57), cancers with PTEN loss of function (29), or bladder cancers with inactivating mutations of the tuberous sclerosing complex gene (TSC) (58). The insensitivity to rapamycin treatment in most other cancers may be due to the fact that rapamycin and its analogs are cytostatic, to the presence of intrinsic or acquired resistance mechanisms (59), to the development of compensatory changes through relief of negative feedback activation of AKT via IRS-1 (12), or of ERK via S6K (17).
The first genetic alteration identified as a predictor of sensitivity to mTORC1 inhibition was PTEN loss of function (29, 30, 61, 62). Accordingly, the only human thyroid cancer cell line with homozygous PTEN deficiency, FTC-133, was highly sensitive to the inhibition by rapamycin, consistent with findings in other lineages with this genetic defect. PTEN loss of function derepresses the PI3K/AKT signaling pathway, which is a key mechanism of activation of mTOR. However, OCUT-2 cells, which have a mutation that constitutively activates the PI3K catalytic subunit, was relatively insensitive to mTOR inhibition. This could be explained by the presence in these cells of a coexisting mutation in BRAF or by the activation of alternative mitogenic pathways that allow cells to escape from the growth-inhibitory effect of rapamycin. As expected, we also found that mTORC1 inhibition was associated with increased S473-AKT phosphorylation, likely due to the relief of feedback on insulin receptor substrate-1, resulting in mTORC2-dependent phosphorylation of AKT because this was not observed with AZD8055 which targets both mTORC1 and mTORC2. Moreover, AZD8055 promotes greater growth inhibition compared with rapamycin in cells with increased pAKT (ie, BHT101), suggesting that the relief of feedback and mTORC2 activation may play a role in mediating resistance to rapamycin in these cells. Recently the whole-genome sequencing of a tumor from a patient with metastatic bladder cancer who had a remarkable response to mTORC1 inhibition revealed the presence of loss-of-function mutations in the TSC1 and NF2 (neurofibromatosis type 2) genes (58), both of which provide key inputs into mTOR (64–67). The role of TSC1 and NF2 in underlying mTOR activation in thyroid neoplasms has not yet been investigated. However, an evaluation of the mTOR pathway in 133 thyroid cancers found higher expression of mTOR cascade proteins in tumor samples compared with normal thyroid tissues (20).
We found that mutations of RET, HRAS, or BRAF did not predict for the signaling pathways controlling mTORC1 in human thyroid cancer cell lines and thus to sensitivity to growth inhibition by rapamycin. Previous studies examining this question have come to disparate conclusions. Jin et al (40, 48) did not find BRAF mutant cell lines to be more sensitive to rapamycin or to BEZ235, a PI3K/mTOR inhibitor, whereas Faustino et al (20) reported that on average thyroid cancer lines harboring oncoproteins known to activate the MAPK pathway were more sensitive to rapamycin than cell lines that did not harbor these mutations. However, this trend was not observed in our set of thyroid cancer cell lines. Liu et al (42) concluded that thyroid cancer cell lines with mutations in the PTEN/PI3K/AKT pathway were preferentially responsive to temsirolimus. We did not find sufficient thyroid cancer cell lines with selective activation of this pathway as the only known genetic lesion (other than FTC133), so we were unable to reach a generalizable conclusion on this point.
In BRAF mutant cell lines such as BHT101 and Hth104 cells, which also harbor a BRAF mutation as the only known genetic abnormality, MEK inhibitors had no effect on mTOR substrates, which were also refractory to inhibition of AKT signaling. BHT101 cells did display a RSK-dependent phosphorylation of S235/236 on S6, but this did not impact phosphorylation at the key serine 240/244 residues. This suggests that in these cells mTOR is responsive to other signaling inputs besides BRAF and/or that relief of feedback by MEK inhibition results in the activation of other growth-promoting effectors (60).
The results of the present study demonstrate that in normal thyrocytes TSH-induced mTOR activation and cell growth are PKA dependent. By contrast, in thyroid cancers, PKA activity is not required for growth or control of mTOR activity. Instead, MAPK and PI3K signaling is often deregulated in these tumor cells. However, blocking their activity is insufficient to completely inhibit mTOR, likely because of other inputs into the pathway. Our findings predict that mTORC1 inhibitors may not be generally effective as monotherapy, with the exception of tumors with selective PTEN loss. Consistent with what others have shown, pS473-AKT phosphorylation was prevented by AZD8055, which blocks mTORC1 and mTORC2, and in many cases proved more effective than rapamycin. However, combination therapies of mTOR inhibitors with compounds that directly target the driver oncoprotein hold significant promise and should be prioritized in the clinic (63). In particular, our data concur with a previous study in the literature showing that a combination of MEK and mTOR inhibition has significant activity in most thyroid cancer cell lines (40, 68).
Acknowledgments
We thank Ms Sasha Clark for valuable technical assistance.
This work was supported by National Institutes of Health Grants RO1-CA50706 and RO1-CA72597, the Margot Pulitzer Foundation, and the Lefkovsky Family Foundation.
Disclosure Summary: The authors have nothing to declare.
Footnotes
- 8-Br-cAMP
- 8-bromoadenosine-cAMP
- BrdU
- bromo-deoxyuridine
- CI
- combination index
- DMSO
- dimethyl sulfoxide
- 4EBP1
- 4E binding protein 1
- HRAS
- Harvey rat sarcoma viral oncogene homolog
- MEK
- mitogen-activated protein kinase kinase
- mTOR
- mammalian target of rapamycin
- mTORC1
- mammalian target of rapamycin complex 1
- mTORC2
- mammalian target of rapamycin complex 2
- p
- phosphorylated
- PI3K
- phosphoinositol-3-kinase-related kinase
- PKA
- protein kinase A
- PTC
- papillary thyroid cancer
- PTEN
- phosphatase and tensin homolog deleted on chromosome 10
- rS6
- ribosomal S6 protein
- pS6K
- phosphorylated form of pS6kinase
- RSK
- ribosomal S6 kinase
- S6K
- S6 kinase
- TSHR
- thyrotropin receptor.
References
- 1. Rivas M, Santisteban P. TSH-activated signaling pathways in thyroid tumorigenesis. Mol Cell Endocrinol. 2003;213:31–45 [DOI] [PubMed] [Google Scholar]
- 2. Vandeput F, Perpete S, Coulonval K, Lamy F, Dumont JE. Role of the different mitogen-activated protein kinase subfamilies in the stimulation of dog and human thyroid epithelial cell proliferation by cyclic adenosine 5′-monophosphate and growth factors. Endocrinology. 2003;144:1341–1349 [DOI] [PubMed] [Google Scholar]
- 3. Parma J, Duprez L, Van Sande J, et al. Somatic mutations in the thyrotropin receptor gene cause hyperfunctioning thyroid adenomas. Nature. 1993;365:649–651 [DOI] [PubMed] [Google Scholar]
- 4. Lyons J, Landis CA, Harsh G, et al. Two G protein oncogenes in human endocrine tumors. Science. 1990;249:655–659 [DOI] [PubMed] [Google Scholar]
- 5. Depoortere F, Van Keymeulen A, Lukas J, et al. A requirement for cyclin D3-cyclin-dependent kinase (cdk)-4 assembly in the cyclic adenosine monophosphate-dependent proliferation of thyrocytes. J Cell Biol. 1998;140:1427–1439 [DOI] [PMC free article] [PubMed] [Google Scholar]
- 6. Blancquaert S, Wang L, Paternot S, et al. cAMP-dependent activation of mammalian target of rapamycin (mTOR) in thyroid cells. Implication in mitogenesis and activation of CDK4. Mol Endocrinol. 2010;24:1453–1468 [DOI] [PMC free article] [PubMed] [Google Scholar]
- 7. Cass LA, Meinkoth JL. Ras signaling through PI3K confers hormone-independent proliferation that is compatible with differentiation. Oncogene. 2000;19:924–932 [DOI] [PubMed] [Google Scholar]
- 8. Cass LA, Meinkoth JL. Differential effects of cyclic adenosine 3′,5′-monophosphate on p70 ribosomal S6 kinase. Endocrinology. 1998;139:1991–1998 [DOI] [PubMed] [Google Scholar]
- 9. Cass LA, Summers SA, Prendergast GV, Backer JM, Birnbaum MJ, Meinkoth JL. Protein kinase A-dependent and -independent signaling pathways contribute to cyclic AMP-stimulated proliferation. Mol Cell Biol. 1999;19:5882–5891 [DOI] [PMC free article] [PubMed] [Google Scholar]
- 10. Bjornsti MA, Houghton PJ. The TOR pathway: a target for cancer therapy. Nat Rev Cancer. 2004;4:335–348 [DOI] [PubMed] [Google Scholar]
- 11. Dann SG, Selvaraj A, Thomas G. mTOR Complex1-S6K1 signaling: at the crossroads of obesity, diabetes and cancer. Trends Mol Med. 2007;13:252–259 [DOI] [PubMed] [Google Scholar]
- 12. O'Reilly KE, Rojo F, She QB, et al. mTOR inhibition induces upstream receptor tyrosine kinase signaling and activates Akt. Cancer Res. 2006;66:1500–1508 [DOI] [PMC free article] [PubMed] [Google Scholar]
- 13. Schenone S, Brullo C, Musumeci F, Radi M, Botta M. ATP-competitive inhibitors of mTOR: an update. Curr Med Chem. 2011;18:2995–3014 [DOI] [PubMed] [Google Scholar]
- 14. Breuleux M, Klopfenstein M, Stephan C, et al. Increased AKT S473 phosphorylation after mTORC1 inhibition is rictor dependent and does not predict tumor cell response to PI3K/mTOR inhibition. Mol Cancer Ther. 2009;8:742–753 [DOI] [PMC free article] [PubMed] [Google Scholar]
- 15. Manning BD, Cantley LC. AKT/PKB signaling: navigating downstream. Cell. 2007;129:1261–1274 [DOI] [PMC free article] [PubMed] [Google Scholar]
- 16. Sarbassov DD, Ali SM, Sengupta S, et al. Prolonged rapamycin treatment inhibits mTORC2 assembly and Akt/PKB. Mol Cell. 2006;22:159–168 [DOI] [PubMed] [Google Scholar]
- 17. Carracedo A, Ma L, Teruya-Feldstein J, et al. Inhibition of mTORC1 leads to MAPK pathway activation through a PI3K-dependent feedback loop in human cancer. J Clin Invest. 2008;118:3065–3074 [DOI] [PMC free article] [PubMed] [Google Scholar]
- 18. Rocha AS, Paternot S, Coulonval K, Dumont JE, Soares P, Roger PP. Cyclic AMP inhibits the proliferation of thyroid carcinoma cell lines through regulation of CDK4 phosphorylation. Mol Biol Cell. 2008;19:4814–4825 [DOI] [PMC free article] [PubMed] [Google Scholar]
- 19. Miyakawa M, Tsushima T, Murakami H, Wakai K, Isozaki O, Takano K. Increased expression of phosphorylated p70S6 kinase and Akt in papillary thyroid cancer tissues. Endocr J. 2003;50:77–83 [DOI] [PubMed] [Google Scholar]
- 20. Faustino A, Couto JP, Populo H, et al. mTOR pathway overactivation in BRAF mutated papillary thyroid carcinoma. J Clin Endocrinol Metab. 2012;97:E1139–E1149 [DOI] [PubMed] [Google Scholar]
- 21. Kimura ET, Nikiforova MN, Zhu Z, Knauf JA, Nikiforov YE, Fagin JA. High prevalence of BRAF mutations in thyroid cancer: genetic evidence for constitutive activation of the RET/PTC-RAS-BRAF signaling pathway in papillary thyroid carcinoma. Cancer Res. 2003;63:1454–1457 [PubMed] [Google Scholar]
- 22. Soares P, Trovisco V, Rocha AS, et al. BRAF mutations and RET/PTC rearrangements are alternative events in the etiopathogenesis of PTC. Oncogene. 2003;22:4578–4580 [DOI] [PubMed] [Google Scholar]
- 23. Gimm O, Perren A, Weng LP, et al. Differential nuclear and cytoplasmic expression of PTEN in normal thyroid tissue, and benign and malignant epithelial thyroid tumors. Am J Pathol. 2000;156:1693–1700 [DOI] [PMC free article] [PubMed] [Google Scholar]
- 24. Halachmi N, Halachmi S, Evron E, et al. Somatic mutations of the PTEN tumor suppressor gene in sporadic follicular thyroid tumors. Genes Chromosomes Cancer. 1998;23:239–243 [DOI] [PubMed] [Google Scholar]
- 25. Hou P, Liu D, Shan Y, et al. Genetic alterations and their relationship in the phosphatidylinositol 3-kinase/Akt pathway in thyroid cancer. Clin Cancer Res. 2007;13:1161–1170 [DOI] [PubMed] [Google Scholar]
- 26. Garcia-Rostan G, Costa AM, Pereira-Castro I, et al. Mutation of the PIK3CA gene in anaplastic thyroid cancer. Cancer Res. 2005;65:10199–10207 [DOI] [PubMed] [Google Scholar]
- 27. Ricarte-Filho JC, Ryder M, Chitale DA, et al. Mutational profile of advanced primary and metastatic radioactive iodine-refractory thyroid cancers reveals distinct pathogenetic roles for BRAF, PIK3CA, and AKT1. Cancer Res. 2009;69:4885–4893 [DOI] [PMC free article] [PubMed] [Google Scholar]
- 28. Mills GB, Lu Y, Kohn EC. Linking molecular therapeutics to molecular diagnostics: inhibition of the FRAP/RAFT/TOR component of the PI3K pathway preferentially blocks PTEN mutant cells in vitro and in vivo. Proc Natl Acad Sci USA. 2001;98:10031–10033 [DOI] [PMC free article] [PubMed] [Google Scholar]
- 29. Neshat MS, Mellinghoff IK, Tran C, et al. Enhanced sensitivity of PTEN-deficient tumors to inhibition of FRAP/mTOR. Proc Natl Acad Sci USA. 2001;98:10314–10319 [DOI] [PMC free article] [PubMed] [Google Scholar]
- 30. Shi Y, Gera J, Hu L, et al. Enhanced sensitivity of multiple myeloma cells containing PTEN mutations to CCI-779. Cancer Res. 2002;62:5027–5034 [PubMed] [Google Scholar]
- 31. Bilodeau MT, Balitza AE, Hoffman JM, et al. Allosteric inhibitors of Akt1 and Akt2: a naphthyridinone with efficacy in an A2780 tumor xenograft model. Bioorg Med Chem Lett. 2008;18:3178–3182 [DOI] [PubMed] [Google Scholar]
- 32. Mitsutake N, Knauf JA, Mitsutake S, Mesa C, Jr, Zhang L, Fagin JA. Conditional BRAFV600E expression induces DNA synthesis, apoptosis, dedifferentiation, and chromosomal instability in thyroid PCCL3 cells. Cancer Res. 2005;65:2465–2473 [DOI] [PubMed] [Google Scholar]
- 33. Shirokawa JM, Elisei R, Knauf JA, et al. Conditional apoptosis induced by oncogenic Ras in thyroid cells. Mol Endocrinol. 2000;14:1725–1738 [DOI] [PubMed] [Google Scholar]
- 34. Wang J, Knauf JA, Basu S, et al. Conditional expression of RET/PTC induces a weak oncogenic drive in thyroid PCCL3 cells and inhibits thyrotropin action at multiple levels. Mol Endocrinol. 2003;17:1425–1436 [DOI] [PubMed] [Google Scholar]
- 35. Roux PP, Shahbazian D, Vu H, et al. RAS/ERK signaling promotes site-specific ribosomal protein S6 phosphorylation via RSK and stimulates cap-dependent translation. J Biol Chem. 2007;282:14056–14064 [DOI] [PMC free article] [PubMed] [Google Scholar]
- 36. Courtois-Cox S, Genther Williams SM, Reczek EE, et al. A negative feedback signaling network underlies oncogene-induced senescence. Cancer Cell. 2006;10:459–472 [DOI] [PMC free article] [PubMed] [Google Scholar]
- 37. Brewer C, Yeager N, Di Cristofano A. Thyroid-stimulating hormone initiated proliferative signals converge in vivo on the mTOR kinase without activating AKT. Cancer Res. 2007;67:8002–8006 [DOI] [PubMed] [Google Scholar]
- 38. Yeager N, Brewer C, Cai KQ, Xu XX, Di Cristofano A. Mammalian target of rapamycin is the key effector of phosphatidylinositol-3-OH initiated proliferative signals in the thyroid follicular epithelium. Cancer Res. 2008;68:444–449 [DOI] [PubMed] [Google Scholar]
- 39. Kimura T, Van KA, Golstein J, Fusco A, Dumont JE, Roger PP. Regulation of thyroid cell proliferation by TSH and other factors: a critical evaluation of in vitro models. Endocr Rev. 2001;22:631–656 [DOI] [PubMed] [Google Scholar]
- 40. Jin N, Jiang T, Rosen DM, Nelkin BD, Ball DW. Dual inhibition of mitogen-activated protein kinase kinase and mammalian target of rapamycin in differentiated and anaplastic thyroid cancer. J Clin Endocrinol Metab. 2009;94:4107–4112 [DOI] [PMC free article] [PubMed] [Google Scholar]
- 41. Suh JM, Song JH, Kim DW, et al. Regulation of the phosphatidylinositol 3-kinase, Akt/protein kinase B, FRAP/mammalian target of rapamycin, and ribosomal S6 kinase 1 signaling pathways by thyroid-stimulating hormone (TSH) and stimulating type TSH receptor antibodies in the thyroid gland. J Biol Chem. 2003;278:21960–21971 [DOI] [PubMed] [Google Scholar]
- 42. Liu D, Hou P, Liu Z, Wu G, Xing M. Genetic alterations in the phosphoinositide 3-kinase/Akt signaling pathway confer sensitivity of thyroid cancer cells to therapeutic targeting of Akt and mammalian target of rapamycin. Cancer Res. 2009;69:7311–7319 [DOI] [PMC free article] [PubMed] [Google Scholar]
- 43. De GG, Coppa A, Cosentino C, et al. The p85 regulatory subunit of PI3K mediates TSH-cAMP-PKA growth and survival signals. Oncogene. 2007;26:2039–2047 [DOI] [PubMed] [Google Scholar]
- 44. Saito J, Kohn AD, Roth RA, et al. Regulation of FRTL-5 thyroid cell growth by phosphatidylinositol (OH) 3 kinase-dependent Akt-mediated signaling. Thyroid. 2001;11:339–351 [DOI] [PubMed] [Google Scholar]
- 45. Tsygankova OM, Saavedra A, Rebhun JF, Quilliam LA, Meinkoth JL. Coordinated regulation of Rap1 and thyroid differentiation by cyclic AMP and protein kinase A. Mol Cell Biol. 2001;21:1921–1929 [DOI] [PMC free article] [PubMed] [Google Scholar]
- 46. Lou L, Urbani J, Ribeiro-Neto F, Altschuler DL. cAMP inhibition of Akt is mediated by activated and phosphorylated Rap1b. J Biol Chem. 2002;277:32799–32806 [DOI] [PubMed] [Google Scholar]
- 47. Hong K, Lou L, Gupta S, Ribeiro-Neto F, Altschuler DL. A novel Epac-Rap-PP2A signaling module controls cAMP-dependent Akt regulation. J Biol Chem. 2008;283:23129–23138 [DOI] [PMC free article] [PubMed] [Google Scholar]
- 48. Jin N, Jiang T, Rosen DM, Nelkin BD, Ball DW. Synergistic action of a RAF inhibitor and a dual PI3K/mTOR inhibitor in thyroid cancer. Clin Cancer Res. 2011;17:6482–6489 [DOI] [PMC free article] [PubMed] [Google Scholar]
- 49. Dremier S, Vandeput F, Zwartkruis FJ, Bos JL, Dumont JE, Maenhaut C. Activation of the small G protein Rap1 in dog thyroid cells by both cAMP-dependent and -independent pathways. Biochem Biophys Res Commun. 2000;267:7–11 [DOI] [PubMed] [Google Scholar]
- 50. Ribeiro-Neto F, Urbani J, Lemee N, Lou L, Altschuler DL. On the mitogenic properties of Rap1b: cAMP-induced G(1)/S entry requires activated and phosphorylated Rap1b. Proc Natl Acad Sci USA. 2002;99:5418–5423 [DOI] [PMC free article] [PubMed] [Google Scholar]
- 51. Hochbaum D, Hong K, Barila G, Ribeiro-Neto F, Altschuler DL. Epac, in synergy with cAMP-dependent protein kinase (PKA), is required for cAMP-mediated mitogenesis. J Biol Chem. 2008;283:4464–4468 [DOI] [PubMed] [Google Scholar]
- 52. Yeager N, Klein-Szanto A, Kimura S, Di Cristofano A. Pten loss in the mouse thyroid causes goiter and follicular adenomas: insights into thyroid function and cowden disease pathogenesis. Cancer Res. 2007;67:959–966 [DOI] [PubMed] [Google Scholar]
- 53. Paternot S, Dumont JE, Roger PP. Differential utilization of cyclin D1 and cyclin D3 in the distinct mitogenic stimulations by growth factors and TSH of human thyrocytes in primary culture. Mol Endocrinol. 2006;20:3279–3292 [DOI] [PubMed] [Google Scholar]
- 54. Santoro M, Melillo RM, Grieco M, Berlingieri MT, Vecchio G, Fusco A. The TRK and RET tyrosine kinase oncogenes cooperate with ras in the neoplastic transformation of a rat thyroid epithelial cell line. Cell Growth Differ. 1993;4:77–84 [PubMed] [Google Scholar]
- 55. Faivre S, Kroemer G, Raymond E. Current development of mTOR inhibitors as anticancer agents. Nat Rev Drug Discov. 2006;5:671–688 [DOI] [PubMed] [Google Scholar]
- 56. Motzer RJ, Escudier B, Oudard S, et al. Efficacy of everolimus in advanced renal cell carcinoma: a double-blind, randomised, placebo-controlled phase III trial. Lancet. 2008;372:449–456 [DOI] [PubMed] [Google Scholar]
- 57. Yao JC, Shah MH, Ito T, et al. Everolimus for advanced pancreatic neuroendocrine tumors. N Engl J Med. 2011;364:514–523 [DOI] [PMC free article] [PubMed] [Google Scholar]
- 58. Iyer G, Hanrahan AJ, Milowsky MI, et al. Genome sequencing identifies a basis for everolimus sensitivity. Science. 2012;338:221. [DOI] [PMC free article] [PubMed] [Google Scholar]
- 59. Huang S, Houghton PJ. Resistance to rapamycin: a novel anticancer drug. Cancer Metastasis Rev. 2001;20:69–78 [DOI] [PubMed] [Google Scholar]
- 60. Montero-Conde C, Ruiz-Llorente S, Dominguez JM, et al. Relief of feedback inhibition of HER3 transcription by RAF and MEK inhibitors attenuates their antitumor effects in BRAF-mutant thyroid carcinomas. Cancer Discov. 2013;3:520–533 [DOI] [PMC free article] [PubMed] [Google Scholar]
- 61. Majumder PK, Febbo PG, Bikoff R, et al. mTOR inhibition reverses Akt-dependent prostate intraepithelial neoplasia through regulation of apoptotic and HIF-1-dependent pathways. Nat Med. 2004;10:594–601 [DOI] [PubMed] [Google Scholar]
- 62. Podsypanina K, Lee RT, Politis C, et al. An inhibitor of mTOR reduces neoplasia and normalizes p70/S6 kinase activity in Pten+/− mice. Proc Natl Acad Sci USA. 2001;98:10320–10325 [DOI] [PMC free article] [PubMed] [Google Scholar]
- 63. Gild ML, Landa I, Ryder M, Ghossein RA, Knauf JA, Fagin JA. Targeting mTOR in RET mutant medullary and differentiated thyroid cancer cells. Endocr Relat Cancer. 2013;20:659–667 [DOI] [PMC free article] [PubMed] [Google Scholar]
- 64. Inoki K, Li Y, Zhu T, Wu J, Guan KL. TSC2 is phosphorylated and inhibited by Akt and suppresses mTOR signalling. Nat Cell Biol. 2002;4:648–657 [DOI] [PubMed] [Google Scholar]
- 65. Gao X, Zhang Y, Arrazola P, et al. Tsc tumour suppressor proteins antagonize amino-acid-TOR signalling. Nat Cell Biol. 2002;4:699–704 [DOI] [PubMed] [Google Scholar]
- 66. Tee AR, Fingar DC, Manning BD, Kwiatkowski DJ, Cantley LC, Blenis J. Tuberous sclerosis complex-1 and -2 gene products function together to inhibit mammalian target of rapamycin (mTOR)-mediated downstream signaling. Proc Natl Acad Sci USA. 2002;99:13571–13576 [DOI] [PMC free article] [PubMed] [Google Scholar]
- 67. Lopez-Lago MA, Okada T, Murillo MM, Socci N, Giancotti FG. Loss of the tumor suppressor gene NF2, encoding merlin, constitutively activates integrin-dependent mTORC1 signaling. Mol Cell Biol. 2009;29:4235–4249 [DOI] [PMC free article] [PubMed] [Google Scholar]
- 68. Liu D, Xing J, Trink B, Xing M. BRAF mutation-selective inhibition of thyroid cancer cells by the novel MEK inhibitor RDEA119 and genetic-potentiated synergism with the mTOR inhibitor temsirolimus. Int J Cancer. 2010;127:2965–2973 [DOI] [PMC free article] [PubMed] [Google Scholar]