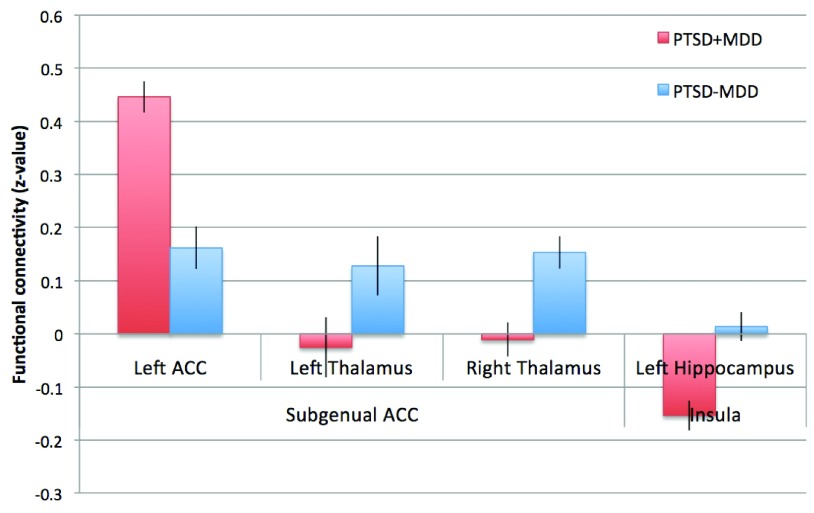
Figure 3.
Functional connectivity of peak voxels of significant differences for the subgenual ACC and insula network. Z-values of the peak voxels for the PTSD-MDD group (red) and the PTSD+MDD (blue) group are presented. Error bars represent the standard error of the mean. Z-values of the peak voxels for the PTSD-MDD group (red) and the PTSD+MDD (blue) group are presented.

