

Abstract
Background
Impact of FLT3 mutations and mutation burden in cytogenetic subgroups of acute myeloid leukemia (AML) other than normal karyotype (NK-AML) is unclear.
Methods
Patients with newly diagnosed AML were divided among three cytogenetic subgroups: Core-Binding Factor (CBF) AML, NK-AML, Poor Risk AML.
Results
A total of 481 patients were included (CBF-AML – 13%, NK-AML – 57%, poor risk – 30%). FLT3 mutations (any) frequency was 20%, 32% and 7.6% in respective cytogenetic subgroups. FLT3 mutation did not impact event free survival (EFS) in patients with CBF (P=0.84) and poor-risk AML (P=0.37). In NK-AML, EFS was worse in the FLT3-internal tandem duplication (ITD) group (20 vs. 41 weeks, P<0.00001) but not in FLT3 tyrosine kinase domain (TKD) point mutation group (61 vs. 41 weeks, P=0.15). Patients with NK-AML and higher FLT3-ITD burden had worse EFS and overall survival (OS), but not so with FLT3-TKD mutation. In multivariate analysis, FLT3-ITD mutation was prognostic for EFS in NK-AML patients (hazard ratio 3.1, P=0.03).
Conclusion
FLT3 mutations did not have a prognostic impact in AML patients with good and poor-risk karyotype. In patients with NK-AML, FLT3-ITD mutations led to worse survival, more so in patients with high mutation burden.
Keywords: Acute myeloid leukemia, FLT3, cytogenetics, prognostic factors
Introduction
Acute myeloid leukemia (AML) is a heterogeneous disease1, and its outcome is directed by the presence of several prognostic factors.2, 3 The most important ones include age, cytogenetics, performance status (PS) and response to treatment.2, 3 Most recently, several groups have identified molecular abnormalities that have an important prognostic impact in AML, such as mutations of NPM1, FLT3, WT1 and CEBPA genes.4 The perception that genetic and molecular abnormalities define unique subtypes of leukemias with important clinical and prognostic features has lead to an overall change of direction in the classification of AML, going from a pure morphological classification to a more genetic and molecular-based one, as seen in the most recent WHO classification.5
FLT3 (FMS-like tyrosine kinase 3) is a receptor tyrosine kinase (RTK) that belongs to the class III of RTK (which also includes KIT).6 FLT3 is expressed in early hematopoietic stem cells and a subset of dendritic cell progenitors.7 FLT3 signaling activates intracellular pathways (e.g. Ras-Raf-Mek, PI3K-AKT) that promote proliferation and inhibition of apoptosis.6
The most common FLT3 mutation described in AML is the internal tandem duplication (ITD) mutation of the juxtamembrane (JM) segment.4, 6 This mutation leads to loss of the autoinhibition exerted by the JM domain over the tyrosine kinase domain (TKD)6, generating a constitutively active FLT3 molecule. FLT3-ITD mutations are found in 20–30% of patients with AML, being more common in normal karytotype (NK)-AML, acute promyelocytic leukemia and AML with t(6;9)(p23;q34).8–13 Patients with FLT3-ITD positive NK-AML have higher leukocyte count, a similar CR rate to FLT3-ITD negative patients, but lower disease free survival (DFS) and overall survival (OS), mainly due to frequent relapses.9–11 The allele burden of FLT3-ITD is important, with patients with higher burden having a worse prognosis.14 Another class of FLT3 mutations is point mutations in the TKD.11, 15–20 The most common point mutation is on aspartic acid residue at position 835 (D835).16, 17, 19 Point mutations of TKD shift the activation loop to a permanently open configuration and lead to constitutive signaling.21 FLT3-TKD mutations are present in 5–10% of patients with NK-AML.16, 17, 19 Their prognostic significance is still controversial, and it seems to depend on the presence of other mutations.16, 17, 19
While common in NK-AML, FLT3 mutations are less common in other well-defined cytogenetic subgroups of AML, such as core binding factor (CBF) AML (e.g. t(8;21)(q22;q22) and inv16/t(16;16)) and AML with poor-risk cytogenetics (such as −5/del(5q), −7/del(7q) and 11q23 translocations). FLT3-ITD mutations have been described in 5–10% of patients with CBF-AML, 3–7% of patients with AML with chromosomes 5 and/or 7 abnormalities and 3% of AML patients with 11q23 translocation.8–11 FLT3-TKD mutations seem to be more common in patients with inv(16) (24%), but are uncommon in other cytogenetic subtypes of AML.17 The independent prognostic role of FLT3 in these cytogenetic subgroups is unclear. While RTK mutations (KIT mutations) are known to result in worse DFS and OS in patients with CBF AML22–24, the prognostic influence of FLT3 mutations in non-NK AML and non-APL AML is unclear.
In this study, we retrospectively evaluated the prognostic impact on survival of FLT3 mutations in well defined cytogenetic subgroups of patients with AML.
Patients and Methods
Patients
We retrospectively reviewed the records of patients with newly diagnosed AML (except APL) from 2003 until 2007 treated at University of Texas – M.D. Anderson Cancer Center (UT-MDACC) and had one of the following karyotypes: t(8;21), inv(16)/t(16;16), Diploid/-Y, −5/del(5q), −7/del(7q) and 11q abnormalities. A diagnosis of AML was based on the World Health Organization definition.5. Patients were treated on front-line studies conducted at UT-MDACC. Studies were approved by the Institutional Review Board and conducted in accordance with the Declaration of Helsinki. All patients provided written informed consent prior to study entry. Patients received different treatment regimens according to the period of diagnosis and prevailing studies. The treatment regimens were broadly divided into: Group 1 – Regimens with cytarabine (ara-C); group 2 – Regimens without ara-C. Most common regimens utilized in group 1 included fludarabine + ara-C(FA), fludarabine, ara-C and G-CSF (FLAG), fludarabine, ara-C, idarubicin (FAI), fludarabine, ara-C and topotecan (FAT)25–27; idarubicin and ara-C (IA) and combinations of IA with other agents (IL-11, tipifarnib, sorafenib, pravastatin, bevacizumab)28–31; single agent ara-C or in combination with other agents (laromustine, clofarabine, topotecan, triapine)32, 33. In most studies Ara-C was used in high doses (1.5–2.0 g/m2/dose). Most common treatments in group 2 included single agent clofarabine, laromustine, hypomethylating agents (5-azacitidine, decitabine), tyrosine kinase inhibitors (PKC412, AG013736) and histone deacetylase inhibitors (vorinostat)33–38.
Cytogenetic Data
Cytogenetic analysis was performed with standard methods. Pts were divided among three cytogenetic subgroups: CBF-AML (t(8;21), inv(16)/t(16;16)); NK-AML (Diploid,-Y) and Poor Risk Karyotype AML (−5/del(5q), −7/del(7q), 11q abnormalities).
Detection and quantification of FLT3 Mutations
FLT3 ITD and codon 835/838 TKD mutations were determined from genomic DNA extracted from bone marrow aspirate using a short-cycle PCR-based method, with subsequent restriction-digest with EcoRV for the TKD reaction and size fractionation by capillary electrophoresis, as described39. Quantification of mutation burden was performed by summing the area under the curve for all TKD or ITD peaks divided by the total peak areas for mutant and unmutated peaks. For some analyses, blast-normalized FLT3 mutation burdens were also calculated by dividing the FLT3 mutation ratio by the percentage of blasts counted on a parallel bone marrow aspirate sample. The assay sensitivity was determined to be 2% mutation-bearing cells based on dilution mixing studies with a run-to-run precision of the quantitative measurement of ±3–9%.
Criteria for Response and Survival Definitions
Complete remission (CR) was defined by the presence of less than 5% blasts in the bone marrow (BM) with more than 1×10⁹/L neutrophils and more than 100×109/L platelets in the peripheral blood (PB).40, 41 A relapse was defined by more than 5% blasts in a BM aspirate unrelated to recovery or by the presence of extramedullary disease. Event free survival (EFS) was calculated from the beginning of treatment until an event. An event was defined as relapse, resistance to induction therapy or death. Induction death was defined as death occurring before achievement of CR or confirming resistant disease. DFS was calculated from the moment of CR until relapse or death in CR. OS was calculated from the time of diagnosis until death. Patients alive at last follow-up were censored.
Statistical analysis
Categorical and continuous variables were compared by the Fischer’s exact test and Wilcoxon test, respectively.42 Kaplan-Meier product-limit survival probability estimates of OS, DFS and EFS were calculated43 and log-rank tests44 were performed to compare the time to events between FLT3 mutation positive and FLT3 mutation negative group for each karyotype risk group (CBF-AML, NK-AML, or Poor Risk AML). Since the frequencies of FLT3 mutations were lower in CBF- and poor-risk subgroups, ITD/TKD mutations were considered together in the analysis, while in the intermediate risk group they were analyzed separately. Among the cohort of NK-AML, patients with double mutation (both FLT3-ITD and FLT3-TKD) were grouped together with those with FLT3-ITD as their survival clustered with FLT3-ITD patients. To avoid collinearity, comparisons of FLT3 mutation burden (continuous value) across categorical variables (like, gender, race, and treatment group, etc.) were done using Wilcoxon tests and Spearman correlation was calculated between FLT3 and the other continuous variables. Separate models were fit for each of time-to-event outcomes (OS and EFS) in each cytogenetic subgroup. For each fitted Cox regression model, non-significant variables in univariate analyses were eliminated using in a step-down fashion of a p-value cut-off of p = .10.45 In addition, the clinical factors that indicated significant association with FLT3 mutation were excluded from the final multivariate to avoid collinearity. To evaluate for possible difference of impact of FLT3 across different treatments (ara-C vs. non-ara-C), an interaction term was added in the final variate model to adjust for the different effect of treatments on FLT3 value. All computations were done in SAS version 9.1 (Cary, NC), S-Plus version 7.0 (Palo Alto, CA) and SPSS version 17.0 (Chicago, IL).
Results
Patients Characteristics and Survival Outcomes
Data from 481 patients was analyzed. There were 65 patients (13%) with CBF-AML, 272 patients with NK-AML (57%) and 144 patients (30%) with Poor-Risk AML. Prevalence of FLT3 mutations by cytogenetic subgroup is shown in Table 1. There were 111 patients with FLT3 mutation (23%). Patients with FLT3 mutation were unequally divided among the three cytogenetic subgroups, being more common in NK-AML (32%) compared to CBF AML (20%) and Poor Risk AML (7.6%) (p < 0.001). Median follow-up of all patients was 95 weeks (range 0–249).
Table 1.
Prevalence of FLT3 mutations across cytogenetic subgroups
| Cytogenetics | FLT3-All, n (%) | FLT3-ITD, n (%) | FLT3-TKD, n (%) | Double Mutants, n (%) |
|---|---|---|---|---|
| CBF-AML (N = 65) | 13 (20) | 2 (3) | 8 (12) | 3 (5) |
| NK-AML (N = 272) | 87 (32) | 59 (22) | 18 (7) | 0 (4) |
| Poor Risk AML (N = 144) | 11 (7.5) | 3 (2) | 8 (5.5) | 0 (0) |
Abbreviations: ITD – internal tandem duplication; TKD – tyrosine kinase domain.
Core Binding Factor AML
There were 65 patients with CBF AML. Their baseline characteristics are summarized in Table 2(a). There were 13 patients with FLT3 mutation (20%), including two with FLT3-ITD (3%) and 8 with FLT3-TKD (12%). Three patients (5%) had both ITD and TKD mutation. The median FLT3 mutation burden was 12% (range 1%–49%). The median blast-normalized FLT3 mutation burden was 20% (range 5–60%), with 6 patients (46%) having high FLT3 mutation burden (>20%). FLT3 mutations were more common in patients with inv(16) abnormality than in patients with t(8;21)(q22;q22) [11/36 (31%) vs 2/29 (7%), p=0.02]. FLT3-TKD mutations were found in 10 (28%) patients with inv(16) and in 1 (3.5%) patient with t(8;21)(q22;q22). FLT3-ITD mutations were found in 4 (11%) patients with inv(16) and in 1 (3.5%) patient with t(8;21)(q22;q22). All three patients with double mutations were found in the inv(16) group. Patients with FLT3-mutated CBF-AML had a higher WBC count than wild-type (wt) FLT3 patients and a higher BM blast percentage. All patients with CBF AML were treated with chemotherapeutic regimens that contained high-dose Ara-C and majority (88%) were treated with fludarabine and Ara-C based combination. KIT mutation analysis was done in 9 patients only, and no patients were positive.
Table 2.
Characteristics of Patients with AML by FLT3 mutation
| a. Patients with CBF-AML | |||
|---|---|---|---|
| Parameter | Median [Range] or No. (%) | p | |
| FLT3-Mutated (N =13) | wt-FLT3 (N = 52) | ||
| Age, years | 50 [19–80] | 49.5 [18–88] | 0.95 |
| Male Sex | 9 (69) | 27 (52) | 0.35 |
| White Race | 9 (69) | 33 (63) | 0.76 |
| ECOG PS 3–4 | 0 (0) | 1 (2) | 1.0 |
| Hb, g/dL | 8.5 [6.7–10.6] | 8.8 [5.1–13.1] | 0.54 |
| WBC, × 109/L | 37 [3.9–89.5] | 14 [0.6–14.6] | 0.019 |
| Platelets, × 109/L | 38 [17–135] | 42.5 [4–330] | 0.66 |
| BM Blasts, % | 76 [21–91] | 50.5 [10–92] | 0.006 |
| Creatinine, mg/dL | 1.0 [0.5–1.7] | 1.0 [0.4–5.2] | 0.82 |
| Bilirubin, mg/dL | 0.6 (0.3–1.0) | 0.5 (0.1–4.7) | 0.41 |
| Cytogenetics | 0.02 | ||
| • t(8;21) | 2 (15) | 27 (52) | |
| • inv(16)/t(16;16) | 11 (85) | 25 (48) | |
| AHD | 4 (31) | 9 (17) | 0.27 |
| Previous Chemo/XRT | 0 (0) | 5 (10) | 0.57 |
| Treatment Regimens | 1.0 | ||
| • With Ara-C | 13 (100) | 52 (100) | |
| CR Rate | 92% | 90% | 1.0 |
| b. Patients with NK-AML | |||||
|---|---|---|---|---|---|
| Parameter | Median [Range] or No. (%) | p (ITD vs WT) | p (TKD vs WT) | ||
| FLT3-ITD (N = 69)1 | FLT3-TKD (N = 18) | wt-FLT3 (N = 185) | |||
| Age, years | 58 [17–84] | 62 [28–78] | 61 [18–83] | 0.12 | 0.91 |
| Male Sex | 33 (48) | 10 (55) | 99 (54) | 0.48 | 1.0 |
| White Race | 52 (75) | 17 (94) | 148 (80) | 0.49 | 0.20 |
| ECOG PS 3–4 | 0 (0) | 2 (11) | 3 (2) | 0.56 | 0.05 |
| Hb, g/dL | 8.2 [5–11.7] | 7.7 [5–10.6] | 8.4 [4.0–14.2] | 0.43 | 0.03 |
| WBC, × 109/L | 18.1 [1–166] | 22.5 [1.2–291] | 3.3 [0.4–204] | < 0.001 | < 0.001 |
| Platelets, × 109/L | 50 [9–302] | 57.5 [18–119] | 64 [3–469] | 0.13 | 0.27 |
| BM Blasts, % | 70 [8–96] | 65 [24–91] | 44 [3–93] | < 0.001 | 0.01 |
| Creatinine, mg/dL | 0.9 [0.5–2.0] | 1.0 [0.6–2.1] | 0.9 [0.4–6.8] | 0.20 | 0.38 |
| Bilirubin, mg/dL | 0.5 [0.1–2.3] | 0.45 [0.2–1.4] | 0.5 [0.1–10.3] | 0.44 | 0.51 |
| AHD | 27 (39) | 4 (22) | 88 (47.6) | 0.25 | 0.04 |
| Previous Chemo/XRT | 2 (3) | 3 (17) | 22 (11.9) | 0.02 | 0.47 |
| Treatment Regimens | 0.03 | 0.47 | |||
| • With Ara-C | 51 (74) | 17 (94) | 159 6) | ||
| • Without Ara-C | 18 (27) | 1 (6) | 26 (14) | ||
| CR Rate | 58% | 78% | 68% | 0.17 | 0.59 |
| (c). Patients with Poor Risk-AML | |||
|---|---|---|---|
| Parameter | Median [Range] or No. (%) | p | |
| FLT3-mutated (N =11) | wt-FLT3 (N = 133) | ||
| Age, years | 59 [34–83] | 60 [19–85] | 0.9 |
| Male Sex | 9 (82) | 61 (46) | 0.03 |
| White Race | 8 (73) | 101 (76) | 0.73 |
| ECOG PS 3–4 | 0 (0) | 4 (3) | 1.0 |
| Hb, g/dL | 8.5 [5.9–10.4] | 8 [2–14.2] | 0.95 |
| WBC, × 109/L | 8.4 [1.6–119] | 4 [0.8–433] | 0.16 |
| Platelets, × 109/L | 45 [16–117] | 39 [7–762] | 0.86 |
| BM Blasts, % | 55 [10–96] | 40 [5–97] | 0.33 |
| Creatinine, mg/dL | 1.1 [0.7–1.5] | 0.9 [0.5–4.5] | 0.02 |
| Bilirubin, mg/dL | 0.6 [0.3–2.0] | 0.6 [0.1–6.2] | 0.53 |
| Cytogenetics | 0.18 | ||
| • 11q23 | 3 (28) | 17 (13) | |
| • −5/del(5q) and/or −7/del(7q) | 8 (72) | 116 (87) | |
| AHD | 6 (55) | 69 (52) | 1.0 |
| Previous Chemo/XRT | 3 (27) | 36 (27) | 1.0 |
| Treatment Regimens | 0.03 | ||
| • With Ara-C | 6 (55) | 111 4) | |
| • Without Ara-C | 5 (45) | 22 (16) | |
| CR Rate | 18% | 43% | 0.20 |
Abbreviations: AHD, antecedent hematological disorder; BM, bone marrow; Chemo, chemotherapy; Hb, hemoglobin; PS, performance status; WBC, white blood cell count; XRT, radiotherapy.
Abbreviations: AHD, antecedent hematological disorder; BM, bone marrow; Chemo, chemotherapy; Hb, hemoglobin; PS, performance status; WBC, white blood cell count; XRT, radiotherapy.
Includes 10 patients with double mutations.
Abbreviations: AHD, antecedent hematological disorder; BM, bone marrow; Chemo, chemotherapy; Hb, hemoglobin; PS, performance status; WBC, white blood cell count; XRT, radiotherapy.
There was no difference in CR rate among patients with and without FLT3 mutations (92% vs. 90%; p = 1.0). Survival results are summarized in table 3(a), figures 1(a) and 2(a). In our cohort, FLT3-mutations did not impact survival in patients with CBF-AML.
Table 3.
Survival Results by FLT3 Status
| (a). Patients with CBF-AML | |||
|---|---|---|---|
| Parameter (95% CI) | FLT3-Mutated (N =13) | wt-FLT3 (N = 52) | p |
| DFS, 2 years | 50% (14–95%) | 64% (47–83%) | 0.66 |
| Median, weeks | NR (82-NR) | NR (84-NR) | |
| EFS, 2 years | 50% (12–88%) | 58% (41–75%) | 0.84 |
| Median, weeks | 100 (86-NR) | NR (73-NR) | |
| OS, 2 years | 92% (76–100%) | 74% (59–88%) | 0.57 |
| Median, weeks | NR (112-NR) | NR (112-NR) | |
| (b). Patients with NK-AML | |||||
|---|---|---|---|---|---|
| Parameter (95% CI) | FLT3-ITD (N = 69)1 | FLT3-TKD (N = 18) | wt-FLT3 (N = 185) | p (ITD vs WT) | P (TKD vs WT) |
| DFS, 2 years | 10% (0–21%) | 49% (14–84%) | 40% (30–50%) | 0.001 | 0.15 |
| Median, weeks | 28 (21–35) | 102 (45-NR) | 63 (41–85) | ||
| EFS, 2 years | 6% (0–11%) | 48% (23–74%) | 26% (19–34%) | < 0.00001 | 0.15 |
| Median, weeks | 20 (12–24) | 61 (0–132) | 41 (29–52) | ||
| OS, 2 years | 13% (2.5–23%) | 43% (13–73%) | 47% (39–56%) | < 0.00001 | 0.85 |
| Median, weeks | 33 (29–37) | 84 (58–110) | 90 (53–126) | ||
| (c). Patients with Poor Risk-AML | |||
|---|---|---|---|
| Parameter (95% CI) | FLT3-Mutated (N =11) | wt-FLT3 (N = 133) | p |
| EFS, 2 years | 0% (0%) | 6% (1–10%) | 0.37 |
| Median, weeks | 8 (5–11) | 11 (7–15) | |
| OS, 2 years | 0% (0%) | 11% (5–17%) | 0.44 |
| Median, weeks | 55 (35–74) | 24 (18–30) | |
Abbreviations: CR, complete remission; DFS, disease-free survival; EFS, event-free survival; OS, overall survival; NR, not reached.
Abbreviations: CR, complete remission; DFS, disease-free survival; EFS, event-free survival; OS, overall survival; NR, not reached.
Includes 10 patients with double mutations
Abbreviations: CR, complete remission; DFS, disease-free survival; EFS, event-free survival; OS, overall survival; NR, not reached.
Figure 1.
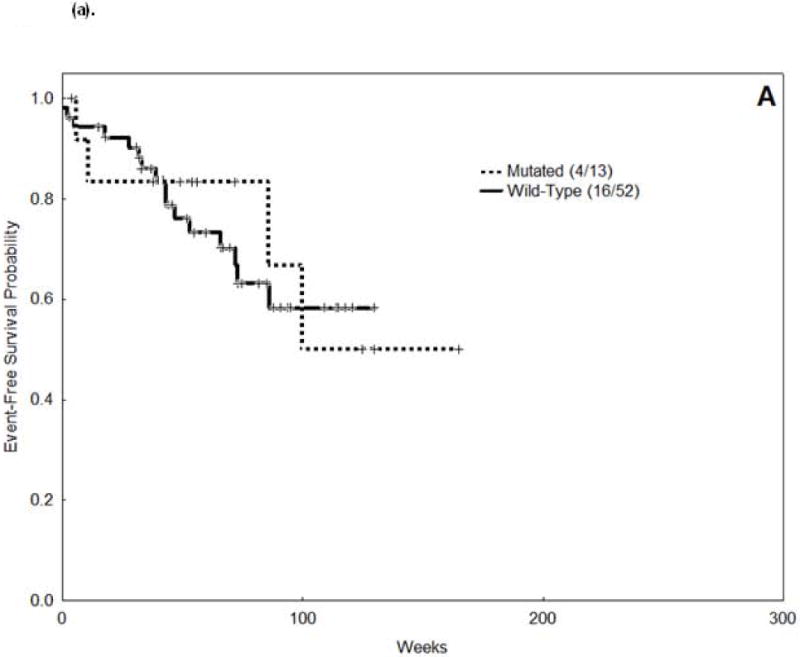


Event Free Survival (EFS) curves.
(a). Core Binding Factor associated acute myeloid leukemia (AML).
(b). Normal Karyotype-AML (wt-FLT3, FLT3-ITD and FLT3-TKD).
(c). Poor Risk AML.
Figure 2.


Overall Survival (OS) curves.
(a). CBF-AML
(b). NK-AML (wt-FLT3, FLT3-ITD and FLT3-TKD).
(c). Poor Risk AML.
Normal Karyotype AML
There were 272 patients with NK-AML. There were 59 patients (22%) with isolated FLT3-ITD, 18 patients (7%) with isolated FLT3-TKD and 10 patients (4%) had both ITD and TKD mutations. Patients with FLT3-ITD and FLT3-TKD mutations were analyzed separately, and their survival outcomes compared to patients with NK-AML who had wt-FLT3 (negative for both mutations). The baseline characteristics of patients with NK-AML are summarized in Table 2(b).
Patients with FLT3-ITD mutations had higher WBC and higher BM blast percentage than patients with wt-FLT3. Data on FLT3-ITD mutation ratio was available for 66 patients. The median FLT3-ITD mutation ratio was 36% (range 0.8%–81%). Median blast-normalized FLT3-ITD mutation ratio was 51% (range 1–235%), and 54 patients (82%) had a high FLT3-ITD ratio (> 0.2). There was no difference in CR rate among patients with FLT3-ITD mutation and wt-FLT3 (58% vs. 68%; p = 0.17). Survival results are shown in table 3(b), figure 1(b) and 2(b). FLT3-ITD mutations were associated with inferior EFS, DFS and OS. There was a trend for a higher EFS in patients with low FLT3-ITD burden compared to high FLT3-ITD burden (median 36 weeks vs. 16 weeks, p=0.08). Similarly, patients with low FLT3-ITD burden had higher OS (median 63 weeks vs. 30 weeks, p=0.05). There was no difference in EFS (p=0.55) and OS (p=0.54) among patients with low FLT3-ITD allele burden and wt-FLT3.
Similar to patients with FLT3-ITD mutations, patients with NK-AML who carried FLT3-TKD mutations had a higher presenting WBC and higher BM blast percentage than patients with wt-FLT3. Twelve patients (66%) had a high mutation burden (> 0.2). There was no statistically significant difference in the proportion of patients with FLT3-TKD mutations receiving treatment with Ara-C containing regimens (94%) compared to wt-FLT3 (86%) (p = 0.47). There was no difference in the CR rate (78% vs. 68%, p = 0.59). Survival outcomes are summarized in table 3b and figure 1b. FLT3-TKD mutations did not impact survival in patients with NK-AML. There was no difference in EFS and OS by FLT3-TKD burden (median not reached [NR] [low] vs. 59 weeks [high], p=0.59, and median NR vs. 74 weeks, p=0.72, respectively). However, the number of patients analyzed in each group was small.
Poor Prognosis AML
There were 144 patients with poor-risk karyotype AML including 11 (7.5%) patients with FLT3 mutation, 3 with FLT3-ITD (2%) and 8 with FLT3-TKD (5.5%). Their baseline characteristics are summarized in Table 2(c). No patients had double mutations. The median FLT3 mutation burden was 21% (range 2%–56%). The median blast-normalized FLT3 mutation burden was 37% (range 8–158%), including 9 patients (82%) with high burden. In contrast to our findings in patients with CBF-AML and NK-AML, in patients with poor prognosis cytogenetics, FLT3 mutations were not associated with higher WBC counts or higher BM blast percentages. Patients with FLT3-mutated AML in this group had a lower CR rate than patients with wt-FLT3 but without statistical significance (18% vs. 43%; p=0.20). Only two patients achieved CR in the FLT3-mutated group and so we didn’t conduct an analysis of DFS. EFS and OS are summarized in table 3(c), figure 1(c) and 2(c). There was no statistically significant difference in EFS and OS by FLT3-mutation status.
Multivariate Analysis for EFS
Core Binding Factor AML
In the univariate analysis for EFS in patients with CBF-AML, the following covariates were significantly associated with lower EFS: lower platelets, higher bilirubin levels and higher performance status (PS). In the multivariate analysis for EFS (table 4), only PS was prognostic for EFS, with no impact of FLT3 mutations. Similarly, FLT3 mutations were not associated with worse OS in the multivariate analysis (data not shown).
Table 4.
Multivariate Analysis for EFS
| Parameter | Mutltivariate | ||
|---|---|---|---|
| HR | 95% CI | p | |
| A. CBF AML | |||
| FLT3 (continuous variable) | 1.28 | 0.04–37.78 | 0.88 |
| PS | 1.77 | 1.07, 2.91 | 0.03 |
| B. NK-AML (FLT3-ITD and wt-FLT3) | |||
| Age | 1.02 | 1.01–1.03 | 0.005 |
| Race (White vs Non-White) | 0.56 | 0.39–0.81 | 0.002 |
| Creatinine | 1.39 | 1.09–1.77 | 0.007 |
| FLT3-ITD (continuous variable) | 3.10 | 1.09–8.78 | 0.03 |
| Treatment (Ara-C vs. No-Ara-C) | 1.65 | 1.05–2.59 | 0.03 |
| Interaction Term | |||
| • FLT3-ITD*Treatment | 0.66 | 0.30–1.47 | 0.31 |
| C. NK-AML (FLT3-TKD and wt-FLT3) | |||
| Age | 1.03 | 1.01–1.04 | 0.0001 |
| Race (White vs. Non-White) | 0.47 | 0.30–0.73 | 0.001 |
| Creatinine | 1.47 | 1.03–2.09 | 0.003 |
| Prior Chemotherapy/XRT | 1.98 | 1.22–3.22 | 0.005 |
| FLT3-TKD (continous variable) | 0.57 | 0.11–2.76 | 0.48 |
| Treatment (Ara-C vs. No Ara-C) | 0.74 | 0.45–1.23 | 0.25 |
| Interaction Term | |||
| • FLT3-TKD*Treatment | 0.88 | 0.32–2.46 | 0.81 |
| D. Poor Risk AML | |||
| Age | 1.02 | 1.01–1.04 | 0.01 |
| FLT3 (continuous variable) | 4.24 | 0.15–117.87 | 0.39 |
| Treatment (Ara-C vs. No Ara-C) | 1.26 | 0.77–2.04 | 0.35 |
| Interaction Term | |||
| • FLT3 Mut*Treatment | 0.52 | 0.07–3.79 | 0.52 |
Normal Karyotype AML
Two Cox models were fit in patients with NK-AML. In the first model the population of patients included patients that were FLT3-ITD mutated or had wt-FLT3. In the univariate analysis for EFS, the following covariates were found to be significantly associated with shorter EFS: higher age, non-white race, higher WBC, lower platelets, higher serum creatinine, FLT3-ITD mutation, presence of antecedent hematological disorder (AHD), history of prior chemotherapy or radiation, higher performance status and treatment without Ara-C. The results of the multivariate analysis showed that FLT3-ITD (as a continuous variable) was associated with worse EFS (table 4) and worse OS (data not shown). There was no interaction between Ara-C regimens and FLT3-ITD mutations in the multivariate analysis.
In the second model we included patients who were positive for FLT3-TKD mutation or had wt-FLT3. In the univariate analysis, the following factors were associated with shorter EFS: higher age, non-white race, higher creatinine, presence of AHD, history of chemotherapy or radiation therapy and treatment without Ara-C. By multivariate analysis, FLT3-TKD mutations in NK-AML did not influence EFS (table 4) or OS (data not shown). Also, there was no interaction between Ara-C regimens and FLT3-TKD mutations in the multivariate analysis.
Poor Risk AML
In the univariate analysis for EFS in patients with poor risk karyotype AML, the following covariates were significantly associated with lower EFS: higher age, male sex, higher serum creatinine levels, and treatment without Ara-C regimens. In the multivariate analysis (Table 4), only age was prognostic for EFS, with no impact of FLT3 mutations or treatment regimen.
Discussion
As clinical outcome of patients with AML largely depends on cytogenetic subgroups, we analyzed the impact of FLT3 mutations in the outcome of patients within specific cytogenetic subgroups of AML and that of allele burden of mutant FLT3 particularly in patients with NK-AML. Ours is one of the larger cohorts of poor-risk and CBF-AML patients with FLT3 mutations and in concordance with published reports, we found a low prevalence of FLT3 mutation (both ITD and TKD) in these patients.9, 11, 17 However, limited number of patients did not allow us to analyze the impact of allele burden in poor-risk cytogenetics and CBF-AML. FLT3 mutations (mostly TKD mutations) were more common in patients with Inv(16) CBF-AML than in t(8;21), as previously reported.17 FLT3 mutations (ITD and TKD mutations analyzed together) did not impact survival outcomes in patients with CBF-AML and Poor-Risk karyotype AML. FLT3-ITD mutations were more prevalent in patients with NK-AML, and we found that FLT3-ITD but not FLT3-TKD mutation impacted survival in this subgroup of patients largely treated with high-dose ara-C based induction regimens.
FLT3 mutations may play an important role in the leukemogenesis of CBF-AML as it has been shown that FLT3 cooperates with both AML1-ETO and CBFB-MYH11 to induce the leukemic phenotype in mouse models.46, 47 Boissel et al reported that FLT3 mutations lead to lower EFS and OS in patients with CBF-positive AML, particularly due to an excess occurrence of early events.48 In that report the authors estimated that only approximately 47% of patients received high-dose ara-C during consolidation courses. This may have impacted the results as in our population 100% of patients were treated with regimens that contained high-dose Ara-C, the majority (87%) having received regimens that contained fludarabine + ara-C, a combination that was recently reported to improve the outcomes of patients with CBF-AML.25 Thus it is conceivable that effective therapy may overcome the negative prognostic impact of FLT3 mutations. In a gene expression profiling study of patients with CBF-AML no correlation was found between FLT3-ITD and a gene signature that predicted worse survival in KIT-mutation negative patients with CBF-AML.49
In AML with poor-risk karyotype, the incidence of FLT3 mutations is even lower than in CBF-AML, and its prognostic impact is less studied. Indeed, FLT3 mutations appear to be less common in patients who present with secondary AML, therapy-related AML and AML with complex karyotype.50, 51. Patients with FLT3 mutations in this subgroup did not have higher WBC or higher BM blast counts.
In NK-AML, the role of FLT3 mutations is better defined. We did confirm in our population that FLT3-ITD was associated with a worse survival compared to patients with wt-FLT3. Contrary to previous reports,19 but in accordance with others, we didn’t find that FLT3-TKD mutations impacted survival in patients with NK-AML.16, 17
In our cohort, patients with CBF-AML with FLT3 mutation had a lower blast-normalized mutation ratio (46%) compared to patients with NK-AML (80%) and poor-risk AML (82%) (p=0.027). In patients with NK-AML, we confirmed previous findings that a high FLT3-ITD mutation burden is associated with a worse survival. The same report also suggested that even low burden of FLT3 mutations (1–24% of total FLT3 allele) resulted in worse outcome compared to wt-FLT3.14 Our Cox analysis demonstrated that the risk associated with FLT3-ITD increased progressively with an increasing burden of the mutation and that patients who had a low mutation burden (< 20%) of FLT3-ITD had similar EFS and OS compared to patients with wt-FLT3. In view of recent reports recommending allogeneic SCT for patients harboring FLT3-ITD mutations,52 we do believe that information about allele level should be taken into account when making therapeutic decisions. We did not find FLT3-TKD allele burden to influence outcome in patients with NK-AML. However, the number of patients with TKD mutation was small, and we must be careful about drawing conclusions from such subgroup analysis.
Our study has several limitations. First and foremost, it is a retrospective analysis and subgroup analysis may lack the power to detect differences in survival. Due to the low prevalence of FLT3 mutations in patients with CBF-AML and poor-risk AML, we combined FLT3-ITD and FLT3-TKD mutations in this analysis. This may have influenced our results, since these are biologically distinct mutations, a fact that was indicated by our own analysis in NK-AML patients. As expected in a retrospective analysis, there is a degree of heterogeneity of treatment regimens administered, particularly in the subgroups of NK-AML and poor-risk AML. Patients who received non-Ara-C containing regimens were older than patients who received ara-C regimens (median age 69 vs. 57 years, p<0.00001). Finally, data is emerging about the impact and interaction of different mutations (e.g. NPM1, KIT, CEBPA) in AML but unfortunately comprehensive analysis of these mutations was not available for all our patients.16
In conclusion, in our cohort of patients, FLT3 mutations did not impact survival in CBF and poor risk cytogenetics AML. In patients with NK-AML, FLT3-TKD mutations had no impact on survival, while a high FLT3-ITD allele burden was associated with worse survival. Analysis of merged data from large databases may help to better discern the prognostic value of different FLT3 mutations among different cytogenetic subtypes of AML.
Acknowledgments
This article funded by National Institute of Health (P30 CA016672).
Sources of support: None
Footnotes
Financial disclosures: No relevant disclosures
References
- 1.Gilliland DG, Jordan CT, Felix CA. The molecular basis of leukemia. Hematology Am Soc Hematol Educ Program. 2004:80–97. doi: 10.1182/asheducation-2004.1.80. [DOI] [PubMed] [Google Scholar]
- 2.Avivi I, Rowe JM. Prognostic factors in acute myeloid leukemia. Curr Opin Hematol. 2005;12(1):62–7. doi: 10.1097/01.moh.0000148760.15412.df. [DOI] [PubMed] [Google Scholar]
- 3.Lowenberg B. Prognostic factors in acute myeloid leukaemia. Best Pract Res Clin Haematol. 2001;14(1):65–75. doi: 10.1053/beha.2000.0116. [DOI] [PubMed] [Google Scholar]
- 4.Scholl S, Fricke HJ, Sayer HG, Hoffken K. Clinical implications of molecular genetic aberrations in acute myeloid leukemia. J Cancer Res Clin Oncol. 2009;135(4):491–505. doi: 10.1007/s00432-008-0524-x. [DOI] [PMC free article] [PubMed] [Google Scholar]
- 5.Swerdlow SH, Campo E, Harris NL, et al. World Health Organization Classification of Tumours of Haematopoietic and Lymphoid Tissues. 4. Lyon: IARC Press; 2008. [Google Scholar]
- 6.Gilliland DG, Griffin JD. The roles of FLT3 in hematopoiesis and leukemia. Blood. 2002;100(5):1532–42. doi: 10.1182/blood-2002-02-0492. [DOI] [PubMed] [Google Scholar]
- 7.Rosnet O, Buhring HJ, Marchetto S, et al. Human FLT3/FLK2 receptor tyrosine kinase is expressed at the surface of normal and malignant hematopoietic cells. Leukemia. 1996;10(2):238–48. [PubMed] [Google Scholar]
- 8.Frohling S, Schlenk RF, Breitruck J, et al. Prognostic significance of activating FLT3 mutations in younger adults (16 to 60 years) with acute myeloid leukemia and normal cytogenetics: a study of the AML Study Group Ulm. Blood. 2002;100(13):4372–80. doi: 10.1182/blood-2002-05-1440. [DOI] [PubMed] [Google Scholar]
- 9.Kottaridis PD, Gale RE, Frew ME, et al. The presence of a FLT3 internal tandem duplication in patients with acute myeloid leukemia (AML) adds important prognostic information to cytogenetic risk group and response to the first cycle of chemotherapy: analysis of 854 patients from the United Kingdom Medical Research Council AML 10 and 12 trials. Blood. 2001;98(6):1752–9. doi: 10.1182/blood.v98.6.1752. [DOI] [PubMed] [Google Scholar]
- 10.Schnittger S, Schoch C, Dugas M, et al. Analysis of FLT3 length mutations in 1003 patients with acute myeloid leukemia: correlation to cytogenetics, FAB subtype, and prognosis in the AMLCG study and usefulness as a marker for the detection of minimal residual disease. Blood. 2002;100(1):59–66. doi: 10.1182/blood.v100.1.59. [DOI] [PubMed] [Google Scholar]
- 11.Thiede C, Steudel C, Mohr B, et al. Analysis of FLT3-activating mutations in 979 patients with acute myelogenous leukemia: association with FAB subtypes and identification of subgroups with poor prognosis. Blood. 2002;99(12):4326–35. doi: 10.1182/blood.v99.12.4326. [DOI] [PubMed] [Google Scholar]
- 12.Gale RE, Hills R, Pizzey AR, et al. Relationship between FLT3 mutation status, biologic characteristics, and response to targeted therapy in acute promyelocytic leukemia. Blood. 2005;106(12):3768–76. doi: 10.1182/blood-2005-04-1746. [DOI] [PubMed] [Google Scholar]
- 13.Oyarzo MP, Lin P, Glassman A, Bueso-Ramos CE, Luthra R, Medeiros LJ. Acute myeloid leukemia with t(6;9)(p23;q34) is associated with dysplasia and a high frequency of flt3 gene mutations. Am J Clin Pathol. 2004;122(3):348–58. doi: 10.1309/5DGB-59KQ-A527-PD47. [DOI] [PubMed] [Google Scholar]
- 14.Gale RE, Green C, Allen C, et al. The impact of FLT3 internal tandem duplication mutant level, number, size, and interaction with NPM1 mutations in a large cohort of young adult patients with acute myeloid leukemia. Blood. 2008;111(5):2776–84. doi: 10.1182/blood-2007-08-109090. [DOI] [PubMed] [Google Scholar]
- 15.Abu-Duhier FM, Goodeve AC, Wilson GA, Care RS, Peake IR, Reilly JT. Identification of novel FLT-3 Asp835 mutations in adult acute myeloid leukaemia. Br J Haematol. 2001;113(4):983–8. doi: 10.1046/j.1365-2141.2001.02850.x. [DOI] [PubMed] [Google Scholar]
- 16.Bacher U, Haferlach C, Kern W, Haferlach T, Schnittger S. Prognostic relevance of FLT3-TKD mutations in AML: the combination matters–an analysis of 3082 patients. Blood. 2008;111(5):2527–37. doi: 10.1182/blood-2007-05-091215. [DOI] [PubMed] [Google Scholar]
- 17.Mead AJ, Linch DC, Hills RK, Wheatley K, Burnett AK, Gale RE. FLT3 tyrosine kinase domain mutations are biologically distinct from and have a significantly more favorable prognosis than FLT3 internal tandem duplications in patients with acute myeloid leukemia. Blood. 2007;110(4):1262–70. doi: 10.1182/blood-2006-04-015826. [DOI] [PubMed] [Google Scholar]
- 18.Moreno I, Martin G, Bolufer P, et al. Incidence and prognostic value of FLT3 internal tandem duplication and D835 mutations in acute myeloid leukemia. Haematologica. 2003;88(1):19–24. [PubMed] [Google Scholar]
- 19.Whitman SP, Ruppert AS, Radmacher MD, et al. FLT3 D835/I836 mutations are associated with poor disease-free survival and a distinct gene-expression signature among younger adults with de novo cytogenetically normal acute myeloid leukemia lacking FLT3 internal tandem duplications. Blood. 2008;111(3):1552–9. doi: 10.1182/blood-2007-08-107946. [DOI] [PMC free article] [PubMed] [Google Scholar]
- 20.Yamamoto Y, Kiyoi H, Nakano Y, et al. Activating mutation of D835 within the activation loop of FLT3 in human hematologic malignancies. Blood. 2001;97(8):2434–9. doi: 10.1182/blood.v97.8.2434. [DOI] [PubMed] [Google Scholar]
- 21.Fenski R, Flesch K, Serve S, et al. Constitutive activation of FLT3 in acute myeloid leukaemia and its consequences for growth of 32D cells. Br J Haematol. 2000;108(2):322–30. doi: 10.1046/j.1365-2141.2000.01831.x. [DOI] [PubMed] [Google Scholar]
- 22.Cairoli R, Beghini A, Grillo G, et al. Prognostic impact of c-KIT mutations in core binding factor leukemias: an Italian retrospective study. Blood. 2006;107(9):3463–8. doi: 10.1182/blood-2005-09-3640. [DOI] [PubMed] [Google Scholar]
- 23.Paschka P, Marcucci G, Ruppert AS, et al. Adverse prognostic significance of KIT mutations in adult acute myeloid leukemia with inv(16) and t(8;21): a Cancer and Leukemia Group B Study. J Clin Oncol. 2006;24(24):3904–11. doi: 10.1200/JCO.2006.06.9500. [DOI] [PubMed] [Google Scholar]
- 24.Schnittger S, Kohl TM, Haferlach T, et al. KIT-D816 mutations in AML1-ETO-positive AML are associated with impaired event-free and overall survival. Blood. 2006;107(5):1791–9. doi: 10.1182/blood-2005-04-1466. [DOI] [PubMed] [Google Scholar]
- 25.Borthakur G, Kantarjian H, Wang X, et al. Treatment of core-binding-factor in acute myelogenous leukemia with fludarabine, cytarabine, and granulocyte colony-stimulating factor results in improved event-free survival. Cancer. 2008;113(11):3181–5. doi: 10.1002/cncr.23927. [DOI] [PMC free article] [PubMed] [Google Scholar]
- 26.Giles FJ, Cortes JE, Kantarjian HM, O’Brien SM, Estey E, Beran M. A fludarabine, topotecan, and cytarabine regimen is active in patients with refractory acute myelogenous leukemia. Leuk Res. 2004;28(4):353–7. doi: 10.1016/j.leukres.2003.08.013. [DOI] [PubMed] [Google Scholar]
- 27.Thomas MB, Koller C, Yang Y, et al. Comparison of fludarabine-containing salvage chemotherapy regimens for relapsed/refractory acute myelogenous leukemia. Leukemia. 2003;17(5):990–93. doi: 10.1038/sj.leu.2402862. [DOI] [PubMed] [Google Scholar]
- 28.Giles FJ, Kantarjian HM, Cortes JE, et al. Adaptive randomized study of idarubicin and cytarabine alone or with interleukin-11 as induction therapy in patients aged 50 or above with acute myeloid leukemia or high-risk myelodysplastic syndromes. Leuk Res. 2005;29(6):649–52. doi: 10.1016/j.leukres.2004.11.013. [DOI] [PubMed] [Google Scholar]
- 29.Ravandi F, Cortes J, Faderl S, et al. Combination of Sorafenib, Idarubicin and Cytarabine Has a High Response Rate in Patients with Newly Diagnosed Acute Myeloid Leukemia (AML) Younger Than 65 Years. Blood. 2008;112(11) Abstract 768. [Google Scholar]
- 30.Delmonte J, Jr, Kantarjian HM, Garcia-Manero G, et al. Final Update of Phase I-II Study of the Farnesyltransferase Inhibitor Tipifarnib in Combination with Idarubicin and Cytarabine for Patients with Newly Diagnosed Acute Myeloid Leukemia or High-Risk Myelodysplastic Syndrome. Blood. 2007;110(11) Abstract 441. [Google Scholar]
- 31.Kornblau SM, Banker DE, Stirewalt D, et al. Blockade of adaptive defensive changes in cholesterol uptake and synthesis in AML by the addition of pravastatin to idarubicin + high-dose Ara-C: a phase 1 study. Blood. 2007;109(7):2999–3006. doi: 10.1182/blood-2006-08-044446. [DOI] [PMC free article] [PubMed] [Google Scholar]
- 32.Faderl S, Verstovsek S, Cortes J, et al. Clofarabine and cytarabine combination as induction therapy for acute myeloid leukemia (AML) in patients 50 years of age or older. Blood. 2006;108(1):45–51. doi: 10.1182/blood-2005-08-3294. [DOI] [PubMed] [Google Scholar]
- 33.Faderl S, Ravandi F, Huang X, et al. A randomized study of clofarabine versus clofarabine plus low-dose cytarabine as front-line therapy for patients aged 60 years and older with acute myeloid leukemia and high-risk myelodysplastic syndrome. Blood. 2008;112(5):1638–45. doi: 10.1182/blood-2007-11-124602. [DOI] [PMC free article] [PubMed] [Google Scholar]
- 34.Giles F, Rizzieri D, Karp J, et al. Cloretazine (VNP40101M), a novel sulfonylhydrazine alkylating agent, in patients age 60 years or older with previously untreated acute myeloid leukemia. J Clin Oncol. 2007;25(1):25–31. doi: 10.1200/JCO.2006.07.0961. [DOI] [PubMed] [Google Scholar]
- 35.Garcia-Manero G, Kantarjian HM, Sanchez-Gonzalez B, et al. Phase 1/2 study of the combination of 5-aza-2′-deoxycytidine with valproic acid in patients with leukemia. Blood. 2006;108(10):3271–79. doi: 10.1182/blood-2006-03-009142. [DOI] [PMC free article] [PubMed] [Google Scholar]
- 36.Garcia-Manero G, Yang H, Bueso-Ramos C, et al. Phase 1 study of the histone deacetylase inhibitor vorinostat (suberoylanilide hydroxamic acid [SAHA]) in patients with advanced leukemias and myelodysplastic syndromes. Blood. 2008;111(3):1060–6. doi: 10.1182/blood-2007-06-098061. [DOI] [PubMed] [Google Scholar]
- 37.Soriano AO, Yang H, Faderl S, et al. Safety and clinical activity of the combination of 5-azacytidine, valproic acid, and all-trans retinoic acid in acute myeloid leukemia and myelodysplastic syndrome. Blood. 2007;110(7):2302–8. doi: 10.1182/blood-2007-03-078576. [DOI] [PubMed] [Google Scholar]
- 38.Stone RM, DeAngelo DJ, Klimek V, et al. Patients with acute myeloid leukemia and an activating mutation in FLT3 respond to a small-molecule FLT3 tyrosine kinase inhibitor, PKC412. Blood. 2005;105(1):54–60. doi: 10.1182/blood-2004-03-0891. [DOI] [PubMed] [Google Scholar]
- 39.Chen W, Jones D, Medeiros LJ, Luthra R, Lin P. Acute myeloid leukaemia with FLT3 gene mutations of both internal tandem duplication and point mutation type. Br J Haematol. 2005;130(5):726–8. doi: 10.1111/j.1365-2141.2005.05666.x. [DOI] [PubMed] [Google Scholar]
- 40.Cheson BD, Cassileth PA, Head DR, et al. Report of the National Cancer Institute-sponsored workshop on definitions of diagnosis and response in acute myeloid leukemia. J Clin Oncol. 1990;8(5):813–9. doi: 10.1200/JCO.1990.8.5.813. [DOI] [PubMed] [Google Scholar]
- 41.Cheson BD, Bennett JM, Kopecky KJ, et al. Revised recommendations of the International Working Group for Diagnosis, Standardization of Response Criteria, Treatment Outcomes, and Reporting Standards for Therapeutic Trials in Acute Myeloid Leukemia. J Clin Oncol. 2003;21(24):4642–9. doi: 10.1200/JCO.2003.04.036. [DOI] [PubMed] [Google Scholar]
- 42.Snedecor GW, Cochran WG. Statistical Methods. 7. Ames: Iowa State University Press; 1980. [Google Scholar]
- 43.Kaplan EL, Meire P. Nonparametric estimation from incomplete observations. J Am Stat Assoc. 1958;53:457–81. [Google Scholar]
- 44.Mantel N. Evaluation of survival data and two new rank order statistics arising in its consideration. Cancer Chemother Rep. 1966;50(3):163–70. [PubMed] [Google Scholar]
- 45.Therneau TM, Grambsch PM. Modelling Survival Data. 1. New York: Springer; 2000. [Google Scholar]
- 46.Schessl C, Rawat VP, Cusan M, et al. The AML1-ETO fusion gene and the FLT3 length mutation collaborate in inducing acute leukemia in mice. J Clin Invest. 2005;115(8):2159–68. doi: 10.1172/JCI24225. [DOI] [PMC free article] [PubMed] [Google Scholar]
- 47.Kim HG, Kojima K, Swindle CS, et al. FLT3-ITD cooperates with inv(16) to promote progression to acute myeloid leukemia. Blood. 2008;111(3):1567–74. doi: 10.1182/blood-2006-06-030312. [DOI] [PMC free article] [PubMed] [Google Scholar]
- 48.Boissel N, Leroy H, Brethon B, et al. Incidence and prognostic impact of c-Kit, FLT3, and Ras gene mutations in core binding factor acute myeloid leukemia (CBF-AML) Leukemia. 2006;20(6):965–70. doi: 10.1038/sj.leu.2404188. [DOI] [PubMed] [Google Scholar]
- 49.Paschka P, Radmacher MD, Marcucci G, et al. Outcome prediction in adult core binding factor (CBF) acute myeloid leukemia (AML) with gene expression profiling: A Cancer and Leukemia Group B (CALGB) study. J Clin Oncol. 2007;25(18) Abstract 7011. [Google Scholar]
- 50.Andersson A, Johansson B, Lassen C, Mitelman F, Billstrom R, Fioretos T. Clinical impact of internal tandem duplications and activating point mutations in FLT3 in acute myeloid leukemia in elderly patients. Eur J Haematol. 2004;72(5):307–13. doi: 10.1111/j.1600-0609.2004.00225.x. [DOI] [PubMed] [Google Scholar]
- 51.Stirewalt DL, Kopecky KJ, Meshinchi S, et al. FLT3, RAS, and TP53 mutations in elderly patients with acute myeloid leukemia. Blood. 2001;97(11):3589–95. doi: 10.1182/blood.v97.11.3589. [DOI] [PubMed] [Google Scholar]
- 52.Schlenk RF, Dohner K, Krauter J, et al. Mutations and treatment outcome in cytogenetically normal acute myeloid leukemia. N Engl J Med. 2008;358(18):1909–18. doi: 10.1056/NEJMoa074306. [DOI] [PubMed] [Google Scholar]