
Figure 4.
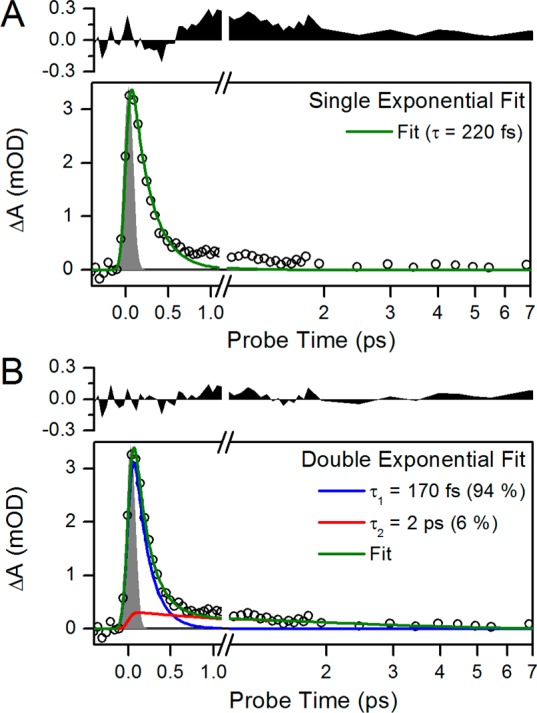
(A and B) Single- and double-exponential fitting of the 520 nm ESA kinetic traces, respectively. The fit is convoluted with a 120 fs IRF (gray area). The residual of each fit is plotted above with the same y-axes for comparison of the single- and double-exponential fits.