

Abstract
This unit provides protocols for measuring the abundance and growth of macrophage precursors in agar cultures and the proliferation of isolated mature macrophages in vitro, by either direct cell counting or by DNA measurement. Methods for the immunohistochemical identification of macrophages and the determination of their proliferative status in vivo by immunofluorescence are also included. It also describes methods for characterization of macrophage differentiation through the immunofluorescence analysis of cell surface expression of CSF-1 receptor.
INTRODUCTION
The first part of this unit provides protocols for measuring the abundance and growth of macrophage precursors in agar cultures (Basic protocol 1) and the proliferation of isolated mature macrophages in vitro, by either direct cell counting (Basic protocol 2), or by DNA measurement (Basic protocol 3). These methods can be applied to macrophage cell lines (Chitu et al., 2009; Yu et al., 2008), as well as to many primary macrophage populations including: bronchoalveolar lavage cells, liver Kupffer cells, bone-marrow-derived macrophages, splenocyte-derived macrophages, as well as peritoneal exudate or resident peritoneal macrophages (Chen et al., 1979; Chitu et al., 2009; Stanley et al., 1978). In addition, we describe methods for the immunohistochemical identification of macrophages (Basic protocol 4) and the determination of microglial growth in vivo by immunofluorescence (Basic protocol 5).
The second part describes the characterization of macrophage differentiation through the analysis of the expression of CSF-1 receptor (CSF-1R) (Basic protocol 6). Colony stimulating factor-1 (CSF-1) is the primary regulator of macrophage differentiation, survival and proliferation in the mouse (Cecchini et al., 1994; Stanley et al., 1978). The CSF-1 receptor (CSF-1R), encoded by the c-fms proto-oncogene (Sherr et al., 1985), is an excellent marker of cells of the monocytic lineage (monoblast → promonocyte → monocyte → macrophage) (Byrne et al., 1981). While it is expressed at low levels on hematopoietic stem cells (Akashi et al., 2003; Sarrazin et al., 2009) its expression increases ~10 fold at the earliest stage of commitment to the monocytic lineage (colony forming unit - macrophage (CFU-M)) and is further upregulated on their adherent progeny (monoblasts → promonocyte → monocyte → macrophage) (Bartelmez et al., 1989; Tushinski et al., 1982). In peripheral blood, CSF-1R mRNA is found in both granulocytes and monocytes. However, CSF-1R protein expression is not detected in granulocytes (Sasmono et al., 2007). These data indicate that the CSF-1R is a good marker of cells of the monocytic lineage. In addition, measurement of the level of CSF-1R expression is useful, in combination with other cell surface markers, for the analysis of differentiation along the monocytic lineage. In Basic Protocol 6 we provide a protocol for the detection of cell surface CSF-1R in bone-marrow-derived monocytic lineage cells by FACScan. A protocol for the characterization o f monocytes/macrophages using three-color immunofluorescence was previously published by Riedy and Stewart (CPI Unit 14.2.8, 1995).
BASIC PROTOCOL 1 DETERMINATION OF MACROPHAGE PRECURSOR NUMBERS AND GROWTH IN VITRO
This protocol describes an assay designed to measure the abundance of macrophage progenitors in hematopoietic tissues (e.g. bone marrow, spleen). Tissues are dispersed and the cells are plated at low density in 0.3% agar over a 1% agar feeder layer containing CSF-1. Since only the primitive macrophage precursors (CFU-M) generate colonies, the number of colonies formed is a direct measure of the abundance of macrophage precursors in the tissue. The diameter of these colonies is indicative of the proliferative capacity and degree of differentiation of their progenitors.
NOTE: The quantities indicated below are sufficient for plating bone marrow and splenic samples from 10 mice in triplicate or quadruplicate. They should be adjusted proportionally for individual experimental needs.
Materials
Mice, 6–10 weeks old
Bacto-Agar (Difco)
α-MEM powder (Gibco)
Human recombinant CSF-1 (Pro-Spec)
1% agar in double-distilled water, bring to boil 3x to sterilize, equilibrate and keep at 41°C to avoid gelling
0.66% agar in double-distilled water, sterilized
1× α-MEM: 6.33g α-MEM powder, 0.21g glutamine, 17.5 g Gentamycin, 1.75g NaHCO3, double distilled water to 420 ml, filter sterilized.
2× complete α-MEM: 3.165g α-MEM powder, 0.105g glutamine, 8.75 g Gentamycin, 0.875g NaHCO3, double distilled water to 105 ml, filter sterilize, then add 70ml (40%) FCS.
6% acetic acid in 1× α-MEM.
0.4% Trypan Blue in PBS
35 and 150 mm diameter tissue culture dishes (BD Bioscience)
41°C water bath
37°C, 5% CO2 humidified tissue culture incubator
Inverted microscope equipped with a digital camera.
4% (v/v) paraformaldehyde in PBS
40-mesh sieve
100-mm Petri dishes
35-mm tissue culture plates
22G needles
5-ml syringes
15ml conicalcentrifuge tubes
Inage J software (http://rsweb.nih.gov/ij/download.html)
Day 0: Prepare the feeder layer
-
1
Prepare 1% agar in 5.5 ml aliquots, equilibrate at 41°C
-
2
Prepare 2× complete α-MEM, add CSF-1 to 54ng/ml, make 15ml aliquots, equilibrate at 41°C
-
3
Mix an aliquot of 1% agar with an aliquot of 2x complete α-MEM, homogenize well and add 1ml in each 35-mm diameter tissue culture plate.
CAUTION: To prevent gelling prior to plating, the underlayer mix should be kept at 41°C at all times and dispensed rapidly but carefully in the tissue culture plates to create a uniform layer. Plates should be kept on a flat surface until the agar solidifies (~ 2–3 min).
-
4
Create a humidified container by placing an uncovered 35mm tissue culture plate containing sterile double-distilled water in the center of a 150mm plate. Add 6 other 35 mm plates containing the feeder layer in each humidified container. Transfer to the incubator.
Day 1: Prepare cells for plating
-
5
Prepare 0.66% agar, equilibrate at 41°C
-
6
Prepare CFU-M agar mix by mixing 8.3ml 2× complete α-MEM with 11.7 ml 0.66% agar. Keep at 41°C.
-
7
Euthanize the mice. Dissect femurs and spleens, keep on ice in Petri dishes containing cold 1× α-MEM.
-
8
To maintain cell viability and sterility, all manipulations should be done on ice in a tissue culture hood. Place spleen on top of a 40-mesh sieve in a 100 mm Petri dish, add 4ml of cold 1× α-MEM and gently force the cells through the sieve using outer end of a sterile 5ml syringe plunger. Transfer the cells by Pasteur pipette to a 15ml centrifuge tube, rinsing the plate twice with 3ml cold 1× α-MEM to collect the remaining splenocytes.
-
9
Remove bone marrow cells from femurs by flushing (22G needle) with 1–2ml cold 1× α-MEM and transfer cells to a 15 ml centrifuge tube.
-
10
Make single cell suspensions by passing 5 times through a 22G needle. Centrifuge, 5 min at 400×g, 4°C. Resuspend in 10 ml cold 1× α-MEM. Mix by pipetting and add a 0.5ml aliquot of the cell suspension to a microfuge tube for counting.
-
11
To lyse the red blood cells, mix 1 part cell suspension with 3 parts 6% acetic acid in 1× α-MEM. Count in a hemocytometer and determine viability by trypan blue exclusion. Record bone marrow and splenic cellularity.
-
12
Dilute the bone marrow cell suspension to a density of 105 cells/ml and the splenocyte suspension to 2×10⁶ cells/ml, in final volume of 1ml. Keep on ice. For each experimental condition, add 0.5ml cell suspension to 2 ml CFU-M agar mix, mix well and plate 0.5 ml/plate (104 bone marrow cells or 2×10⁵ splenocytes/plate/3 plates) on top of the underlayer. Allow to gel on a flat surface (5–10 min), then place in the humidified container and transfer to the incubator.
Day 7: Evaluate colonies
-
13
Take out one humidified container at a time and count colonies containing more than 20 cells under the microscope. Fix cells with 4% paraformaldehyde in PBS, seal and store at 4°C. Calculate the number of CFU-M per femur or spleen taking into account tissue cellularity.
-
14
Take digital photographs of as many representative colonies/plate as possible. Measure their surface area using Image J (http://rsbweb.nih.gov/ij/download.html).
COMMENTARY
Background information
CFU-C (CFU in culture or CFU-CSF-dependent) assays refer to semi-solid culture assays in which CSFs are used to stimulate the proliferation and differentiation of the earliest progenitor cells that respond to each particular CSF alone. The progenitor cells generate discrete colonies (clones) of differentiated progenitor cells in the culture medium. By culturing at a non-limiting concentration of CSf, one observes a linear relationship between the number of cells plated and colony number, that is the basis of the assay (Stanley, 2009). The culture of the progenitors in semi-solid medium prevents the growth of other cell types (e.g. fibroblasts) in the serum-containing medium used, while the proliferation and differentiation of the progenitors are absolutely dependent on the addition of CSF. We and others have used the term CFU-M to refer to the progenitor which when incubated with CSF-1 gives rise exclusively to macrophages. The CFU-M assay can be used to monitor the changes in the frequencies of macrophage progenitors in disease and following various treatments or genetic manipulations.
Critical parameters and trouble shooting
For optimal culture conditions it is wise to pretest several batches of fetal calf serum.
The agar should not be autoclaved or boiled for too long.
To prevent premature gelling, the temperature of the agar medium should be maintained between 37°C–41°C. Care must be taken not to leave the cells in the agar medium at 41°C for more than the time necessary for plating. Gelling of the agar underlayer must be complete before addition of the overlayer and the overlayer must gel before incubation at 37°C.
Anticipated results
Typically 104 bone marrow cells harvested from the femurs of 6–9 week old BALB/c mice contain 60–80 CFU-M while 2× 10⁵ splenocytes contain 10–25 CFU-M. The average area of bone marrow-derived CFU-M colonies is ~3000 μm2 while splenic CFU-M are slightly smaller (~ 2000 μm2).
Time considerations
Depending on the number of mice to be analyzed and number of replicates for each condition, the preparation of the media and the plating of the underlayer takes 4–8h. Mouse dissection, harvesting of the bone marrow cells and splenocytes, cell counting and plating will take 8–10h for 6 mice. Data analysis including colony counting, fixation, photography and Image J analysis will take another 8–10h.
BASIC PROTOCOL 2 MEASUREMENT OF MACROPHAGE PROLIFERATION IN VITRO
This protocol describes an assay to measure macrophage proliferation by direct cell counting. Briefly, macrophages are plated at low density, maintained in media containing high concentrations of CSF-1 for two weeks and their growth is monitored daily. The cell numbers are plotted on a logarithmic scale and the doubling times during the exponential growth phase are calculated from the linear portion of the growth curve.
Materials
Macrophages: Primary macrophages or macrophage cell lines.
Complete medium: α-MEM supplemented with 10% FCS and 120ng/ml CSF-1 (ProSpec) PBS, ice-cold
1% (w/v) Zwittergent 3–14 (Calbiochem) stock in water, stored at 4°C
0.005% (w/v) Zwittergent working solution in PBS, freshly prepared and stored on ice
35 mm diameter tissue culture dishes (BD Bioscience)
Hemocytometer and Coulter Counter [*Copyeditor: the Coulter Counter should be listed as optional – RC]
Inverted microscope
-
1
Prepare primary macrophages from spleen or bone marrow (see Basic Protocol 1) and count viable cells using trypan blue dye exclusion (Appendix 3B). Resuspend in complete medium at 2×10⁴ viable cells/ml in a final volume of 45ml. Mix well by pipetting.
Macrophage cell lines may also be used.
-
2
Plate 1ml of cell suspension in each of 42 tissue culture dishes (triplicate samples for a 2-week culture period). Place the plates in a humidified incubator with 5% CO2 in air.
-
3
Every 24 hours, harvest and count the cells as follows:
-
3a
Siphon off the cell culture media
-
3b
Wash the monolayer with ice-cold PBS
-
3c
Add 1ml 0.005% Zwittergent to the monolayer. Incubate 5 min at room temperature.
-
3d
Harvest the cells by pipetting several times. Verify complete removal of cells from the dish by examination under an inverted microscope.
-
3e
Dilute the cell suspension 50-fold using Coulter Isoton counting fluid, mix well by Pasteur pipette and count using Coulter Counter.
-
3a
-
4
Starting from day 3, maintain CSF-1 concentrations and nutrients by completely replacing the media every 24 hours.
-
5
At the end of the experiment, enter all data into an Excel file and plot the log10 of the average cell number as a function of time (days) as shown in Figure 14.20.1 (upper panel). Identify the linear portion of the curve and plot the corresponding data in a new chart. In the new chart, add an exponential trend line, and calculate the doubling time from its equation (Figure 14.20.1, lower panel).
Fig. 14.20.1.
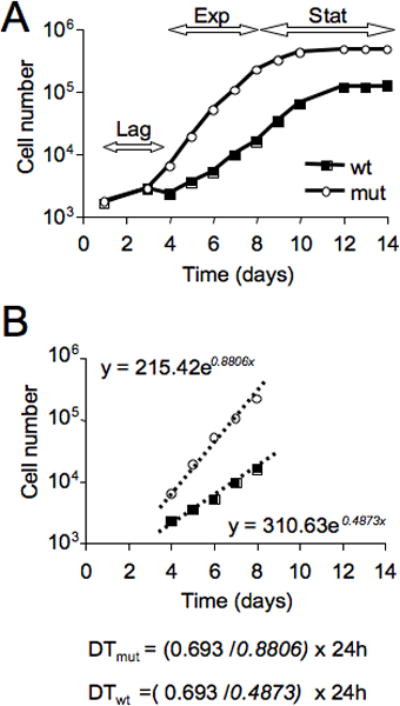
Analysis of CSF-1-stimulated macrophage growth. A) A typical growth curve of splenocyte-derived macrophages (SDM) cultured in the presence of 120ng/ml CSF-1. In the upper panel, the double-headed arrows delineate the lag, exponential growth (Exp) and stationary (Stat) phases for macrophages derived from a wild type (wt) mouse and a mouse possesing SDM that grow at a faster rate (mut). B) Calculation of the doubling times (measured in hours) of SDM using the data derived from the exponential growth phase identified in A).
COMMENTARY
Background information
Macrophages can be isolated from a variety of tissues (Stanley et al., 1978) including the liver (Chen et al., 1979), peritoneum (Worton RG, 1969) and pulmonary alveolae (Lin HS, 1975) or can be differentiated in vitro from bone marrow (Stanley, 1989; Tushinski et al., 1982) or splenic (Chitu 2009) precursors, or from blood monocytes (Lin HS, 1977). Unlike macrophage cell lines, which can be easily harvested by scraping with a permissable loss of cell viability, primary macrophages are very adherent to tissue culture dishes, resistant to trypsinization, and cannot be removed by non-enzymatic methods (i.e. scraping, or incubation with EDTA) without a significant (~70%) loss of cells. However, primary macrophages adhere loosely to Petri dishes. Thus, if the experiment requires amplification of the primary macrophage population before initiating the growth curve, we recommend their propagation by culture in Petri dishes. Macrophages can be harvested from Petri dishes without significant loss of viability by scraping following a 10 min incubation in 2mM EDTA in PBS at room temperature. They should be subsequently washed to remove the EDTA, resuspended in the cell culture media, counted in trypan blue to determine their viability and replated at the viable cell densities recommended in the protocol.
Critical parameters and trouble-shooting
Depending on their degree of differentiation, macrophage populations will grow at different rates. For example, primary bone marrow derived macrophages (BMM) have an average doubling time of 20h while splenocyte-derived macrophages have a doubling time of ~30h (Chitu et al., 2009). The initial plating density should be adjusted appropriately to allow for a logarithmic growth phase of at least 5–7 days. Typically, we start cultures of day 3 BMM at 2×10³ cells per 35mm dish and cultures of splenocytes or BAC1.2F5 splenic macrophages (Morgan et al, 1987) at 2 × 10⁴ cells/dish.
When used to compare the proliferation of different cell types, control cultures in the absence of CSF-1 should be included to simultaneously determine cell survival. Primary mouse BMM free of contaminating CSF-1-producing fibroblasts are dependent on CSF-1 for both survival and proliferation (Stanley et al., 1978; Tushinski et al., 1982). In the case of macrophage cell lines, CSf-1 dependence varies, e.g. BAC1.2F5 macrophages are CSF-1-dependent (Morgan et al., 1987) while RAW267.4 macrophages are CSF-1-independent (Raschke et al., 1978).
Anticipated results
A typical growth curve of splenocytes in the presence of CSF-1 is shown in Figure 14. 29.1.
Time considerations
A growth curve takes about 2 weeks to complete. Depending on the source of macrophages (i.e. cell lines in culture, or primary cells) the initial step of cell preparation and/or harvesting may take from 15 min to 3 days. Cell counting and plating at day 0 will take 1–2 h. Cell harvesting and counting from days 1–12 will take ~1h. The exchange of media for the remaining cells will take an additional hour during the first days and up to 30 min less during the last days of the experiment.
BASIC PROTOCOL 3 MEASUREMENT OF MACROPHAGE PROLIFERATION IN VITRO USING 48 WELL PLATES
This protocol describes a method for the determination of cell number by measuring the amount of DNA in cells grown on a multiwell plate. The DNA is stained with a fluorescent dye and measured with a microplate reader. This protocol allows the rapid, simultaneous estimation of macrophage proliferation in multiple cell lines.
Materials
Tissue culture medium: alpha modified minimal essential medium (αMEM) supplemented with 0.15mM asparagine, 20mM glutamine, and containing 0.05mM mercaptoethanol, 10% heat inactivated new born bovine serum (or fetal bovine serum) and 36ng/ml CSF-1 (for immortalized cell lines, or 120ng/ml for primary macrophages).
4′,6-diamidino-2-phenylindole, dihydrochloride (DAPI): make a 1mg/ml stock solution (1000X) in double distilled water. Aliquot the stock solution and store at −20°C. Caution: DAPI is a known mutagen and should be handled with care. The dye must be disposed of safely and in accordance with applicable local regulations. Excitation maximum for DAPI bound to dsDNA is 358 nm, and the emission maximum is 461 nm.
Staining buffer: 100mM Tris-HCl, 150mM NaCl, 1mM CaCl2, 0.5mM MgCl2, 0.1% NP-40, pH 7.4 at room temperature.
Phosphate buffered saline (PBS)
48 well tissue culture microplates
Microplate fluorescence reader with filters within ±5nm of 358nm for excitation and 461nm for emission (Polar Star Optima, BMG Labtech)
37°C tissue culture CO2 incubator
Hemocytometer or other cell counter
−70°C freezer or dry ice
Cells: primary macrophages (see discussions of Basic protocol 2 in the Commentary) or CSF-1-dependent macrophage cell lines (e.g. Bac1.2F5, Morgan et al., 1987)
Growing cells on microplates
-
Use one plate for the determination of the cell number of different cell lines for one time point. Plate cells in triplicate. Use 3 wells for the dye only control and another 3 wells for fluorescence determination of a known number of cells prepared and stored frozen as described in construction of calibration curve method 1 (below) and added in each plate on the day of the assay to normalize variation of fluorescence intensity measurements on different days.
Example of cell plating plan:
B C1 C3 C5 C7 C9 C11 C13 B C1 C3 C5 C7 C9 C11 C13 B C1 C3 C5 C7 C9 C11 C13 S C2 C4 C6 C8 C10 C12 C14 S C2 C4 C6 C8 C10 C12 C14 S C2 C4 C6 C8 C10 C12 C14 B = reagent blank without cells; S = standard reference with a known number of cells; C1 – C14 = different cell lines. Plate 3000 to 5000 cells in 0.5 ml medium per well at time zero.
Change medium every other day to maintain optimal amounts of growth factor and nutrients for cell proliferation.
Assay cell density on day 1 after plating and then every other day for up to 12 days.
Cell density measurement for adherent macrophages
Carefully aspirate by Pasteur pipette all medium from each well without disturbing the cells on the bottom of the well.
Replace the cover and place the plate in a −70°C freezer or on powdered dry ice for 15 minutes to freeze the cells (the plate can be stored in a −70°C freezer if the assay is not performed immediately).
Transfer the plate to room temperature and allow the cells to thaw completely (about 3 minutes).
Add 200μl of DAPI working solution (1 μg/ml) in staining buffer to each well and leave the plate in the dark at room temperature for 1 h.
Agitate the plate briefly to mix well contents, then measure the emission at 460nm with excitation at 355nm from each well in a fluorescence microplate reader.
Determine the cell number by matching the fluorescence measurement to the cell number from a calibration curve.
Cell density measurement for non-adherent macrophage cell lines
Pipette the culture medium up and down rapidly to resuspend the cells.
Transfer the cell suspension from each well to a 1.5 ml microfuge tube and centrifuge the tubes at 1000 × g for 1min at room temperature to pellet the cells.
Carefully aspirate the supernatant from the microfuge tube without disturbing the cell pellet with a 3ml syringe fitted with a G26 needle.
Freeze the cells in the tubes on dry ice for 15 min, and then thaw them for 3 min at room temperature (cells can be stored in a −70°C freezer if the assay is not performed immediately).
Add 100μl of DAPI working solution (1ug/ml) in staining buffer to the thawed cell pellet and vortex briefly to resuspend the cells.
Transfer the contents of each tube to a well in a 48 well microplate. Wash the tube by adding 100μl of DAPI working solution, vortexing and centrifuging (1,000 × g for 15 sec) to collect the solution from the sides of the tube. Transfer the DAPI wash to the same well and incubate the plate at room temperature in the dark for 1h.
Agitate the microplate briefly to mix, then measure the emission as described for adherent cells.
Construction of the calibration curve for the conversion of fluorescence measurement to cell number
Two methods can be used to construct a calibration curve for the conversion of fluorescence measurement to cell number. Method 1 will give the actual number of cells, but involves more steps. Method 2 will give the number of cells attached to the plate after cell plating. However, this will be less than the actual number of cells plated as some cells will not adhere.
Eight different concentrations of cells (4, 10, 20, 40, 70, 100, 200 and 400 × 103 cells per well) are used to construct a calibration curve which is linear in both double log and double linear plots of cell number against fluorescence units. Double log plots give a better distribution of points than the double linear plots. The total number of cells required to construct the curve in triplicate is 2.6 × 10⁶ and this quantity can be harvested from a 70% confluent 100mm dish culture.
Method 1
Detach cells from the plate by scraping (or treatment with EDTA) in PBS.
Collect the cell suspension in a 15 ml conical polypropylene tube. Cap the tube and centrifuge the cell suspension at 400 × g for 3 min to pellet the cells. Carefully aspirate off the supernatant and resuspend the cells in 0.4ml PBS.
Count and dilute the cells to 2000/μl in PBS as a stock cell suspension.
-
Pipette the cell suspension into labeled 1.5ml microfuge tubes as tabulated in the table below, in triplicate.
Cell number 4 × 10³ 10 × 103 20 × 103 40 × 103 70 × 103 100 × 103 200 × 103 400 × 103 Vol. stock 2μl 5μl 10μl 20μl 35μl 50μl 100μl 200μl Pellet the cells in the tubes by centrifugation at 1000 ×g for 1min. Use a 1ml syringe fitted with a 26G needle to aspirate the supernatant carefully from the tubes containing more than 10μl of cell suspension without disturbing the cell pellet. No aspiration is necessary for tubes containing 10μl or less.
Follow steps 4 to 7 of Basic Protocol 3 for measurement of cell density of non-adherent cells.
Method 2
-
1
Prepare the cell suspension as described in Method 1 steps 1–2, but resuspend the cells in culture medium rather than PBS.
-
2
Count and dilute the cells to 2000/μl in culture medium as a stock cell suspension.
-
3
Pipette the indicated volumes of cells in triplicate into wells containing the volumes of medium indicated in the table below. Mix the cells with the medium in the well upon their addition.
Cell number 4 × 10³ 10 × 103 20 × 103 40 × 103 70 × 103 100 × 103 200 × 103 400 × 103 Vol. stock 2μl 5μl 10μl 20μl 35μl 50μl 100μl 200μl Medium in well 500μl 500μl 500μl 480μl 465μl 450μl 400μl 300μl -
4
Incubate the plate for 4 to 6 h in a humidified 37°C incubator in 5% CO2 in air, until the cells attach and begin to spread on the well.
-
7
Follow steps 4 to 7 of Basic Protocol 3 for measurement of cell density of non-adherent cells.
COMMENTARY
Background information
The net DNA content per cell in cell culture remains relatively constant in cultures of non-synchronously cycling cells. Thus, an accurate assay for total DNA content will reflect cell numbers accurately (Tushinski et al, 1982). In addition, assays based on DNA binding are generally independent of fluctuations in cellular metabolism. The development of fluorescence indicators which exhibit fluorescence enhancement upon DNA binding enable rapid cell quantitation in the multiwell microplate format. Dyes which have been used for cell quantitation include Hoechst 33258 (Labarca and Paigen, 1980; Latt and Stetten, 1976; Papadimitriou and Lelkes, 1993), Hoechst 33342 (Blaheta et al., 1991), DAPI (Kapuscinski and Skoczylas, 1978; McCaffrey et al., 1988), and propidium iodide (Dengler et al., 1995; Krishan, 1990; Wan et al., 1994). Although these fluorescence assays cannot accurately measure cells fewer than 1000 cells per sample, their simplicity of the procedure for these assays make them the method of choice for rapid and accurate determination of cell proliferation. The dyes are relatively inexpensive and any of the above dyes can be used in the protocol. Recently, more sensitive dyes have been developed for such assays and kits using these are available commercially that can detect as few as 100 cells per well in microplate assays (Jones et al., 2001).
Critical parameters and trouble-shooting
Although 96 well microplates have been used for the assay, we found that the larger growing surface of the wells of 48 well microplates yields lower variability in cell number and permits longer growing times for proliferation studies. Also, to more accurately estimate cell number it is important to use the same, or a very similar cell type, to construct the calibration curve.
Anticipated results
For the calibration curve, both the double log plot and the double linear plot of fluorescence intensity against cell number will give a straight line passing through the origin. Points will distribute more evenly in double log plot than linear plot. For comparative studies of growth rates among cell types, conversion of fluorescence intensity to cell number may not be necessary.
Time considerations
It will take about one hour and 30min to perform the assay of one plate. This includes 15 min to freeze the cells, 3min for thawing, 2 min for pipetting, 1h for fluorescence development, and about 5min for fluorescence measurement for each microplate. For multiple plates, additional time is only needed for the pipetting and fluorescence measurements.
BASIC PROTOCOL 4 DETERMINATION OF MACROPHAGE NUMBERS IN VIVO
This protocol describes a procedure for the identification of tissue resident macrophages in paraffin sections by immunohistochemistry using antibodies directed against the cell surface marker, F4/80.
Materials
Mouse paraffin-embedded tissue sections, 4μm thick
Histoclear (National Diagnostics)
90%, 80% and 70% ethanol (v/v) in double distilled water
PBS
Washing solution: 0.05% Tween-20 in PBS
Peroxidase quenching solution: 1% hydrogen peroxide in 50% Methanol (v/v) in PBS extemporaneously prepared by diluting 30% hydrogen peroxide.
Blocking solution: 2% normal rabbit serum in PBS; 100μl/slide
1% (v/v) Rat anti-F4/80 antiserum in PBS with 0.05% Tween-20; 100 μl/slide
Vectastain Peroxidase Rat IgG ABC kit (Vector Laboratories)
3, 3′ diaminobenzidine (DAB) substrate kit for peroxidase (Vector Laboratories)
Harris Hematoxylin solution modified 7.5% (Sigma)
Bluing solution: Ammonia water (0.5% v/v ammonium hydroxide pH 8), or Scott’s Tap Water Substitute for Histology (1% MgSO4, 0.067 % NaHCO3 in tap water)
Slide holders and staining trays
Humidified chamber for slide incubation
Glass coverslips 24 ×60 mm (Corning)
Mounting media Permount (Fisher Scientific)
Light microscope
Note 1: the F4/80 antigen is labile. Mice should be anesthetized and perfused with Periodate-Lysine-Paraformaldehyde-Glutaraldehyde (PLPG) fixative (Cecchini et al., 1994) before dissection. Alternatively, immediately after being euthanized, mice can be injected with 5ml PLPG in the left ventricle of the heart, however this procedure may disrupt tissue architecture by breaking capillaries and other small blood vessels.
Note 2: all procedures described below are performed at room temperature.
Additional reagents and equipment for immunohistochemical staining (Unit 24,1)
Dewaxing: place slides in slide holders and immerse in Histoclear for 5 min. Remove and immerse in fresh Histoclear for another 5 min. Repeat three more times or until there are no visible traces of paraffin on the slides.
Rehydration: immerse slides sequentially in 90% ethanol, followed by 80% ethanol and 70% ethanol (5 min immersions). Wash with PBS for 5 min, twice.
Quenching of endogenous peroxidase: immerse slides in peroxidase quenching solution, incubate 30 min. Remove slides and wash twice with PBS for 10 min.
-
Block Fc receptors and nonspecific antibody adsorption sites: place slides on a flat surface in a humidified incubation chamber. Remove excess liquid around the tissue by blotting carefully with Kimwipes. Add 100 μl blocking solution on top of each section and incubate 30 min.
Note: When handling a large number of slides caution should be taken that tissue sections do not dry out before being covered with the antibody solution.
Remove excess blocking solution around the tissue, add anti-F4/80 antibody, 100μl/section. Incubate for 1.5–2h in the humidified chamber.
Place slides in the slide holder and wash away unbound antibody by immersing the slides in PBS with 0.05% Tween-20 for 5 min. Repeat.
Dilute the secondary biotinylated antibody (1 drop in 10 ml PBS with 1% rabbit serum and 0.05% Tween-20 (final conc ~0.5% v/v). Place slides in the humidified chamber and remove excess liquid around the tissue. Add 100 μl of diluted antibody to each section and incubate for 30 min.
Prepare VECTASTAIN ABC reagent: To 10 ml PBS with 0.05% Tween-20 add 2 drops reagent A, 2 drops reagent B, mix immediately and allow to stand for approximately 30 min before use.
Wash away unbound antibody as described in step 6.
Place slides in the humidified chamber and blot the excess liquid around the tissue. Add 100 μl VECTASTAIN ABC reagent to each section and incubate for 30 min.
Wash away unbound antibody as described in step 6.
Prepare peroxidase substrate solution (DAB): To 5 ml of double distilled water add 2 drops of buffer stock solution and mix well. Add 4 drops DAB stock solution and mix well, then add 2 drops hydrogen peroxide solution and mix well.
Place slides in the humidified chamber and blot the excess liquid around the tissue. Add 100 μl DAB substrate solution to each section and incubate for 2–10 min, periodically checking the color development under the microscope.
Counterstaining with blue hematoxylin (optional): Place slides in the slide holder and dip slowly in 7.5% hematoxylin. Incubate for 30–45 sec. Wash quickly by dipping in several baths of double distilled water until no more color washes off the slides. Dip in 0.5% bluing solution for 5 sec. Repeat the washing.
Dehydrate slides by immersing them sequentially for 5 min in 70% ethanol, followed by 80% ethanol, 90% and 100% ethanol (5 min immersions). Repeat the incubation in 100% ethanol. Mount slides with Permount.
Examine slides under a light microscope equipped with a video camera. If desired, count macrophages and calculate their density/mm2 in each section.
COMMENTARY
Background information
Tissue resident macrophages have a large array of functions including antigen or apoptotic cell phagocytosis, antigen presentation, secretion of antimicrobial and immunomodulatory agents as well as the secretion of factors involved in tissue repair and homeostasis. Macrophages adapt to the tissue microenvironment by modulating their pattern of gene expression, which leads, among other phenotypes, to changes in the expression of macrophage–specific markers. For example, in mouse, the F4/80 antigen is expressed in most mouse tissue macrophages, but is absent in the MOMA1+ macrophage subset (Table 14.20.1). In contrast, other antigens, such as Mgl 1 or CD169, are expressed only by a subset of the macrophage population of a tissue. Furthermore, antigens highly expressed in the monocytic lineage may also be expressed at lower levels in other myeloid cell types such as granulocytes, or dendritic cells, as well as in non-myeloid cells (Table 14.20.1). A good example is the widely used human monocyte/macrophage marker CD14 which is also expressed in granulocytes, epithelial and myoepithelial cells, cornea, smooth muscle, fibroblasts, spermatozoa and pancreatic islet beta cells (Jersmann, 2005). Thus, both the nature of the target tissue and the possible cross-reactivity of antibodies should be taken into account for optimal macrophage detection.
Table 14.20.1.
Antibodies Used to Identify Subpopulations of Tissue-resident Macrophages
| Species | Antigen | Antibody/clone | Reacts with the following MΦ populations | Does not recognize the following MΦ populations | Reacts with other cell types | Reference |
|---|---|---|---|---|---|---|
| Homo sapiens | CD68 | PG-M1 | Most tissue MΦ, LC | Myeloid precursors | Atypical MC, Schwann cells | (Horny et al., 1993) (Kaiserling et al., 1993) (Kunisch et al., 2004) |
| CD163 | RM3/1 | SK, IN, KC, AM, Pla, Thy, SPL red pulp, 20% of PB Mo, MΦ in inflamed tissue | Splenic white pulp MΦ, most alveolar MΦ | PB DC precursors, DC | (Zwadlo et al., 1987) (Mues et al., 1989) (Högger et al., 1998) |
|
| CD169 | 7–239 | SPL, LN, BM, LV, CO, LG | PB Mo | (Hartnell et al., 2001) | ||
| Iba-1 | AIF-1 | Activated MΦ, microglia | (Hirasawa et al 2005) | |||
| MRP14 (L1 Ag) | MAC387 | Tissue MF, PB Mo, 10% alveolar MΦ | GR, MC, KC | (Chilosi et al., 1990; Goebeler et al., 1994; Schluesener et al., 1998) |
||
| Unknown | PM-2K | Tissue MΦ | PB Mo, PM, microglia, LC | (Takeya et al., 1991) | ||
| Unknown | YTH 8.18 | All tissue MΦ, 50% PB Mo | LC | All PB GR | ||
| Mus musculus | CD115 (CSF-1R) | AFS-98 | Most MΦ populations | RPTEC, epithelial cell and neuron subpopulations | (Sudo et al., 1995; Wang et al., 1999) (Menke et al., 2009) |
|
| CD169 | MOMA-1 | SPL marginal zone metallophillic MΦ capsular, and medullary sinus LN MΦ, M Φ in lamina propria of the villi of the small IN, some Peyer’s patches MΦ, KC | PM, BM MΦ, PB Mo, M Φ in Thy, BR, K, LV, SK, H | (Kraal and Janse, 1986; Oetke et al., 2006) | ||
| CD209b | ER-TR9 | SPL and LN marginal zone MΦ | (Leenen et al., 1994) (Dijkstra et al., 1985b) |
|||
| ER-HR3 | ER-HR3 | ~70% PB Mo, 30% BM cells, SPL red pulp MΦ, LN paracortex, interfollicular areas of Peyer’s patches, K, Thy cortex, GI tract, LC | DC | (de Jong et al., 1994) | ||
| F4/80 | CI: A3-1 | Most MΦ populations, KC, LC, microglia | MOMA1+ MΦ | Freshly isolated SPL DC, eosinophils | (Austyn and Gordon, 1981) (Hume et al., 1983) (Mc Garry and Stewart, 1991) |
|
| Mgl1 | ER-MP23 | MΦ located in the connective tissue near epithelia | Intestinal lamina propria MΦ | (Leenen et al., 1994) (Dupasquier et al., 2004) |
||
| MOMA-2 | MOMA-2 | MΦ in most lymphoid tissues, mature MΦ subsets, Mo, few precursors in BM | Microglia, marginal zone MΦ | DC | (Kraal et al., 1987) | |
| Monts-4 | Monts-4 | MOMA-1+ and MOMA-2+ MΦ | Most SPL red pulp MΦ l | (Jutila et al., 1993) | ||
| Rattus norvegicus | CD68 | ED1 | Most tissue MΦ | PB GR, GR in ischemic brain | (Dijkstra et al., 1985a; Matsumoto et al., 2007) |
|
| CD163 | ED2 | Tissue resident MΦ, Thio- MΦ KC, | PB Mo | (Dijkstra et al., 1985a; He et al., 2009) |
||
| CD169 | ED3 | MΦ in lymphoid organs and inflamend tissues | PB MΦ, MΦ in healthy tissues | (Dijkstra et al., 1985a) | ||
| Unknown | KiM2R | All tissue resident MΦ, | PB Mo, LC | (Martin et al., 1989) | ||
| Unknown | RM1 | Most tissue resident MΦ | SkM MΦ populations | (McLennan, 1996; Takeya et al., 1989) |
||
| Unknown | TRPM-3 | SPL marginal MΦ, omentum MΦ, LN MΦ, PM | PB Mo | (Takeya et al., 1987) | ||
| Sus scrofa | CD68 | BA4D5 | SPL red pulp MΦ, cortical thymus MΦ, LN MΦ | (Ezquerra et al., 2009) | ||
| CD107a | 4E9/11 | SPL red pulp MΦ, LN, AM, KC | (Ezquerra et al., 2009) | |||
| CD163 | 2A10 | Tissue resident MΦ | (Ezquerra et al., 2009) | |||
| CD169 | 3B11, 1F1 | Tissue resident MΦ | PB Mo | (Ezquerra et al., 2009) | ||
| CD203a/SWC9 | PM18-7, C4 | AM, LV MΦ | (Ezquerra et al., 2009) |
AM, alveolar macrophages; BM, bone marrow; BR, brain; CO, colon; DC, dendritic cells; GR, granulocytes; IN, intestine; MC, mast cells; M√, macrophages; Mo, monocytes; K, kidney; KC, Kupffer cells; LC, Langerhans cells; LG, lung; LN, lymph node s; LV, liver; Pla, placenta; PB, peripheral blood; SK, skin; SPL, spleen; Thy, thymus.
Critical parameters and trouble-shooting
Efficient dewaxing is critical for the success of staining. While in the first two steps of dewaxing, recycled Histoclear can be used, only fresh Histoclear can be used for the the last two steps. Efficient blocking of the endogenous peroxidase by incubation in hydrogen peroxide as well as efficient blocking of Fc receptors and other nonspecific antibody adsorption sites are critical for specific staining. For blocking, the normal serum used should not be from the same species as the primary antibody. An appropriate negative control for the specificity of F4/80 staining using rat BM8 antiserum is a normal rat antiserum. If monoclonal antibodies are used, sections stained with a species and subtype-matched control immunoglobulin should be used as the negative control. Other negative controls include sections stained with the biotinylated secondary antibody or with the ABC detection reagent only.
Bluing solutions should be used with great care. The ideal pH is 8. At higher pHs, the solution may partially remove the hematoxylin. It may also wrinkle or cause the section to fall off the slide. This happens particularly with decalcified bone sections. Water or PBS carryover can dilute the bluing solution and acidify it (the pH of water is approximately 5). Thus, we recommend the use of freshly prepared bluing solutions.
Two different rat IgG clones recognizing the F4/80 antigen, clone CI:A3-1 and clone BM8, are available. These antibodies display a slightly different pattern of staining. Only clone CI:A3-1 reacts with microglia. In contrast, clone BM8 will recognize a slightly higher percentage of bone marrow, alveolar lavage, resident and thioglycollate-elicited peritoneal cells than clone CI:A3-1. F4/80 is useful as a macrophage marker only in mouse tissues. In human tissues, the F4/80 homologue, EGF-like module containing mucin-like hormone receptor (EMR1) is a highly specific marker for eosinophils and is not detectable in monocytes, macrophages, myeloid dendritic cells or basophils (Hamann et al., 2007).
Anticipated results
The BM8 antibody reacts with F4/80, a cell surface antigen while hematoxylin stains the nuclei. Macrophages will appear as brown patches on a blue background. The co-localization of macrophages with markers of cell proliferation on the same section utilizing immunohistochemical techniques is difficult due to antibody and substrate color compatibility issues. For such experiments, triple fluorescent labeling with DAPI (nuclear, blue) and FITC (green)- and PE (red)-coupled secondary antibodies on frozen sections is recommended. Alternatively, two consecutive sections can be stained separately with markers for macrophages and proliferation and examined side by side. The cell body of a macrophage measures ~ 21 μm, thus, it is very likely that if staining for both macrophage and proliferation markers is detected in the same location in 2 consecutive 4–8 μm sections, both markers label the same cell.
Time considerations
The staining procedure takes about 8 hours for up to 24 slides (1 full slide holder).
BASIC PROTOCOL 5: DETERMINATION OF MICROGLIAL PROLIFERATION IN VIVO
To evaluate macrophage proliferation in situ, the colocalization of a macrophage marker with sites of BrdU incorporation, or with the proliferative marker Ki67, can be examined (Ginoux et al., 2006). Another approach is to compare the pattern of staining in consecutive thin sections labeled with either macrophage or cell proliferation markers (Menke et al., 2009). Here we provide a protocol for tehidentification of proliferating microglia in brain tissue.
Materials
Mice, 6–8 weeks old
20 mg/ml BrdU in 154 mM NaCl, 7 mM NaOH
CO2 chamber for euthanasia
Dissection instruments
phosphate buffered saline (PBS)
4% paraformaldehyde (PFA) in PBS
30% sucrose in PBS
Embedding media: Tissue-Tek Cryo-Optimal Cutting Temperature (O.C.T.)
Compound (Fisher)
2N HCl
0.1M sodium borate solution, pH 8.5
0.1% Sodium borohydride
Humidified dark chamber
Blocking solution: 0.1% Triton X-100, 0.005% saponin, 10% goat serum, 1% bovine serum albumin (BSA) and 100 mM glycine in PBS
Staining buffer: 0.1% BSA, and 0.05% saponin in PBS
Primary antibodies: mouse IgG1 anti-BrDU (Nova Castra), and rabbit IgG anti-Iba1 (Wako Pure Chemical Industries, Ltd.)
Secondary antibodies: goat-anti mouse IgG1 – FITC (1:200) and goat anti-rabbit
IgG-TRITC (1:200) (Southern Biotechnology Associates, Inc., Al, USA)
Antifade-mounting media with DAPI (Molecular probes)
Glass coverslips 24 ×60 mm (Corning)
Fluorescence microscope
BASIC PROTOCOL 5: DETERMINATION OF MICROGLIAL PROLIFERATION IN VIVO
[*Copyeditor: We need an introduction here. The title needs to be amended to indicate the utility of the method, e.g. to measure proliferation of brain microglia and macrophages. – RC]
BrdU labeling
-
1
Inject mice intraperitonially with 100μl of 20 mg/ml BrdU in 154 mM NaCl, 7 mM NaOH. Euthanize by CO2 asphyxiation (UNIT 1.8) after 2hr. Immediately perfuse each mouse with 5ml cold PBS, followed by 15 ml of 4% PFA in PBS. Decapitate mice, remove skin and calvaria to expose the brain, and gently remove the brain from the skull socket with forceps.
Tissue embedding and sectioning
-
2
Cut brain into 1- to 2-mm sections (UNIT 12.4), then fix in 4%PFA in PBS, pH 7.4, 2 to 4hr for embryonic brain or 16hr for postnatal brain, at 4°C, with shaking on a rotating shaker.
-
3
Incubate successively in 15%, then 30% sucrose in PBS (1 hr in each solution for embryonic brain and 4 hr in each solution for postnatal brain) at 4°C, with rotation.
-
4
Embed in OCT, store blocks at −80°C and cut into 30μm thick sections. Store sections at −20°C.
Staining
-
5
Wash sections 3 times with PBS for 5 min.
-
6
Incubate in 2N HCl for 1 h at 37°C then neutralize by incubating in 0.1 M sodium borate solution, pH 8.5 for 10 min.
-
7
Quench with 0.1% Sodium borohydride for 10 min at room temperature.
-
8
Wash 3 times with PBS, each time for 5 min.
-
9
Incubate in blocking solution for 1 h at 4°C.
-
10
Wash 3 times with PBS, each time for 5 min.
-
11
Incubate with primary antibodies anti-BrdU, mouse IgG1 (1:100) polyclonal rabbit IgG anti-Iba1 (1:700) diluted in staining solution, overnight at 4°C.
-
12
Wash 3 times with PBS, each time for 5 min.
-
13
Incubate with secondary antibodies goat-anti mouse IgG1 –FITC (1:200) and goat anti-rabbit IgG-TRITC (1:200) diluted in PBS for 1 h 30 min at 4°C in a humidified dark chamber.
-
14
Wash 3 times with PBS, each time for 5 min.
-
15
Mount on glass coverslips using antifade-mounting media with DAPI. Examine by fluorescence microscopy.
COMMENTARY
Background information
Ionized calcium binding protein 1 (Iba1) is an adaptor protein selectively expressed in microglia and activated tissue macrophages (Hirasawa et al., 2005). BrdU (5-bromo-2′-deoxyuridine) is a thymidine analog that is incorporated into newly synthesized DNA, labeling cells that have progressed through the S-phase of the cell cycle. It is subsequently detected by a monoclonal antibody.
Critical parameters and trouble-shooting
In this protocol, the detection of incorporated BrdU requires DNA denaturation such as F4/80. This step can damage acid-sensitive antigens. To overcome this problem, other cell proliferation markers, such as Ki67, can be used. However, Ki67 will require heat-mediated antigen retrieval that can also damage some antigens. Thus, the decision regarding the best staining procedure must be made empirically. A third possibility is the use of the novel “click chemistry” coupling technique (Cappella et al., 2008). This technique is based on 5-ethynyl-2′-deoxyuridine (EdU) incorporation into newly synthesized DNA followed by coupling of BrdU azide to the incorporated EdU and detection with fluorescently-labeled anti-BrdU antibodies without a need for the denaturation or antigen retrieval step. Cell proliferation assay kits utilizing the click chemistry are now commercially available.
As with any staining procedure, negative control staining with species and isotype-matched antibody controls, as well as with secondary antibodies only, is recommended.
Anticipated results
Cell nuclei will appear blue fluorescent. All microglia in the tissue sections will appear red and all proliferating cells will appear green. Superimposition of the red and green signals in photoshop will allow the identification of proliferating macrophages and microglia.
Time considerations
The staining procedure takes about 4 h in the first day and 1–1.5 h in the second day.
BASIC PROTOCOL 6: MEASUREMENT OF CELL SURFACE CSF-1R WITH BIOTINYLATED AFS98 FOR CHARACTERIZATION OF MACROPHAGE DIFFERENTIATION
This procedure is used to characterize different populations of macrophage precursors of defined developmental stages based on the expression of surface markers (see Background Information). In this protocol, macrophages are stained with a biotinylated antibody AFS-98 which specifically recognizes cell surface CSF-1 receptor (CSF-1R), encoded by the c-fms proto-oncogene. The CSF-1R is detected by PE-labelled Streptavidin. The relative expression of cell surface CSF-1R is determined by FACScan. Because of the ability of biotin to interact with up to 6 molecules of streptavidin, this technique will detect CSF-1R with up to 12 times higher sensitivity than an indirect immunofluorescent labeling utilizing fluorescently–labelled secondary antibodies.
NOTE: All buffers should be pre-equilibrated at 4°C. To maintain cell viability and to avoid receptor-antibody complex endocytosis all incubations should be performed on ice.
NOTE: Avoid exposure to light once the fluorescently-labeled reagents are added.
Materials
Phosphate-buffered saline (PBS), ice-cold
Staining buffer: 1% BSA (Sigma) in PBS, ice cold. Make fresh and filter sterilize through a 0.45 μm filter.
Mouse BD Fc Block (rat IgG2b anti-mouse CD16/CD32)
Biotinylated Rat IgG 2a anti-CSF-1R AFS98 (eBioscience)
Biotinylated Rat IgG2a Isotype Control (eBioscience)
Streptavidin-PE (BD Pharmingen)
1% NaN3 in PBS, pH 7.4 (optional)
0.01% paraformaldehyde in 1% NaN3 in PBS pH 7.4 (optional)
Prepare the cells
-
1
Add 2–5×10⁵ monocytes/macrophages per sample to a 5 ml round-bottom polypropylene tube. Wash the cells with 2 ml of cold PBS to remove serum proteins prior to antibody staining. Centrifuge for 5 min at 400 × g, 4°C.
Stain the cells
-
2
Block Fc receptors: resuspend cell pellets in 100 μl staining buffer, add 2μl Fc blocking antibody. Incubate on ice for 15 min. Centrifuge for 5 min at 400 × g, 4°C.
-
3
Primary antibody binding: Decant supernatant and resuspend cells in 100 μl biotinylated AFS98 (1μg/ml) or control IgG-biotin (1μg/ml), diluted in staining buffer. Incubate for 30 min on ice. Add 1 ml of cold staining buffer. Centrifuge the tubes for 5 min at 400 × g, 4°C. Discard the supernatants. Wash twice with 2ml staining buffer. Pellet the cells and remove supernatant.
-
4
Detection: Resuspend cells in 100 μl of Streptavidin-PE (5μg/ml) in staining buffer. Mix well and keep in the dark on ice for 30 min. Add 1 ml 1% BSA in PBS. Centrifuge at 400 × g, 4°C, for 5min. Remove the supernatant. Wash the pellet twice with 2ml of cold staining buffer. Centrifuge for 5 min at 400 × g, 4°C and discard the supernatant.
Prepare cells for analysis
NOTE: If cells cannot be analyzed within 2–3 h of staining, skip steps 5–6 and fix the cells as described in step 7. Cell fixation is not suitable when cells should be retained for further culture.
-
5
Resuspend the cells in 500 μl staining buffer. Check the sample for cell clumping. If clumping is observed, filter the cell suspension through a 100 μm mesh filter prior to FACS analysis to prevent the clogging of the instrument. Keep the cell suspension on ice, in the dark.
-
6
Perform flow cytometric analysis.
Fixing the cells
-
7
After step 4, resuspend the cells in 100 μl staining buffer. Add 250 μl 0.01% paraformaldehyde, 1% NaN3 in PBS. Incubate 10–15 min on ice. Add 2ml PBS with 1% NaN3. Centrifuge for 5 min at 400 × g, 4°C. Decant the supernatant and resuspend the cells in 250 μl PBS with 1% NaN3. The sample should be stored in the dark at 4°C and can be analyzed within the next 2–3 days. Before submitting the sample for analysis check for cell clumping as described in step 5.
NOTE: Fixation may quench some fluorescent proteins such as GFP.
NOTE: Sodium azide is included in this step to prevent sample contamination via bacterial growth.
COMMENTARY
Background information
Unlike T lymphocytes, where functional and developmental subsets that can be readily distinguished by a combination of CD4, CD8, CD45RA and CD45RO surface markers, macrophages cannot be easily distinguished from other myeloid cells such as granulocytes or dendritic cells. So far, the attempts to separate populations of macrophage precursors of defined developmental stages based on the expression of surface markers typically leads to the isolation of monocyte precursor-enriched rather than pure monocyte precursor populations (Kondo et al., 2003). In Table 14.20.2., we have summarized what we consider to be the best documented combinations of cell surface markers useful for the isolation of macrophage progenitors at distinct developmental stages, from hematopoietic stem cells to late monocytes. Table 14.20.3. summarizes the markers available for examining monocyte maturation.
Table 14.20.2.
Candidate markers for isolating monocytic cells and their progenitors at defined stages of differentiation
| Species | Tissue | HSC | CMP | GMP* | CFU-M | CFU-G | Early Mo | Late Mo | Reference |
|---|---|---|---|---|---|---|---|---|---|
| Homo sapiens | BM/CB | Lin− CD34+ CD38− |
Lin− CD34+ CD38− CD45RA− IL-3Rlo |
Lin− CD34+ CD38− CD45RA+ IL-3Rlo |
CD34+ CD64+ CD115hi | CD34+ CD64+ CD115lo | CD14+ CD16− | CD14+ CD16+ | (Kondo et al., 2003) (Auffray et al., 2009) |
| Mus musculus | FL | CD150+ CD48− Sca1+ Lin− Mac1+ |
Lin− CD48+ CD150−CD244− | (Kim et al., 2006) | |||||
| BM | LSK CD48− CD150+ |
LSK Thy1− IL-7Rα− CD34+ CD16/32lo |
LSK Thy1− IL-7Rα− CD34+ CD16/32+ |
Mac1+ WGA+ Ly6C− |
Mac1+ WGA+ Ly6Chi |
(Auffray et al., 2009; Kondo et al., 2003; Schlueter and Glasgow, 2006; Yilmaz et al., 2006) | |||
| PB | Mac1+ WGA+ Ly6Chi CD43− |
Mac1+ WGA+ Ly6C− | (Schlueter and Glasgow, 2006) | ||||||
| Rattus norvegicus | FL/BM | Lin− Thy1+ CD71−Ox82+ − |
Lin− WGA+ | CD43− | CD43+ | (Crook and Hunt, 1996; Lucas et al., 1999; Yrlid et al., 2006) | |||
| Sus scrofa | BM | Lin− c-Kit+ | c-Kit+ CD172alo SWC8− 6D10− FSChi SSClo | c-Kit+ CD172alo SWC8− 6D10− FSChi SSClo | c-Kit − CD172alo SWC8 − FSCme/hi SSClo |
c-Kit − CD172alo SWC8lo FSCme/hi SSChi |
CD172ahi CD163− CD169− SWC8− |
CD172ahi CD163+ CD169lo SWC8− |
(Ezquerra et al., 2009) |
| PB | SWC1+ CD14hi CD163− SWC9− |
SWC1+ CD14lo CD163+ SWC9− | (Ezquerra et al., 2009) |
In addition to GMP, in mouse, a B220− CD19+ CD24+ CD43+ AA4.1+ IL7R+ common B-lymphocyte and monocyte precursor (BMP) has been identified (Kawamoto and Katsura, 2009). BM, bone marrow; CB, cord blood; PB, peripheral blood; FL, fetal liver; HSC, hematopoietic stem cell, CMP, common myeloid progenitor; GMP, granulocyte/macrophage progenitor, CFU-M, macrophage colony forming unit; CFU-G, granulocyte colony forming unit, Mo, monocyte; Lin−, lineage negative cells, typically obtained through negative selection with commercially available cocktails of lineage specific antibodies that deplete commited progenitors and differentiated cells Depletion of lineage negative cells if often accomplished with immunomagnetic beads(Shih et al., 1992). LSK, Lin− Sca-1+ c-Kit+ cells.
Table 14.20.3.
Antibodies used to characterize human and murine macrophage differentiation.
| Species | Antigen | Antibody | Expression within the monocytic lineage | Cross reactivity with non-monocytic cells | Reference | ||
|---|---|---|---|---|---|---|---|
| High | Low | Absent | |||||
| Homo sapiens | CD14 | Leu M3, My4, IOM2 | CD16− PB Mo, PM, DC | CD16+ PB Mo, AM | Myelomonocytic precursors, monoblasts, microglia | GR, some epithelial and myoepithelial cells, cornea, smooth muscle, B LΦ, fibroblasts, spermatozoa, pancreatic islet β-cells, mammary cells | (Ziegler-Heitbrock and Ulevitch, 1993) (Jersmann, 2005) |
| CD33 | MY9, L1B2, L4F3 | CFU-GEMM, CFU-GM, blasts, pro-myelocytes, BM myelocytes, CD14hi CD16− PB Mo | CD14lo CD16+ PB Mo, tissue MΦ | (Andrews et al., 1983) (Griffin et al., 1984) (Simmons and Seed, 1988) (Draude et al., 1999) |
|||
| CD172a/SIRP α | SE7C2 | Mo, MΦ, DC | CD34+ CD38− HSC, myelomonocytic precursors | GR, neurons, fibroblasts, endothelial cells | (van Beek et al., 2005; Veillette et al., 1998) | ||
| CD172b/SIRP β | B4B6 | Mo, MΦ, DC | CD34+ CD38− HSC | GR | (Seiffert et al., 2001) | ||
| Mus musculus | CD11b (Mac1) | M1-70* | Mature MΦ, some PB Mo | some Ly6-G1hi PB Mo | CFU-M, monoblast, LC, some tissue- resident MΦ | GR, NK, B LΦ subpopulations, activated memory T cells | (Leenen et al., 1994) (Sharpe et al., 2006) |
| CD31 | ER-MP12* | HSC, CFU-M, monoblasts | Mo | mature MΦ | GR, platelets, pro-thymocytes, T LΦ subpopulations | (Leenen et al., 1994) (Sharpe et al., 2006) |
|
| CD115 (CSF-1R) | AFS-98 | CFU-M, monoblast, pro-Mo Mo, M Φ | HSC, CFU-GEMM, CFU-GM | (Bartelmez et al., 1989; Bartelmez and Stanley, 1985; Tushinski et al., 1982) | |||
| F4/80 | BM8, CI: A3-1 | Mature MΦ | Mo | CFU-M, monoblast, MΦ in lymphoid microenvironments | Freshly isolated eosinophils, endothelial- like cells in BM stromal cultures | (Leenen et al., 1994; Sharpe et al., 2006) | |
| Ly6-C | ER-MP20* | SPL CFU-M, monoblasts | Late BM CFU-M, Mo | Most immature BM CFU-M, mature MΦ | GR, CD8+ T LΦ subpopulations | (Sharpe et al., 2006) (Leenen et al., 1994) |
|
| Unknown | ER-MP58* | CFU-GM, CFU-M | Mature MΦ | yes | (Leenen et al., 1994) | ||
Although these antibodies react preferentially with immature cells of the macrophage lineage, they also react with non-monocytic cells. To correctly identify macrophage precursors, it is suggested that these antibodies are used in combination with another macrophage marker, such as antibody to the CSF-1R or F4/80.
BM, bone marrow; PB, peripheral blood; HSC, hematopoietic stem cell; CFU-GEMM, granulocyte, erythrocyte, monocyte and megakaryocyte colony forming unit; CFU-GM, granulocyte and macrophage colony forming unit; CFU-M, macrophage colony forming unit; GR, granulocyte; LΦ, lymphocyte; NK, natural killer; LΦ, lymphocyte; Mo, monocyte; MΦ, macrophage; AM, alveolar MΦ; PM, peritoneal MΦ; Thyo-PM, thioglycollate–elicited peritoneal MΦ.
Critical parameters and trouble-shooting
Macrophages have many Fc-receptors on the cell surface thus, to avoid nonspecific antibody binding, it is advisable to block Fc receptors using a rat-anti mouse CD16/CD32 antibodies (Fc block). Note that under these circumstances the procedure described here cannot be adapted for the use of unconjugated rat primary antibody/fluorescently-labeled anti-Rat immunoglobuluin as a detection reagent because it will react with both Fc block and CSF-1R antibodies. This method also cannot be used for staining with antibodies that are directed against Fc-receptors (e.g., CD16, CD32).
Streptavidin contains the Arg-Tyr-Asp peptide that mimics the Arg-Gly-Asp peptide, which mediates the interaction of fibronectin with integrin receptors. Controls were macrophages are stained only with streptavidin should be performed and examined. If the background staining is high, the fluorescently-labeled streptavidin can be titrated to optimize the signal/noise ratio. In addition, because macrophages exhibit high autofluorescence, every experiment must include unstained samples as a control for intrinsic autofluorescence, which will be useful in setting the scan parameters. A high intrinsic autofluorescence may reduce the sensitivity of detection for antigens expressed at low density on macrophages.
Anticipated results
Figure 14.20.2. illustrates the increase in CSF-1R expression and in the frequency of CSF-1R-positive cells during macrophage differentiation from bone marrow precursors.
Fig. 14.20.2.
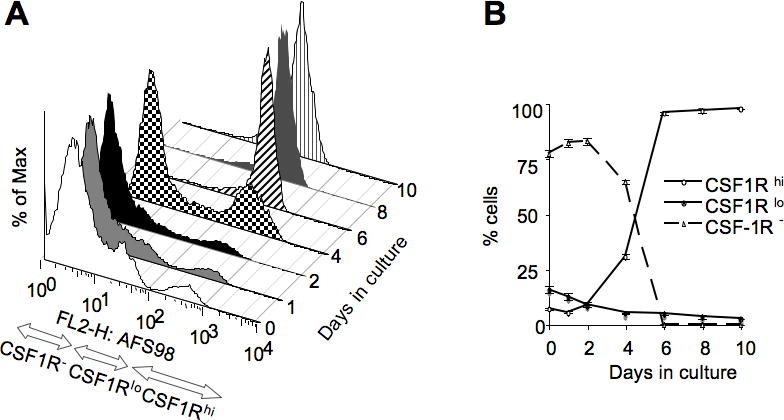
Increased CSF-1R expression and increased frequency of CSF-1R-expressing cells during macrophage differentiation from bone marrow cells using the procedure of Stanley ER (1989). A. Distribution of CSF-1R -positive and and -negative cells among nonadherent (days 0–3), adherent and nonadherent (day4) and adherent (days 6–10) macrophage and precursor populations. Note: At days 1–3 adherent cells include mature bone marrow macrophages as well as fibroblasts that are excluded from the analysis. Adherent cells at days 4–10 are generated by replating the day 3 non-adherent (macrophage precursor) fraction in media containing CSF-1 (Tushinski et al., 1982). B. Quantification of the dynamic changes in CSF1R−, CSF1R lo and CSF1R hi cell populations identified in A.
Time considerations
The time required to perform the staining is expected to be ~4h. Flow cytometric analysis will require a variable amount of time depending on the number of samples.
Acknowledgments
This work was supported by National Institutes of Health grants RO1 CA32551, CA26504 and P01 100324(to E.R.S.), K01AR 054486 (to V.C.), the Albert Einstein College of Medicine Cancer Center grant 5P30-CA13330, and a New York Community Trust Blood Diseases Grant (to V.C.).
Contributor Information
Violeta Chitu, Email: violeta.chitu@einstein.yu.edu.
E. Richard Stanley, Email: richard.stanley@einstein.yu.edu.
Literature Cited
- Akashi K, He X, Chen J, Iwasaki H, Niu C, Steenhard B, Zhang J, Haug J, Li L. Transcriptional accessibility for genes of multiple tissues and hematopoietic lineages is hierarchically controlled during early hematopoiesis. Blood. 2003;101:383–389. doi: 10.1182/blood-2002-06-1780. [DOI] [PubMed] [Google Scholar]
- Andrews R, Torok-Storb B, Bernstein I. Myeloid-associated differentiation antigens on stem cells and their progeny identified by monoclonal antibodies. Blood. 1983;62:124–132. [PubMed] [Google Scholar]
- Auffray C, Sieweke M, Geissmann F. Blood monocytes: development, heterogeneity, and relationship with dendritic cells. Annu Rev Immunol. 2009;27:669–692. doi: 10.1146/annurev.immunol.021908.132557. [DOI] [PubMed] [Google Scholar]
- Austyn J, Gordon S. F4/80, a monoclonal antibody directed specifically against the mouse macrophage. Eur J Immunol. 1981;11:805–815. doi: 10.1002/eji.1830111013. [DOI] [PubMed] [Google Scholar]
- Bartelmez S, Bradley T, Bertoncello I, Mochizuki D, Tushinski R, Stanley E, Hapel A, Young I, Kriegler A, Hodgson G. Interleukin 1 plus interleukin 3 plus colony-stimulating factor 1 are essential for clonal proliferation of primitive myeloid bone marrow cells. Exp Hematol. 1989;17:240–245. [PubMed] [Google Scholar]
- Bartelmez S, Stanley E. Synergism between hemopoietic growth factors (HGFs) detected by their effects on cells bearing receptors for a lineage specific HGF: assay of hemopoietin-1. J Cell Physiol. 1985;122:370–378. doi: 10.1002/jcp.1041220306. [DOI] [PubMed] [Google Scholar]
- Blaheta R, Franz M, Auth M, Wenisch H, Markus B. A rapid non-radioactive fluorescence assay for the measurement of both cell number and proliferation. J Immunol Methods. 1991;142:199–206. doi: 10.1016/0022-1759(91)90107-q. [DOI] [PubMed] [Google Scholar]
- Byrne P, Guilbert L, Stanley E. Distribution of cells bearing receptors for a colony-stimulating factor (CSF-1) in murine tissues. J Cell Biol. 1981;91:848–853. doi: 10.1083/jcb.91.3.848. [DOI] [PMC free article] [PubMed] [Google Scholar]
- Cappella P, Gasparri F, Pulici M, Moll J. Current Protocols in Cytometry. Unit 7.34. John Wiley & Sons, Inc; 2008. Cell Proliferation Method: Click Chemistry Based on BrdU Coupling for Multiplex Antibody Staining. [DOI] [PubMed] [Google Scholar]
- Cecchini M, Dominguez M, Mocci S, Wetterwald A, Felix R, Fleisch H, Chisholm O, Hofstetter W, Pollard J, Stanley E. Role of colony stimulating factor-1 in the establishment and regulation of tissue macrophages during postnatal development of the mouse. Development. 1994;120:1357–1372. doi: 10.1242/dev.120.6.1357. [DOI] [PubMed] [Google Scholar]
- Chen D, Lin H, Stahl P, Stanley E. Clonal growth in vitro by mouse Kupffer cells. Exp Cell Res. 1979;121:103–109. doi: 10.1016/0014-4827(79)90449-x. [DOI] [PubMed] [Google Scholar]
- Chilosi M, Mombello A, Montagna L, Benedetti A, Lestani M, Semenzato G, Menestrina F. Multimarker immunohistochemical staining of calgranulins, chloroacetate esterase, and S100 for simultaneous demonstration of inflammatory cells on paraffin sections. J Histochem Cytochem. 1990;38:1669–1675. doi: 10.1177/38.11.2212622. [DOI] [PubMed] [Google Scholar]
- Chitu V, Ferguson P, de Bruijn R, Schlueter A, Ochoa L, Waldschmidt T, Yeung Y, Stanley E. Primed innate immunity leads to autoinflammatory disease in PSTPIP2-deficient cmo mice. Blood. 2009;114:2497–2505. doi: 10.1182/blood-2009-02-204925. [DOI] [PMC free article] [PubMed] [Google Scholar]
- Crook K, Hunt S. Enrichment of early fetal-liver hemopoietic stem cells of the rat using monoclonal antibodies against the transferrin receptor, Thy-1, and MRC-OX82. Dev Immunol. 1996;4:235–246. doi: 10.1155/1995/85036. [DOI] [PMC free article] [PubMed] [Google Scholar]
- de Jong J, Voerman J, van der Sluijs-Gelling A, Willemsen R, Ploemacher R. A monoclonal antibody (ER-HR3) against murine macrophages. I. Ontogeny, distribution and enzyme histochemical characterization of ER-HR3-positive cells. Cell Tissue Res. 1994;275:567–576. doi: 10.1007/BF00318825. [DOI] [PubMed] [Google Scholar]
- Dengler W, Schulte J, Berger D, Mertelsmann R, Fiebig H. Development of a propidium iodide fluorescence assay for proliferation and cytotoxicity assays. Anticancer Drugs. 1995;6:522–532. doi: 10.1097/00001813-199508000-00005. [DOI] [PubMed] [Google Scholar]
- Dijkstra C, Döpp E, Joling P, Kraal G. The heterogeneity of mononuclear phagocytes in lymphoid organs: distinct macrophage subpopulations in the rat recognized by monoclonal antibodies ED1, ED2 and ED3. Immunology. 1985a;54:589–599. [PMC free article] [PubMed] [Google Scholar]
- Dijkstra C, Van Vliet E, Döpp E, van der Lelij A, Kraal G. Marginal zone macrophages identified by a monoclonal antibody: characterization of immuno- and enzyme-histochemical properties and functional capacities. Immunology. 1985b;55:23–30. [PMC free article] [PubMed] [Google Scholar]
- Draude G, von Hundelshausen P, Frankenberger M, Ziegler-Heitbrock H, Weber C. Distinct scavenger receptor expression and function in the human CD14(+)/CD16(+) monocyte subset. Am J Physiol. 1999;276:H1144–1149. doi: 10.1152/ajpheart.1999.276.4.H1144. [DOI] [PubMed] [Google Scholar]
- Dupasquier M, Stoitzner P, van Oudenaren A, Romani N, Leenen P. Macrophages and dendritic cells constitute a major subpopulation of cells in the mouse dermis. J Invest Dermatol. 2004;123:876–879. doi: 10.1111/j.0022-202X.2004.23427.x. [DOI] [PubMed] [Google Scholar]
- Ezquerra A, Revilla C, Alvarez B, Perez C, Alonso F, Dominguez J. Porcine myelomonocytic markers and cell populations. Dev Comp Immunol. 2009;33:284–298. doi: 10.1016/j.dci.2008.06.002. [DOI] [PubMed] [Google Scholar]
- Ginhoux F, Tacke F, Angeli V, Bogunovic M, Loubeau M, Dai XM, Stanley ER, Randolph GJ, Merad M. Langerhans cells arise from monocytes in vivo. Nat Immunol. 2006 doi: 10.1038/ni1307. in press. [DOI] [PMC free article] [PubMed] [Google Scholar]
- Goebeler M, Roth J, Teigelkamp S, Sorg C. The monoclonal antibody MAC387 detects an epitope on the calcium-binding protein MRP14. J Leukoc Biol. 1994;55:259–261. doi: 10.1002/jlb.55.2.259. [DOI] [PubMed] [Google Scholar]
- Griffin J, Linch D, Sabbath K, Larcom P, Schlossman S. A monoclonal antibody reactive with normal and leukemic human myeloid progenitor cells. Leuk Res. 1984;8:521–534. doi: 10.1016/0145-2126(84)90001-8. [DOI] [PubMed] [Google Scholar]
- Hamann J, Koning N, Pouwels W, Ulfman L, van Eijk M, Stacey M, Lin H, Gordon S, Kwakkenbos M. EMR1, the human homolog of F4/80, is an eosinophil-specific receptor. Eur J Immunol. 2007;37:2797–2802. doi: 10.1002/eji.200737553. [DOI] [PubMed] [Google Scholar]
- Hartnell A, Steel J, Turley H, Jones M, Jackson D, Crocker P. Characterization of human sialoadhesin, a sialic acid binding receptor expressed by resident and inflammatory macrophage populations. Blood. 2001;97:288–296. doi: 10.1182/blood.v97.1.288. [DOI] [PubMed] [Google Scholar]
- He Y, Sadahiro T, Noh S, Wang H, Todo T, Chai N, Klein A, Wu G. Flow cytometric isolation and phenotypic characterization of two subsets of ED2 (CD163) hepatic macrophages in rats. Hepatol Res. 2009 doi: 10.1111/j.1872-034X.2009.00528.x. in press. [DOI] [PubMed] [Google Scholar]
- Hirasawa T, Ohsawa K, Imai Y, Ondo Y, Akazawa C, Uchino S, Kohsaka S. Visualization of microglia in living tissues using Iba1-EGFP transgenic mice. J Neurosci Res. 2005;81:357–362. doi: 10.1002/jnr.20480. [DOI] [PubMed] [Google Scholar]
- Högger P, Dreier J, Droste A, Buck F, Sorg C. Identification of the integral membrane protein RM3/1 on human monocytes as a glucocorticoid-inducible member of the scavenger receptor cysteine-rich family (CD163) J Immunol. 1998;161:1883–1890. [PubMed] [Google Scholar]
- Horny H, Ruck P, Xiao J, Kaiserling E. Immunoreactivity of normal and neoplastic human tissue mast cells with macrophage-associated antibodies, with special reference to the recently developed monoclonal antibody PG-M1. Hum Pathol. 1993;24:355–358. doi: 10.1016/0046-8177(93)90081-q. [DOI] [PubMed] [Google Scholar]
- Hume D, Robinson A, MacPherson G, Gordon S. The mononuclear phagocyte system of the mouse defined by immunohistochemical localization of antigen F4/80. Relationship between macrophages, Langerhans cells, reticular cells, and dendritic cells in lymphoid and hematopoietic organs. J Exp Med. 1983;158:1522–1536. doi: 10.1084/jem.158.5.1522. [DOI] [PMC free article] [PubMed] [Google Scholar]
- Jersmann H. Time to abandon dogma: CD14 is expressed by non-myeloid lineage cells. Immunol Cell Biol. 2005:83. doi: 10.1111/j.1440-1711.2005.01370.x. [DOI] [PubMed] [Google Scholar]
- Jones LJ, Gray M, Yue ST, Haugland RP, Singer VL. Sensitive determination of cell number using the CyQUANT w cell proliferation assay. Journal of Immunological Methods. 2001;254:85–98. doi: 10.1016/s0022-1759(01)00404-5. [DOI] [PubMed] [Google Scholar]
- Jutila M, Berg E, Kroese F, Rott L, Perry V, Butcher E. In vivo distribution and characterization of two novel mononuclear phagocyte differentiation antigens in mice. J Leukoc Biol. 1993;54:30–39. doi: 10.1002/jlb.54.1.30. [DOI] [PubMed] [Google Scholar]
- Kaiserling E, Xiao J, Ruck P, Horny H. Aberrant expression of macrophage-associated antigens (CD68 and Ki-M1P) by Schwann cells in reactive and neoplastic neural tissue. Light- and electron-microscopic findings. Mod Pathol. 1993;6:463–468. [PubMed] [Google Scholar]
- Kapuściński J, Skoczylas B. Fluorescent complexes of DNA with DAPI 4′,6-diamidine-2-phenyl indole.2HCl or DCI 4′,6-dicarboxyamide-2-phenyl indole. Nucleic Acids Res. 1978;5:3775–3799. doi: 10.1093/nar/5.10.3775. [DOI] [PMC free article] [PubMed] [Google Scholar]
- Kawamoto H, Katsura Y. A new paradigm for hematopoietic cell lineages: revision of the classical concept of the myeloid-lymphoid dichotomy. Trends Immunol. 2009;30:193–200. doi: 10.1016/j.it.2009.03.001. [DOI] [PubMed] [Google Scholar]
- Kim I, He S, Yilmaz O, Kiel M, Morrison S. Enhanced purification of fetal liver hematopoietic stem cells using SLAM family receptors. Blood. 2006;108:737–744. doi: 10.1182/blood-2005-10-4135. [DOI] [PMC free article] [PubMed] [Google Scholar]
- Kondo M, Wagers A, Manz M, Prohaska S, Scherer D, Beilhack G, Shizuru J, Weissman I. Biology of hematopoietic stem cells and progenitors: implications for clinical application. Annu Rev Immunol. 2003;21:759–806. doi: 10.1146/annurev.immunol.21.120601.141007. [DOI] [PubMed] [Google Scholar]
- Kraal G, Janse M. Marginal metallophilic cells of the mouse spleen identified by a monoclonal antibody. Immunology. 1986;58:665–669. [PMC free article] [PubMed] [Google Scholar]
- Kraal G, Rep M, Janse M. Macrophages in T and B cell compartments and other tissue macrophages recognized by monoclonal antibody MOMA-2. An immunohistochemical study. Scand J Immunol. 1987;26:653–661. doi: 10.1111/j.1365-3083.1987.tb02301.x. [DOI] [PubMed] [Google Scholar]
- Krishan A. Rapid DNA content analysis by the propidium iodide-hypotonic citrate method. Methods Cell Biol. 1990:33. [PubMed] [Google Scholar]
- Kunisch E, Fuhrmann R, Roth A, Winter R, Lungershausen W, Kinne R. Macrophage specificity of three anti-CD68 monoclonal antibodies (KP1, EBM11, and PGM1) widely used for immunohistochemistry and flow cytometry. Ann Rheum Dis. 2004;63:774–784. doi: 10.1136/ard.2003.013029. [DOI] [PMC free article] [PubMed] [Google Scholar]
- Labarca C, Paigen K. A simple, rapid, and sensitive DNA assay procedure. Anal Biochem. 1980;102:344–352. doi: 10.1016/0003-2697(80)90165-7. [DOI] [PubMed] [Google Scholar]
- Latt S, Stetten G. Spectral studies on 33258 Hoechst and related bisbenzimidazole dyes useful for fluorescent detection of deoxyribonucleic acid synthesis. J Histochem Cytochem. 1976;24:24–33. doi: 10.1177/24.1.943439. [DOI] [PubMed] [Google Scholar]
- Leenen P, MdB, Voerman J, Campbell P, van Ewijk W. Markers of mouse macrophage development detected by monoclonal antibodies. J immunol Meth. 1994;174:5–19. doi: 10.1016/0022-1759(94)90005-1. [DOI] [PubMed] [Google Scholar]
- Lin H. Colony formation in vitro by mouse blood monocytes. Blood. 1977;49:593–8. [PubMed] [Google Scholar]
- Lin H-S, Kuhn C, Kuo TT. Clonal growth of hamster free alveolar cells in soft agar. J Exp Med. 1975;142:877–886. doi: 10.1084/jem.142.4.877. [DOI] [PMC free article] [PubMed] [Google Scholar]
- Lucas T, Krugluger W, Samorapoompichit P, Gamperl R, Beug H, Forster O, Boltz-Nitulescu G. Self-renewal, maturation, and differentiation of the rat myelomonocytic hematopoietic stem cell. FASEB J. 1999;13:263–272. doi: 10.1096/fasebj.13.2.263. [DOI] [PubMed] [Google Scholar]
- Martin M, Chauffert B, Caignard A, Pelletier H, Hammann A, Martin F. Histoimmunological characterization of the cellular reaction to liver metastases induced by colon cancer cells in syngeneic rats. Invasion Metastasis. 1989;9:216–230. [PubMed] [Google Scholar]
- Matsumoto H, Kumon Y, Watanabe H, Ohnishi T, Shudou M, Ii C, Takahashi H, Imai Y, Tanaka J. Antibodies to CD11b, CD68, and lectin label neutrophils rather than microglia in traumatic and ischemic brain lesions. J Neurosci Res. 2007;85:994–1009. doi: 10.1002/jnr.21198. [DOI] [PubMed] [Google Scholar]
- McCaffrey T, Agarwal L, Weksler B. A rapid fluorometric DNA assay for the measurement of cell density and proliferation in vitro. In Vitro Cell Dev Biol. 1988;24:247–252. doi: 10.1007/BF02623555. [DOI] [PubMed] [Google Scholar]
- McGarry MP, Stewart CC. Murine Eosinophil Granulocytes Bind the Murine Macrophage-Monocyte Specific Monoclonal Antibody F4/80. J Leukoc Biol. 1991:50. doi: 10.1002/jlb.50.5.471. [DOI] [PubMed] [Google Scholar]
- McLennan I. Degenerating and regenerating skeletal muscles contain several subpopulations of macrophages with distinct spatial and temporal distributions. J Anat. 1996;188:17–28. [PMC free article] [PubMed] [Google Scholar]
- Menke J, Iwata Y, Rabacal W, Basu R, Yeung Y, Humphreys B, Wada T, Schwarting A, Stanley E, Kelley V. CSF-1 signals directly to renal tubular epithelial cells to mediate repair in mice. J Clin Invest. 2009;119:2330–2342. doi: 10.1172/JCI39087. [DOI] [PMC free article] [PubMed] [Google Scholar]
- Morgan C, Pollard J, Stanley E. Isolation and characterization of a cloned growth factor dependent macrophage cell line, BAC1.2F5. J Cell Physiol. 1987;130:420–427. doi: 10.1002/jcp.1041300316. [DOI] [PubMed] [Google Scholar]
- Mues B, Langer D, Zwadlo G, Sorg C. Phenotypic characterization of macrophages in human term placenta. Immunology. 1989;67:303–307. [PMC free article] [PubMed] [Google Scholar]
- Oetke C, Kraal G, Crocker P. The antigen recognized by MOMA-I is sialoadhesin. Immunol Lett. 2006;106:96–98. doi: 10.1016/j.imlet.2006.04.004. [DOI] [PubMed] [Google Scholar]
- Papadimitriou E, Lelkes P. Measurement of cell numbers in microtiter culture plates using the fluorescent dye Hoechst 33258. J Immunol Methods. 1993;162:41–45. doi: 10.1016/0022-1759(93)90405-v. [DOI] [PubMed] [Google Scholar]
- Raschke W, Baird S, Ralph P, Nakoinz I. Functional macrophage cell lines transformed by Abelson leukemia virus. Cell. 1978:1. doi: 10.1016/0092-8674(78)90101-0. [DOI] [PubMed] [Google Scholar]
- Sarrazin S, Mossadegh-Keller N, Fukao T, Aziz A, Mourcin F, Vanhille L, Kelly Modis L, Kastner P, Chan S, Duprez E, et al. MafB restricts M-CSF-dependent myeloid commitment divisions of hematopoietic stem cells. Cell. 2009;138:300–313. doi: 10.1016/j.cell.2009.04.057. [DOI] [PubMed] [Google Scholar]
- Sasmono R, Ehrnsperger A, Cronau S, Ravasi T, Kandane R, Hickey M, Cook A, Himes S, Hamilton J, Hume D. Mouse neutrophilic granulocytes express mRNA encoding the macrophage colony-stimulating factor receptor (CSF-1R) as well as many other macrophage-specific transcripts and can transdifferentiate into macrophages in vitro in response to CSF-1. J Leukoc Biol. 2007;82:111–123. doi: 10.1189/jlb.1206713. [DOI] [PubMed] [Google Scholar]
- Schluesener H, Kremsner P, Meyermann R. Widespread expression of MRP8 and MRP14 in human cerebral malaria by microglial cells. Acta Neuropathol. 1998;96:575–580. doi: 10.1007/s004010050938. [DOI] [PubMed] [Google Scholar]
- Schlueter A, Glasgow J. Phenotypic comparison of multiple monocyte-related populations in murine peripheral blood and bone marrow. Cytometry A. 2006;69:281–290. doi: 10.1002/cyto.a.20262. [DOI] [PubMed] [Google Scholar]
- Seiffert M, Brossart P, Cant C, Cella M, Colonna M, Brugger W, Kanz L, Ullrich A, Bühring H. Signal-regulatory protein alpha (SIRPalpha) but not SIRPbeta is involved in T-cell activation, binds to CD47 with high affinity, and is expressed on immature CD34(+)CD38(−) hematopoietic cells. Blood. 2001;97:2741–2749. doi: 10.1182/blood.v97.9.2741. [DOI] [PubMed] [Google Scholar]
- Sharpe Er, Teleron A, Li B, Price J, Sands M, Alford K, Young P. The origin and in vivo significance of murine and human culture-expanded endothelial progenitor cells. Am J Pathol. 2006;168:1710–1721. doi: 10.2353/ajpath.2006.050556. [DOI] [PMC free article] [PubMed] [Google Scholar]
- Sherr C, Rettenmier C, Sacca R, Roussel M, Look A, Stanley E. The c-fms proto-oncogene product is related to the receptor for the mononuclear phagocyte growth factor, CSF-1. Cell. 1985;1985:3. doi: 10.1016/s0092-8674(85)80047-7. [DOI] [PubMed] [Google Scholar]
- Shih J, Zeng H, Ogawa M. Enrichment of murine marrow cells for progenitors of multilineage hemopoietic colonies. Lukemia. 1992;6:193–198. [PubMed] [Google Scholar]
- Simmons D, Seed B. Isolation of a cDNA encoding CD33, a differentiation antigen of myeloid progenitor cells. J Immunol. 1988;141:2797–2800. [PubMed] [Google Scholar]
- Stanley E. Murine bone marrow-derived macrophages. In: Walker JM, Pollard JW, editors. Animal Cell Culture. 2. Totowa, NJ: Humana Press; 1989. pp. 301–304. [Google Scholar]
- Stanley E, Chen D, Lin H. Induction of macrophage production and proliferation by a purified colony stimulating factor. Nature. 1978;274:168–170. doi: 10.1038/274168a0. [DOI] [PubMed] [Google Scholar]
- Stanley ER. Colony Stimulating Factor-1 Regulation of Macrophages in Development and Disease. In: Gordon S, editor. Innate Immunity: Host recognition and response in health and disease. The Biomedical & Life Sciences Collection, Henry Stewart Talks Ltd; London: 2009. [Google Scholar]
- Sudo T, Nishikawa S, Ogawa M, Kataoka H, Ohno N, Izawa A, Hayashi S, Nishikawa S. Functional hierarchy of c-kit and c-fms in intramarrow production of CFU-M. Oncogene. 1995;11:2469–2476. [PubMed] [Google Scholar]
- Takeya M, Hsiao L, Shimokawa Y, Takahashi K. Heterogeneity of rat macrophages recognized by monoclonal antibodies: an immunohistochemical and immunoelectron microscopic study. J Histochem Cytochem. 1989;37:635–641. doi: 10.1177/37.5.2649558. [DOI] [PubMed] [Google Scholar]
- Takeya M, Hsiao L, Takahashi K. A new monoclonal antibody, TRPM-3, binds specifically to certain rat macrophage populations: immunohistochemical and immunoelectron microscopic analysis. J Leukoc Biol. 1987;41:187–195. doi: 10.1002/jlb.41.3.187. [DOI] [PubMed] [Google Scholar]
- Takeya M, Tsuchiya T, Shimokawa Y, Takahashi K. A new monoclonal antibody, PM-2K, specifically recognizes tissue macrophages but not blood monocytes. J Pathol. 1991;163:315–321. doi: 10.1002/path.1711630408. [DOI] [PubMed] [Google Scholar]
- Tushinski R, Oliver I, Guilbert L, Tynan P, Warner J, Stanley E. Survival of mononuclear phagocytes depends on a lineage-specific growth factor that the differentiated cells selectively destroy. Cell. 1982;28:71–81. doi: 10.1016/0092-8674(82)90376-2. [DOI] [PubMed] [Google Scholar]
- van Beek E, Cochrane F, Barclay A, van den Berg T. Signal regulatory proteins in the immune system. J Immunol. 2005;175:7781–7787. doi: 10.4049/jimmunol.175.12.7781. [DOI] [PubMed] [Google Scholar]
- Veillette A, Thibaudeau E, Latour S. High expression of inhibitory receptor SHPS-1 and its association with protein-tyrosine phosphatase SHP-1 in macrophages. J Biol Chem. 1998;273:22719–22728. doi: 10.1074/jbc.273.35.22719. [DOI] [PubMed] [Google Scholar]
- Wan C, Sigh R, Lau B. A simple fluorometric assay for the determination of cell numbers. J Immunol Methods. 1994;173:265–272. doi: 10.1016/0022-1759(94)90305-0. [DOI] [PubMed] [Google Scholar]
- Wang Y, Berezovska O, Fedoroff S. Expression of colony stimulating factor-1 receptor (CSF-1R) by CNS neurons in mice. J Neurosci Res. 1999;57:616–632. [PubMed] [Google Scholar]
- Worton RG, McCulloch EA, Till JE. Physical separation of hemopoietic stem cells from cells forming colonies in culture. J Cell Physiol. 1969;74:171–182. doi: 10.1002/jcp.1040740209. [DOI] [PubMed] [Google Scholar]
- Yilmaz O, Kiel M, Morrison S. SLAM family markers are conserved among hematopoietic stem cells from old and reconstituted mice and markedly increase their purity. Blood. 2006;107:924–930. doi: 10.1182/blood-2005-05-2140. [DOI] [PMC free article] [PubMed] [Google Scholar]
- Yrlid U, Jenkins C, MacPherson G. Relationships between distinct blood monocyte subsets and migrating intestinal lymph dendritic cells in vivo under steady-state conditions. J Immunol. 2006;176:4155–4162. doi: 10.4049/jimmunol.176.7.4155. [DOI] [PubMed] [Google Scholar]
- Yu W, Chen J, Xiong Y, Pixley F, Dai X, Yeung Y, Stanley E. CSF-1 receptor structure/function in MacCsf1r−/− macrophages: regulation of proliferation, differentiation, and morphology. J Leukoc Biol. 2008;84:852–863. doi: 10.1189/jlb.0308171. [DOI] [PMC free article] [PubMed] [Google Scholar]
- Ziegler-Heitbrock H, Ulevitch R. CD14: cell surface receptor and differentiation marker. Immunol Today. 1993;14:121–125. doi: 10.1016/0167-5699(93)90212-4. [DOI] [PubMed] [Google Scholar]
- Zwadlo G, Voegeli R, Osthoff K, Sorg C. A monoclonal antibody to a novel differentiation antigen on human macrophages associated with the down-regulatory phase of the inflammatory process. Exp Cell Biol. 1987;55:295–304. doi: 10.1159/000163432. [DOI] [PubMed] [Google Scholar]