

Abstract
Identification of histone post-translational modifications (PTMs) is challenging for proteomics search engines. Including many histone PTMs in one search increases the number of candidate peptides dramatically, leading to low search speed and fewer identified spectra. To evaluate database search engines on identifying histone PTMs, we present a method in which one kind of modification is searched each time, for example, unmodified, individually modified, and multimodified, each search result is filtered with false discovery rate less than 1%, and the identifications of multiple search engines are combined to obtain confident results. We apply this method for eight search engines on histone data sets. We find that two search engines, pFind and Mascot, identify most of the confident results at a reasonable speed, so we recommend using them to identify histone modifications. During the evaluation, we also find some important aspects for the analysis of histone modifications. Our evaluation of different search engines on identifying histone modifications will hopefully help those who are hoping to enter the histone proteomics field. The mass spectrometry proteomics data have been deposited to the ProteomeXchange Consortium with the data set identifier PXD001118.
Keywords: histone, proteomics, post-translational modification, data analysis, search engine
Introduction
Mass spectrometry (MS) has become a key technique for proteomics analysis.1 The peptide-centric MS strategy is called bottom-up, in which proteins are extracted from cells, digested into peptides with proteases, and analyzed by liquid chromatography tandem mass spectrometry (LC–MS/MS). More specifically, peptides are resolved by chromatography, ionized in mass spectrometers, and scanned to obtain full MS spectra. Next, some high-abundance peptides (precursor ions) are selected and fragmented to obtain MS/MS spectra by high-energy C-trap dissociation (HCD) or collision-induced dissociation (CID). Then, peptides can be identified by searching the MS/MS spectra against a database and finally assembled into identified proteins.2 Database searching plays an important role in proteomics analysis because it can be used to translate thousands of MS/MS spectra into protein identifications (IDs).
Many database search engines have been developed to quickly and accurately analyze large volumes of proteomics data. Some of the more well-known search engines are Mascot,3 SEQUEST,4 PEAKS DB,5 ProteinPilot,6 pFind,7,8 Andromeda,9 OMSSA,10 and X!Tandem.11 However, the identification rate of MS/MS spectra is still low (e.g., in most searches, only 10–30% of spectra can be identified). There are many factors influencing peptide identification, such as incorrect precursor monoisotopic mass-to-charge ratio (m/z) or charge state, mixed MS/MS spectra from coeluted precursors, unspecific cleavage by proteases, unknown post-translational modifications (PTMs), incomplete databases, disability of search engines to distinguish similar sequences, spectra filtered out for low matching scores, and so on.12 Among all of these factors, incomplete PTM profiles are critical because PTMs usually are related to important biological functions. However, including a large number of PTMs in one database search increases the number of candidate peptides dramatically, leading to low search speed, more false-positive IDs, and fewer identified spectra. Therefore, confidently identifying more spectra with PTMs is a current major challenge in database searching.
There are few studies about how to filter search results and identify more spectra with PTMs. Fu et al. suggested that the individual PTM false discovery rate (FDR) rather than the global (unmodified and modified spectra searched together) FDR should be used when only PTM IDs are of interest13 and proposed a method to estimate the individual PTM FDR from the global FDR.14 Seo and coworkers analyzed the same sample multiple times by initially identifying unmodified peptides and adding them into an exclusion list for later runs.15 Huang and coworkers proposed an iterative search algorithm for the systematic identification of PTMs, in which unmodified spectra were identified by a basic search, and the leftover unidentified spectra were analyzed by iterative searches of many PTMs using a small number of them (usually two) each time.16
As a group of heavily post-translationally modified proteins, histones play several important roles in chromatin biology and epigenetics.17 Owing to their complex modification patterns, histones are known to be very challenging to analyze using conventional commercially available search methods and often require specific in-house developed software to properly deal with their data sets (e.g., MILP,18 PTMap,19 MS-TopDown,20 and FAVA-based workflow21). In this study, we present a method to evaluate database search engines on identifying spectra from histone peptides containing PTMs. In this method, no modification, each individual modification, and multiple PTMs are searched separately. Spectra of unmodified, individually modified, and multimodified peptides are obtained with a global FDR of <1%. After the database search with eight search engines (pFind, Mascot, SEQUEST, ProteinPilot, PEAKS, OMSSA in COMPASS,22 X!Tandem in TPP,23 and Andromeda in MaxQuant24), we combine the IDs from all of the search engines and obtain confident results by discarding the spectra identified by only one search engine. We find that pFind and Mascot identify most of the confident results. Our evaluation of different search engines on identifying histone modifications will be beneficial to those who are interested in histone proteomics analysis.
Materials and Methods
Data Sets
HeLa Cell Culture
As previously described,25 HeLa cells were cultured in suspension with minimum essential medium Eagle (MEM) Joklik modification for suspension cultures with 10% newborn calf serum (Thermo Scientific SH30118.03), 1% Glutmax, and 1% penicillin/streptomycin. The cell density was maintained within the range of (1 to 10) × 105 cells/mL. Histones were acid-extracted and subjected to chemical derivatization using propionic anhydride and trypsin digestion, as previously described.26 Samples were then desalted and injected onto an online nano-LC–MS/MS, as described in ref (26).
Nanoliquid Chromatography Tandem Mass Spectrometry
The samples were loaded onto one of the two instrument setups, as shown in Supplemental Table 1 in the SI, all at 300 nL/min. Histone peptides were resolved on a two-step gradient from 2% ACN to 30% ACN in 0.1% formic acid over 40 min, then from 30% ACN to 95% ACN in 0.1% formic acid over 20 min. Q-Exactive and Orbitrap Velos Pro were operated in the data-dependent mode with dynamic exclusion enabled (repeat count: 1, exclusion duration: 0.5 min). MS instrument methods were set up as previously reported.27 Settings for resolution, automatic gain control (AGC), and normalized collision energy (NCE) were listed in Supplemental Table 1 in the SI. Every cycle one full MS scan (m/z 290 to 1600) was collected and followed by 15 or 12 MS/MS scans using either HCD or CID. All isolation windows were set at 2.0 m/z. Ions with a charge state of one and a rejection list of common contaminant ions (including keratin, trypsin, and BSA) (exclusion width = 10 ppm) were excluded from MS/MS.
Database Search
Database and Data
Protein sequences and MS/MS spectra are prepared first. A histone fasta file is built from the Uniprot human database (57 entries, including H1, H2A, H2B, H3, and H4). Two data sets (noted as HCD_Histone and CID_Histone) are obtained from the same HeLa histone sample. We note that some precursor m/z values exported by the instrument software Xcalibur are not monoisotopic, and some MS/MS spectra are from two or more cofragmented peptides. Therefore, we use pParse to convert RAW files to MGF files by exporting the monoisotopic peaks of all precursors, including coeluted precursors.28 The MGF files are searched using pFind, Mascot, Sequest HT in ProteomeDiscoverer, ProteinPilot, and PEAKS. Because OMSSA in COMPASS, X!Tandem in TPP, and Andromeda in MaxQuant have their own input format, we then convert MGF files to TXT files for OMSSA, use ReAdW29 to convert RAW files to mzXML files for X!Tandem (in which some precursors are calibrated to the monoisotopic but no coeluted peptides are exported), and use RAW files directly for Andromeda. (In MaxQuant, the “second peptide” mode can detect some coeluted peptides.)
Search Parameters
Search parameters are set for all search engines. The version of each search engine is shown in Supplemental Table 2 in the SI. We set the following search parameters (as shown in Table 1): precursor mass tolerance ±10 ppm, fragment mass tolerance ±0.02 Th for HCD and ±0.4 Th for CID, trypsin only cleaving after arginine and up to two miscleavages, peptide N-terminal propionylation (Propionyl[Peptide N-term]/+56.026) as the fixed modification. To obtain more identification for different kinds of peptides, we set seven sets of variable modifications: (1) only Propionyl[K]/+56.026 for unmodified peptides, (2) Propionyl[K]/+56.026 and Acetyl[K]/+42.011 for acetylated peptides, (3) Propionyl[K]/+56.026 and Methyl_Propionyl[K]/+70.042 for monomethylated peptides, (4) Propionyl[K]/+56.026 and Dimethyl[K]/+28.031 for dimethylated peptides, (5) Propionyl[K]/+56.026 and Trimethyl[K]/+42.047 for trimethylated peptides, (6) Propionyl[K]/+56.026 and Phospho[ST]/+79.966 for phosphorylated peptides, and (7) all of the above modifications for multimodified peptides. In total, we have 112 searches (i.e., two data sets, eight search engines, and seven searches).
Table 1. Parameters for Database Search.
| precursor m/z tolerance (ppm) | ±10 | |
| fragment m/z tolerance (Th) | HCD: ± 0.02; CID: ± 0.4 | |
| fully enzymatic | trypsin cleaves after arginine | |
| max missed cleavages | 2 | |
| fixed modification | Propionyl[Peptide N-term]/+56.026 | |
| variable modifications | first(un) | Propionyl[K]/+56.026 |
| second(ac) | Propionyl[K]/+56.026; Acetyl[K]/+42.011 | |
| third(me) | Propionyl[K]/+56.026; Methyl_Propionyl[K]/+70.042 | |
| fourth(di) | Propionyl[K]/+56.026; Dimethyl[K]/+28.031 | |
| fifth(tr) | Propionyl[K]/+56.026; Trimethyl[K]/+42.047 | |
| sixth(ph) | Propionyl[K]/+56.026; Phospho[ST]/+79.966 | |
| seventh(co) | Propionyl[K]/+56.026; Acetyl[K]/+42.011; Methyl_Propionyl[K]/+70.042; Dimethyl[K]/+28.031; Trimethyl[K]/+42.047; Phospho[ST]/+79.966 | |
| database | 57 human histone proteins and their reversed form | |
Workflow
The workflow is shown in Figure 1. First, RAW files are converted to MGF files, TXT files, and mzXML files. Second, each search engine searches with separate modifications. Third, search results are filtered for separate modifications. The target-decoy approach is used in most search engines,30 except TPP, which uses probability to filter search results.31 An FDR of <1% at the spectra level is used to filter search results. Fourth, redundant IDs are removed. When there are redundant spectra in different searches for one specific engine, the peptide-spectral matches with higher scores are kept. Lastly, to obtain confident results, all filtered IDs for different search engines are combined. The number of search engines identifying one specific spectrum is counted, and spectra identified by only one search engine are filtered out.
Figure 1.

Workflow of evaluating database search engines on identifying histone modifications. There are five steps: (1) converting RAW files to MGF files, TXT files, and mzXML files, (2) searching with separate modifications, (3) filtering with FDR <1%, (4) removing redundant IDs from different searches with lower scores, and (5) combining IDs of all search engines.
Results
After generating the ID lists, we investigate the following results between search engines: (1) proportion of confident IDs, (2) proportion of overlapping IDs, and (3) search time and result space.
Proportion of Confident IDs
To compare different peptides, we categorize them as follows. If a peptide has only propionylation, it is an unmodified peptide. Otherwise, it is a modified peptide (i.e., it has acetylation, methylation, etc.). So from the first to the seventh set of search parameters, we can identify seven kinds of peptides individually: unmodified peptides (un), acetylated peptides (ac), monomethylated peptides (me), dimethylated peptides (di), trimethylated peptides (tr), phosphorylated peptides (ph), and multimodified peptides with different modifications coexisting (co), respectively.
To obtain confident results, we combine the IDs from all search engines. Although peptide identification is controlled by FDR less than 1%, the identification list may still include some false-positive results. If two or more search engines can identify one spectrum, the identification is considered confident. We therefore combine all IDs from the eight search engines together. More precisely, for a specific spectrum we count the number of search engines that identify the spectrum and then filter out the spectra that are identified by only one search engine.
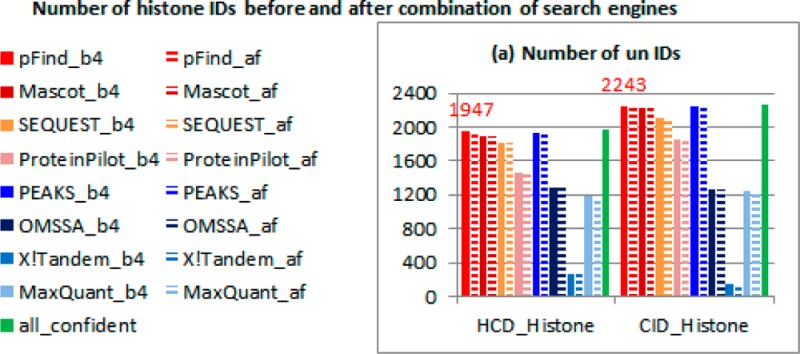
The number of IDs before and after combination of search engines is shown in Figure 2. The last green solid bar indicates all confident IDs. Other solid bars indicate IDs before combination. Dashed bars indicate IDs after combination. In the seventh search, PEAKS does not have any results because the program runs out of memory. Other programs, however, do not have such a problem. OMSSA identifies comparable unmodified and acetylated spectra to other search engines but identifies very few other modified spectra. X!Tandem identifies comparable individually modified spectra to other search engines, but it could not identify many unmodified and multimodified spectra. The remaining search engines, pFind, Mascot, SEQUEST, ProteinPilot, and MaxQuant, identify comparable spectra in all cases.
Figure 2.

Number of histone IDs before and after combination of search engines. The last green solid bar indicates all confident IDs. Other solid bars indicate IDs before combination. Dashed bars indicate IDs after combination.
To select suitable search engines for the analysis of histone modifications, we compare the confident results for each search engine (dashed bars in Figure 2). pFind, Mascot, SEQUEST, and PEAKS identify more confident spectra than the other search engines in general. Among these four search engines, SEQUEST and PEAKS identify the fewer acetylated spectra; PEAKS could not identify multimodified spectra; and pFind and Mascot behave better in most cases. Therefore, on the basis of results, we conclude that pFind and Mascot are the best search engines for the analysis of histone modifications.
To quantify the accuracy of search engines, we calculate the proportion of confident IDs (as shown in Table 2). The confident IDs by pFind are the spectra that are identified by pFind and at least one other search engine. All confident IDs are the spectra that are identified by at least two search engines. The precision of pFind is the proportion of confident IDs by pFind to all IDs by pFind (dashed red bar divided by solid red bar in Figure 2). The recall of pFind is the proportion of confident IDs by pFind to all confident IDs (dashed red bar divided by solid green bar in Figure 2). F-score is the harmonic mean of precision and recall, that is, F-score = 2/(1/Precision + 1/Recall). When the largest three F-scores (the third largest ≥80%) in each row are highlighted, it shows that pFind, Mascot, and PEAKS are the best three search engines. Because PEAKS is not good at identifying acetylated and multimodified spectra, pFind and Mascot are recommended.
Table 2. Proportions of Confident IDs for Each Engine.
| F-score (precision, recall)a | pFind | Mascot | SEQUEST | ProteinPilot | PEAKS | OMSSA | X!Tandem | MaxQuant | |
|---|---|---|---|---|---|---|---|---|---|
| HCD_Histone | un | 98%b (99%, 98%) | 98% (100%, 95%) | 96% (100%, 92%) | 84% (99%, 73%) | 98% (99%, 97%) | 79% (100%, 65%) | 24% (99%, 14%) | 73% (97%, 59%) |
| ac | 96% (97%, 95%) | 94% (97%, 91%) | 42% (87%, 28%) | 71% (97%, 55%) | 42% (98%, 27%) | 79% (98%, 67%) | 78% (92%, 67%) | 72% (87%, 62%) | |
| me | 95% (94%, 96%) | 93% (98%, 90%) | 85% (89%, 82%) | 55% (61%, 51%) | 80% (100%, 67%) | 0% (0%, 0%) | 52% (80%, 38%) | 58% (70%, 50%) | |
| di | 94% (95%, 94%) | 96% (99%, 93%) | 87% (79%, 97%) | 83% (97%, 73%) | 98% (99%, 96%) | 5% (100%, 2%) | 68% (97%, 53%) | 73% (92%, 60%) | |
| tr | 88% (88%, 87%) | 89% (96%, 84%) | 77% (68%, 88%) | 61% (95%, 45%) | 95% (94%, 96%) | 0% (0%, 0%) | 83% (98%, 72%) | 77% (82%, 72%) | |
| ph | 65% (50%, 93%) | 100% (100%, 100%) | 80% (67%, 100%) | 57% (86%, 43%) | 83% (100%, 71%) | 0% (0%, 0%) | 53% (100%, 36%) | 57% (57%, 57%) | |
| co | 81% (70%, 96%) | 84% (78%, 91%) | 45% (30%, 87%) | 63% (92%, 49%) | 0% (0%, 0%) | 0% (0%, 0%) | 5% (15%, 3%) | 36% (48%, 29%) | |
| CID_Histone | un | 99% (100%, 99%) | 99% (100%, 98%) | 96% (100%, 93%) | 90% (100%, 81%) | 98% (99%, 98%) | 72% (100%, 56%) | 12% (95%, 6%) | 71% (99%, 55%) |
| ac | 92% (88%, 96%) | 95% (93%, 97%) | 50% (79%, 36%) | 21% (88%, 12%) | 55% (99%, 38%) | 39% (99%, 24%) | 6% (70%, 3%) | 62% (59%, 65%) | |
| me | 96% (99%, 93%) | 95% (98%, 92%) | 73% (95%, 59%) | 53% (95%, 36%) | 95% (99%, 91%) | 0% (0%, 0%) | 57% (98%, 41%) | 78% (84%, 73%) | |
| di | 99% (98%, 100%) | 98% (97%, 99%) | 72% (92%, 59%) | 7% (67%, 4%) | 92% (94%, 91%) | 0% (0%, 0%) | 64% (93%, 49%) | 78% (99%, 65%) | |
| tr | 94% (95%, 94%) | 90% (97%, 83%) | 82% (83%, 80%) | 21% (17%, 28%) | 95% (97%, 94%) | 0% (0%, 0%) | 25% (92%, 14%) | 31% (96%, 19%) | |
| ph | 40% (25%, 100%) | 100% (100%, 100%) | 33% (20%, 100%) | 100% (100%, 100%) | 100% (100%, 100%) | 0% (0%, 0%) | 0% (0%, 0%) | 0% (0%, 0%) | |
| co | 52% (42%, 71%) | 57% (40%, 98%) | 50% (41%, 66%) | 48% (87%, 33%) | 0% (0%, 0%) | 0% (0%, 0%) | 0% (0%, 0%) | 15% (10%, 34%) | |
Precision = #IDs after combination/#IDs before combination. Recall = #IDs after combination/#all confident IDs, F score = 2/(1/Precision + 1/Recall).
Largest three F-scores (the third largest ≥80%) in each row are underlined.
Proportion of Overlapping IDs
To evaluate the similarity of search engines, we compare the overlapping of confident IDs between search engines. Figure 2 and Table 2 show that pFind and Mascot have more IDs than other search engines. We compare pFind to other search engines with confident IDs (as shown in Figure 3). Other-pFind indicates IDs only in the other search engine. pFind∩Other indicates IDs in both pFind and the other search engine. pFind-Other indicates IDs only in pFind. Compared with pFind∩Other, Other-pFind is small, which means pFind covers most IDs of the other search engine. Compared with pFind∩Mascot, pFind-Mascot is also small, which means pFind and Mascot get similar results.
Figure 3.

Number of confident IDs between pFind and other engines. Other-pFind indicates IDs only in the other search engine. pFind∩Other indicates IDs in both pFind and the other search engine. pFind-Other indicates IDs only in pFind.
To quantify the similarity of search engines, we calculate the proportion of overlapping IDs (as shown in Table 3). Common means IDs in both pFind and the other search engine. Common/pFind is the proportion of confident IDs in common with confident IDs by pFind. Common/Other is the proportion of confident IDs in common with confident IDs by the other search engine. The harmonic mean of these two ratios is 2/(1/(Common/pFind) + 1/(Common/Other)). When the largest three harmonic means (the third largest ≥80%) in each row are highlighted, it shows that Mascot has very similar results to pFind, and SEQUEST and PEAKS have less similar results to pFind.
Table 3. Proportions of Confident IDs between pFind and Other Engines.
| harmonic mean (Common/pFind, Common/Other)a | Mascot | SEQUEST | ProteinPilot | PEAKS | OMSSA | X!Tandem | MaxQuant | |
|---|---|---|---|---|---|---|---|---|
| HCD_Histone | un | 98%b (97%, 99%) | 97% (94%, 100%) | 84% (74%, 99%) | 98% (98%, 98%) | 78% (65%, 98%) | 24% (14%, 97%) | 74% (59%, 99%) |
| ac | 94% (92%, 96%) | 44% (28%, 97%) | 74% (58%, 100%) | 43% (27%, 96%) | 80% (68%, 97%) | 81% (69%, 98%) | 76% (63%, 96%) | |
| me | 94% (91%, 97%) | 90% (83%, 97%) | 69% (53%, 100%) | 82% (70%, 100%) | 0% (0%, 0%) | 54% (38%, 96%) | 64% (49%, 94%) | |
| di | 93% (93%, 94%) | 96% (98%, 94%) | 84% (75%, 96%) | 95% (96%, 94%) | 5% (2%, 100%) | 71% (55%, 98%) | 73% (60%, 93%) | |
| tr | 97% (95%, 99%) | 90% (91%, 89%) | 63% (47%, 92%) | 95% (100%, 90%) | 0% (0%, 0%) | 81% (74%, 90%) | 76% (69%, 84%) | |
| ph | 96% (100%, 93%) | 96% (100%, 93%) | 53% (38%, 83%) | 87% (77%, 100%) | 0% (0%, 0%) | 44% (31%, 80%) | 67% (54%, 88%) | |
| co | 95% (92%, 98%) | 91% (86%, 96%) | 63% (47%, 94%) | 0% (0%, 0%) | 0% (0%, 0%) | 6% (3%, 100%) | 46% (30%, 100%) | |
| CID_Histone | un | 99% (99%, 99%) | 97% (94%, 100%) | 90% (82%, 100%) | 98% (98%, 99%) | 72% (56%, 99%) | 11% (6%, 98%) | 71% (55%, 99%) |
| ac | 96% (97%, 96%) | 55% (38%, 100%) | 22% (13%, 100%) | 57% (39%, 100%) | 39% (24%, 97%) | 6% (3%, 100%) | 77% (65%, 95%) | |
| me | 96% (96%, 97%) | 77% (63%, 98%) | 56% (39%, 100%) | 92% (91%, 93%) | 0% (0%, 0%) | 61% (44%, 100%) | 81% (72%, 91%) | |
| di | 100% (99%, 100%) | 74% (59%, 100%) | 7% (4%, 100%) | 95% (91%, 100%) | 0% (0%, 0%) | 66% (49%, 100%) | 79% (65%, 100%) | |
| tr | 94% (89%, 100%) | 90% (83%, 97%) | 46% (30%, 99%) | 94% (94%, 93%) | 0% (0%, 0%) | 18% (10%, 68%) | 30% (18%, 89%) | |
| ph | 100% (100%, 100%) | 100% (100%, 100%) | 100% (100%, 100%) | 100% (100%, 100%) | 0% (0%, 0%) | 0% (0%, 0%) | 0% (0%, 0%) | |
| co | 83% (98%, 71%) | 75% (72%, 78%) | 54% (40%, 85%) | 0% (0%, 0%) | 0% (0%, 0%) | 0% (0%, 0%) | 35% (26%, 54%) | |
Common means IDs in both pFind and the other engine. Common/pFind = #IDs in common/#IDs in pFind, Common/Other = #IDs in common/#IDs in the other engine. Harmonic mean = 2/(1/(Common/pFind) + 1/(Common/Other)).
Largest three harmonic means (the third largest ≥80%) in each row are underlined.
Search Time and Result Space
Besides the accuracy of search engines, we also compare their search time and result space. We obtain the search time and size of the result files from the first to the sixth set of search parameters for each search engine. As the search time and result space are similar between the six searches for each search engine, we show only the median of time and space for each search engine (as shown in Table 4). PEAKS runs the most slowly, from 2 to 7 h. MaxQuant runs the second most slowly, ∼15 min. X!Tandem runs the fastest, ∼20 s. pFind and OMSSA run the second fastest, from 20 to 100 s. The MaxQuant results are the largest, from 200 to 600 MB. The OMSSA results are the smallest, from 1 to 5 MB. The pFind results are the second smallest, from 15 to 40 MB.
Table 4. Search Time and Result Spacea.
| median search time (s) for six searches |
||||||||
|---|---|---|---|---|---|---|---|---|
| pFind | Mascot | SEQUEST | ProteinPilot | PEAKS | OMSSA | X!Tandem | MaxQuant | |
| HCD_Histone | 45.25 | 263 | 83.4 | 140 | 24413 | 20 | 20.5 | 963 |
| CID_Histone | 46.15 | 313.5 | 127.2 | 441.5 | 5024.5 | 60 | 16.5 | 950.5 |
| median
result space (MB) for six searches |
||||||||
|---|---|---|---|---|---|---|---|---|
| pFind | Mascot | SEQUEST | ProteinPilot | PEAKS | OMSSA | X!Tandem | MaxQuant | |
| HCD_Histone | 37.1 | 111 | 105 | 76.65 | 78.3 | 3.45 | 77.475 | 348 |
| CID_Histone | 43.9 | 244 | 154 | 195 | 100.5 | 4.85 | 127.25 | 559 |
Search time is obtained in the PC: processor with Intel Core i7-3770 CPU @ 3.4 GHz and 8 cores, RAM with 8 GB, 64-bit Windows 7 Professional.
Discussion
There are a couple of items to note from the histone database searches: (1) the performance on a reverse of the database, (2) distinguishing between mixed spectra of peptide isoforms, (3) dealing with the large search space of combinatorial PTMs, and (4) the usage and functions of search engines.
Performance on a Reverse of the Database
After the FDR is controlled <1% on acetylation for pFind, the score threshold of charge +2 is much higher than that of charge +4, which leads to less acetylated spectra identified. When checking the high-score spectra matched with reversed peptides, we find that these peptides are the reversed H4 4–17. When checking the peptide-spectral matches, we find that the reversed form is the same or even better than the original H4 4–17 (as shown in Supplemental Figure 1 in the SI). Because the first reversed peptide-spectral match score is too high, the score threshold for FDR < 1% also becomes much higher. If we delete the first three amino acids from H4, then the reversed H4 4–17 will disappear. Before modifying H4, for HCD_Histone with charges +2, +3, and +4, the score thresholds are 1.26 × 10–42, 3.09 × 10⁻¹⁴, and 7.51 × 10⁻⁷, respectively; the ID numbers are 354, 485, and 105, respectively. After modifying H4, for HCD_Histone with charges +2, +3, and +4, the score thresholds are 8.41 × 10⁻⁶, 7.05 × 10⁻⁵, and 7.51 × 10⁻⁷, respectively; the ID numbers are 1705, 623, and 105, respectively. Therefore, with the modified H4, we can get more acetylated IDs. We get the final results with the modified H4 database for other search engines.
Distinguishing between Mixed Spectra of Peptide Isoforms
Peptide isoforms can be defined as peptides with one kind of PTM on different sites (i.e., the same amino acids but different positions). Because histones are heavily modified, histone peptide isoforms are commonly observed. The biological functions of isoforms can be different, so it is important to distinguish them. Because their precursor masses are the same and retention time is close (sometimes even coeluting), it is difficult to distinguish isoforms using full MS scans. Fortunately, isoforms can be identified by the key fragment ions from MS/MS spectra between the PTM sites.
There are many peptide isoforms on H3, for example, K9ac and K14ac, K18me and K23me, K18ac and K23ac, and so on. Because the isoforms’ masses are the same and retention time is close, the MS/MS spectrum is a mixture of the isoforms. We take H3K18ac and H3K23ac in CID_Histone as an example (as shown in Supplemental Figure 2 in the SI). At the retention time of 35.88 min (scan no. 9756), K18ac/K23ac is 0.82:0.18. When we get the mixed spectra at different time points, we can calculate the ratio (K18ac/K23ac) by the intensity of key fragment ion pairs between K18 and K23 (e.g., b1 in K18ac and b1 in K23ac). Then, we can separate K18ac and K23ac with these ratios from the total chromatography peak. After the calculation, K18ac is 14% of the total chromatography peak. Therefore, MS/MS spectra can help to separate peptide isoforms and can even calculate the proportion of each part from the total chromatography peak.
Dealing with the Large Search Space of Combinatorial PTMs
Histones often carry multiple PTMs in vivo, and many histone peptides harbor combinatorial PTMs.32 Increasing evidence suggests that histone PTMs cross-talk (i.e., PTMs work together), and this is important for many biological processes. The peptide H3 9-17 has different known PTM combinations, including H3K9meK14ac, H3K9diK14ac, H3K9trK14ac, H3K9meS10ph, H3K9diS10ph, and H3K9trS10ph.
The seventh set of search parameters is used to identify combinatorial PTMs. The combinatorial search will lead to large search space and also more false-positive IDs. In CID_Histone, when we search on acetylation (the second search), the average number of candidate peptides is 102 if the peptide mass is <3000; the average number of candidate peptides is 104 if the peptide mass is >3000. When we search on combinatorial PTMs (the seventh search), the average number of candidate peptides is 103 if the peptide mass is <3000; the average number of candidate peptides is 107 if the peptide mass is >3000 (as shown in Supplemental Figure 3 in the SI). The spectra with precursor mass >3000 is only 4% of the total spectra, but their total candidate peptide number is 738-fold of the spectra with precursor mass <3000 in the seventh search. In the seventh search, pFind uses 51 s to search the spectra with precursor mass <3000 and 9168 s to search all spectra. In the second search, pFind uses 37 s to search the spectra with precursor mass <3000 and 48 s to search all spectra. The precursor mass >3000 leads to an extremely large number of candidate peptides and also combinatorial PTMs and more false-positive IDs. Therefore, it is better to only use the spectra with precursor mass <3000 for the combinatorial search.
Comparing the acetylated IDs in the second search and the seventh search, we find fewer IDs in the seventh search. For the number of candidate peptides of one specific spectrum, the increase in candidates can be 1000-fold in the seventh search, as compared with the second search. It is more likely to get a peptide-spectral match from the decoy database in the seventh search. The best score of the peptide-spectral match from the decoy database is much higher in the seventh search than in the second search (data not shown). This shows that fewer peptide-spectral matches are identified in the seventh search at the same FDR < 1%. This is the common problem when the database becomes larger.
Usage and Functions of Search Engines
There are some aspects that users need to know to correctly use these search engines: how to correctly input search parameters and the pros and cons.
The first aspect is the usage of search engines. Users need to know (1) how to add new items into search engines, (2) how to set search parameters, and (3) how to set filtering parameters. pFind, Mascot, SEQUEST, PEAKS, and MaxQuant provide user interfaces for adding new items such as modifications. OMSSA in COMPASS does not provide such a user interface, and the option to add new modifications is not functional. ProteinPilot does not provide user interfaces to add new items, although users can manipulate XML files, which are prone to casual mistakes. Although TPP has an XML editor online, it is difficult to use.
The second aspect is the pros and cons of search engines. According to our experience, each search engine has its pros and cons for the identification of histone modifications. (1) pFind finishes the first six searches in several minutes but finishes the seventh search with all spectra in several hours. (2) Mascot exhibits excellent performance in our data sets but cannot identify more than nine modifications in one search. (3) Sequest HT is much faster than the old SEQUEST version (e.g., v27 rev12) but cannot identify more than six modifications in one search. (4) ProteinPilot can identify many modifications in one search by assigning different probabilities beforehand, but the way to preprocess spectra does not work well (e.g., in pParse, the scan number and the precursor type of a filename can be put in different order; when the scan number is ahead such as histone.4.110.2.dta, very few spectra can be identified; when the precursor type is ahead such as histone.110.4.2.dta, many spectra can be identified). (5) PEAKS Studio has many powerful tools for de novo sequencing, database searching, and PTM discovery, but when the maximal allowed modification site per peptide becomes large (e.g, >3) or many modifications are considered PEAKS DB becomes slow or even runs out of memory. (6) OMSSA in COMPASS is fairly easy to use but except for acetylation other PTMs are not identified well. (7) X!Tandem in TPP is pretty fast but cannot identify modifications on the same residue (e.g., when Propionyl[K] and Acetyl[K] are both set as variable modifications, only the last modification is included in search, so Propionyl[K] has to be set as fixed modification and other PTMs’ masses minus the mass of Propionyl[K] are set as the variable modifications, but in the seventh search, only Trimethyl[K] and Phospho[ST] are included in search because ac, me, di, and tr all occur on lysine; this causes X!Tandem to be unable to identify many multimodified spectra). (8) Andromeda in MaxQuant has advantages for analyzing SILAC data,33 but the speed becomes slow due to 38 processing steps and fewer PTM spectra can be identified due to the too high default score threshold for modified peptides. (The default threshold is 40; in our parameters we set it to 0.)
Conclusions
Our aim is to compare search engines within the same histone PTM data set. We search the histone data with separate modifications, filter each search result with FDR <1%, discard the redundant IDs between different searches with low scores, and combine the search results of all search engines to obtain confident results. The high proportion of confident IDs demonstrates that pFind and Mascot are the best of the eight search engines for histone modification analysis. In conclusion, we present a method to evaluate database search engines, which can be used to evaluate other more database search engines; we discuss some important aspects during the analysis of histone modifications, which will be beneficial to those who are interested in histone proteomics analysis.
Acknowledgments
We thank all search engine developers and providers and Samuel Wein for manuscript review. B.A.G. acknowledges funding from an NIH Innovator grant (DP2OD007447) from the Office of the Director and the National Science Foundation (NSF) Early Faculty CAREER award.
Glossary
Abbreviations
- HCD
high-energy C-trap dissociation
- CID
collision-induced dissociation
- ID
identification
- PTM
post-translational modification
- FDR
false discovery rate
- un
unmodified
- ac
acetylation
- me
monomethylation
- di
dimethylation
- tr
trimethylation
- ph
phosphorylation
- co
combinatorial
Supporting Information Available
Nano-LC–MS/MS instrument settings (Supplementary Table 1), version of each search engine (Supplementary Table 2), peptide-spectral matches of reversed and original H4 4–17 (Supplementary Figure 1), separation of peptide isoforms K18ac and K23ac (Supplementary Figure 2), and number of peptide candidates in the second and the seventh searches (Supplementary Figure 3). This material is available free of charge via the Internet at http://pubs.acs.org. The mass spectrometry proteomics data have been deposited to the ProteomeXchange Consortium (http://proteomecentral.proteomexchange.org) via the PRIDE partner repository with the data set identifier PXD001118 and DOI 10.6019/PXD001118.
The authors declare no competing financial interest.
Funding Statement
National Institutes of Health, United States
Supplementary Material
References
- Aebersold R.; Mann M. Mass spectrometry-based proteomics. Nature 2003, 4226928198–207. [DOI] [PubMed] [Google Scholar]
- Domon B.; Aebersold R. Challenges and opportunities in proteomics data analysis. Mol. Cell. Proteomics 2006, 5101921–1926. [DOI] [PubMed] [Google Scholar]
- Perkins D. N.; Pappin D. J.; Creasy D. M.; Cottrell J. S. Probability-based protein identification by searching sequence databases using mass spectrometry data. Electrophoresis 1999, 20183551–3567. [DOI] [PubMed] [Google Scholar]
- Eng J. K.; McCormack A. L.; Yates John R. I. An Approach to Correlate Tandem Mass Spectral Data of Peptides with Amino Acid Sequences in a Protein Database. J. Am. Soc. Mass Spectrom. 1994, 511976–989. [DOI] [PubMed] [Google Scholar]
- Zhang J.; Xin L.; Shan B.; Chen W.; Xie M.; Yuen D.; Zhang W.; Zhang Z.; Lajoie G. A.; Ma B. PEAKS DB: de novo sequencing assisted database search for sensitive and accurate peptide identification. Mol. Cell. Proteomics 2011, 114M111010587. [DOI] [PMC free article] [PubMed] [Google Scholar]
- Shilov I. V.; Seymour S. L.; Patel A. A.; Loboda A.; Tang W. H.; Keating S. P.; Hunter C. L.; Nuwaysir L. M.; Schaeffer D. A. The Paragon Algorithm, a next generation search engine that uses sequence temperature values and feature probabilities to identify peptides from tandem mass spectra. Mol. Cell. Proteomics 2007, 691638–1655. [DOI] [PubMed] [Google Scholar]
- Fu Y.; Yang Q.; Sun R.; Li D.; Zeng R.; Ling C. X.; Gao W. Exploiting the kernel trick to correlate fragment ions for peptide identification via tandem mass spectrometry. Bioinformatics 2004, 20121948–1954. [DOI] [PubMed] [Google Scholar]
- Wang L. H.; Li D. Q.; Fu Y.; Wang H. P.; Zhang J. F.; Yuan Z. F.; Sun R. X.; Zeng R.; He S. M.; Gao W. pFind 2.0: a software package for peptide and protein identification via tandem mass spectrometry. Rapid Commun. Mass Spectrom. 2007, 21182985–2991. [DOI] [PubMed] [Google Scholar]
- Cox J.; Neuhauser N.; Michalski A.; Scheltema R. A.; Olsen J. V.; Mann M. Andromeda: a peptide search engine integrated into the MaxQuant environment. J. Proteome Res. 2011, 1041794–1805. [DOI] [PubMed] [Google Scholar]
- Geer L. Y.; Markey S. P.; Kowalak J. A.; Wagner L.; Xu M.; Maynard D. M.; Yang X.; Shi W.; Bryant S. H. Open mass spectrometry search algorithm. J. Proteome Res. 2004, 35958–964. [DOI] [PubMed] [Google Scholar]
- Fenyo D.; Beavis R. C. A method for assessing the statistical significance of mass spectrometry-based protein identifications using general scoring schemes. Anal. Chem. 2003, 754768–774. [DOI] [PubMed] [Google Scholar]
- Nesvizhskii A. I.; Vitek O.; Aebersold R. Analysis and validation of proteomic data generated by tandem mass spectrometry. Nat. Methods 2007, 410787–797. [DOI] [PubMed] [Google Scholar]
- Fu Y. Bayesian false discovery rates for post-translational modification proteomics. Stat. Interface 2012, 5, 47–59. [Google Scholar]
- Fu Y.; Qian X. Transferred subgroup false discovery rate for rare post-translational modifications detected by mass spectrometry. Mol. Cell. Proteomics 2013, O113, 030189. [DOI] [PMC free article] [PubMed] [Google Scholar]
- Seo J.; Jeong J.; Kim Y. M.; Hwang N.; Paek E.; Lee K. J. Strategy for comprehensive identification of post-translational modifications in cellular proteins, including low abundant modifications: application to glyceraldehyde-3-phosphate dehydrogenase. J. Proteome Res. 2008, 72587–602. [DOI] [PubMed] [Google Scholar]
- Huang X.; Huang L.; Peng H.; Guru A.; Xue W.; Hong S. Y.; Liu M.; Sharma S.; Fu K.; Caprez A. P.; Swanson D. R.; Zhang Z.; Ding S. J. ISPTM: an iterative search algorithm for systematic identification of post-translational modifications from complex proteome mixtures. J. Proteome Res. 2013, 1293831–3842. [DOI] [PMC free article] [PubMed] [Google Scholar]
- Britton L. M.; Gonzales-Cope M.; Zee B. M.; Garcia B. A. Breaking the histone code with quantitative mass spectrometry. Expert Rev. Proteomics 2011, 85631–643. [DOI] [PMC free article] [PubMed] [Google Scholar]
- DiMaggio P. A. Jr.; Young N. L.; Baliban R. C.; Garcia B. A.; Floudas C. A. A mixed integer linear optimization framework for the identification and quantification of targeted post-translational modifications of highly modified proteins using multiplexed electron transfer dissociation tandem mass spectrometry. Mol. Cell. Proteomics 2009, 8112527–2543. [DOI] [PMC free article] [PubMed] [Google Scholar]
- Chen Y.; Chen W.; Cobb M. H.; Zhao Y. PTMap--a sequence alignment software for unrestricted, accurate, and full-spectrum identification of post-translational modification sites. Proc. Natl. Acad. Sci. U. S. A. 2009, 1063761–766. [DOI] [PMC free article] [PubMed] [Google Scholar]
- Frank A. M.; Pesavento J. J.; Mizzen C. A.; Kelleher N. L.; Pevzner P. A. Interpreting top-down mass spectra using spectral alignment. Anal. Chem. 2008, 8072499–2505. [DOI] [PubMed] [Google Scholar]
- Guan S.; Burlingame A. L. Data processing algorithms for analysis of high resolution MSMS spectra of peptides with complex patterns of posttranslational modifications. Mol. Cell. Proteomics 2010, 95804–810. [DOI] [PMC free article] [PubMed] [Google Scholar]
- Wenger C. D.; Phanstiel D. H.; Lee M. V.; Bailey D. J.; Coon J. J. COMPASS: a suite of pre- and post-search proteomics software tools for OMSSA. Proteomics 2011, 1161064–1074. [DOI] [PMC free article] [PubMed] [Google Scholar]
- Deutsch E. W.; Mendoza L.; Shteynberg D.; Farrah T.; Lam H.; Tasman N.; Sun Z.; Nilsson E.; Pratt B.; Prazen B.; Eng J. K.; Martin D. B.; Nesvizhskii A. I.; Aebersold R. A guided tour of the Trans-Proteomic Pipeline. Proteomics 2010, 1061150–1159. [DOI] [PMC free article] [PubMed] [Google Scholar]
- Cox J.; Mann M. MaxQuant enables high peptide identification rates, individualized p.p.b.-range mass accuracies and proteome-wide protein quantification. Nat. Biotechnol. 2008, 26121367–1372. [DOI] [PubMed] [Google Scholar]
- Zee B. M.; Britton L. M.; Wolle D.; Haberman D. M.; Garcia B. A. Origins and formation of histone methylation across the human cell cycle. Mol. Cell. Biol. 2012, 32132503–2514. [DOI] [PMC free article] [PubMed] [Google Scholar]
- Lin S.; Garcia B. A. Examining histone posttranslational modification patterns by high-resolution mass spectrometry. Methods Enzymol. 2012, 512, 3–28. [DOI] [PMC free article] [PubMed] [Google Scholar]
- Zee B. M.; Levin R. S.; Dimaggio P. A.; Garcia B. A. Global turnover of histone post-translational modifications and variants in human cells. Epigenet. Chromatin 2010, 3122. [DOI] [PMC free article] [PubMed] [Google Scholar]
- Yuan Z. F.; Liu C.; Wang H. P.; Sun R. X.; Fu Y.; Zhang J. F.; Wang L. H.; Chi H.; Li Y.; Xiu L. Y.; Wang W. P.; He S. M. pParse: a method for accurate determination of monoisotopic peaks in high-resolution mass spectra. Proteomics 2012, 122226–235. [DOI] [PubMed] [Google Scholar]
- Sashimi. http://sourceforge.net/projects/sashimi/files/.
- Elias J. E.; Gygi S. P. Target-decoy search strategy for increased confidence in large-scale protein identifications by mass spectrometry. Nat. Methods 2007, 43207–214. [DOI] [PubMed] [Google Scholar]
- Keller A.; Nesvizhskii A. I.; Kolker E.; Aebersold R. Empirical statistical model to estimate the accuracy of peptide identifications made by MS/MS and database search. Anal. Chem. 2002, 74205383–5392. [DOI] [PubMed] [Google Scholar]
- Young N. L.; Dimaggio P. A.; Garcia B. A. The significance, development and progress of high-throughput combinatorial histone code analysis. Cell. Mol. Life Sci. 2010, 67233983–4000. [DOI] [PMC free article] [PubMed] [Google Scholar]
- Ong S. E.; Blagoev B.; Kratchmarova I.; Kristensen D. B.; Steen H.; Pandey A.; Mann M. Stable isotope labeling by amino acids in cell culture, SILAC, as a simple and accurate approach to expression proteomics. Mol. Cell. Proteomics 2002, 15376–386. [DOI] [PubMed] [Google Scholar]
Associated Data
This section collects any data citations, data availability statements, or supplementary materials included in this article.